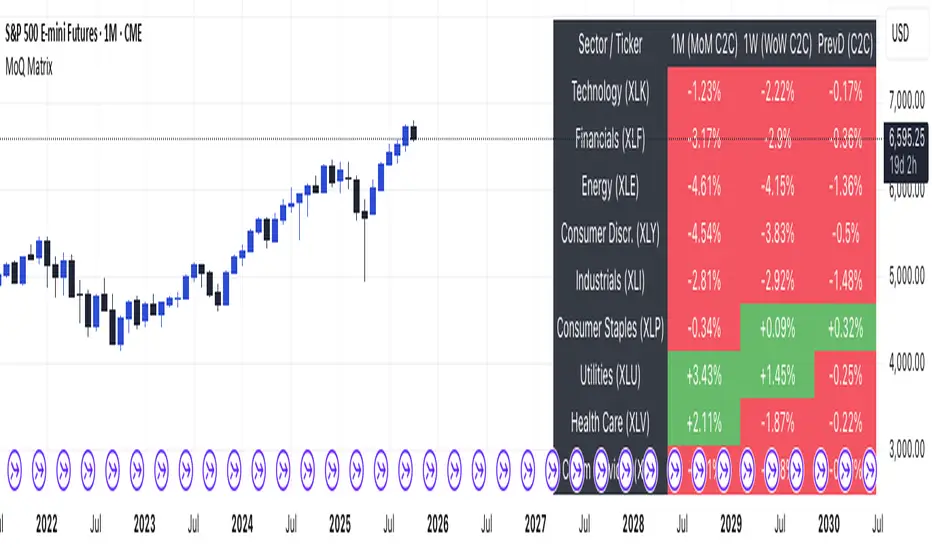
MomentumQ Sector MatrixMomentumQ Sector Matrix — Multi-Timeframe & Sector Performance Dashboard
The MomentumQ Sector Matrix is a professional dashboard-style indicator designed to help traders quickly evaluate sector performance and momentum alignment across multiple timeframes.
It provides an instant visual snapshot of how each major U.S. sector is performing, helping traders identify strength, weakness, and rotation trends without switching between charts.
What It Does
MomentumQ Sector Matrix consolidates multi-timeframe return data (1-Month, 1-Week, and 1-Day) into a clean, color-coded table.
Each sector’s cell displays percentage performance, automatically colored green or red based on relative gains or losses.
This tool serves as a sector rotation map , letting traders:
Spot which parts of the market are leading or lagging
Track momentum alignment across monthly, weekly, and daily timeframes
Instantly identify broad market conditions (risk-on vs. risk-off)
Key Features
1. Multi-Timeframe Sector Overview
Displays percentage returns for major SPDR sectors on 1-Month, 1-Week, and 1-Day bases.
Toggle between Today and PrevD (previous day) return modes.
2. Adaptive Table Layout
Fully resizable — choose Small, Medium, or Large table sizes for the best fit on your chart.
Works seamlessly with both light and dark TradingView themes.
3. Light / Dark Mode Support
Switch between modes to automatically match your chart background.
4. Performance-Based Coloring
Green for positive returns, red for negative, gray for neutral.
Provides clear visual contrast even in compact layouts.
5. Instant Market Context
Gain quick insight into overall market strength or weakness.
Ideal for top-down analysis, ETF rotation strategies, and macro confirmation.
How to Use
Add the indicator to any chart (symbol-independent).
Choose your preferred table position and size in the settings panel.
Use 1M / 1W / 1D readings to align your trading bias with higher-timeframe context.
Why It’s Valuable
Consolidates sector analysis into a single, easy-to-read dashboard
Helps identify macro trends and sector leadership quickly
Supports both swing and intraday trading approaches
Complements existing momentum or regime-tracking systems
Disclaimer
This indicator is a technical analysis tool for educational and informational purposes only.
It does not constitute financial advice and does not guarantee profitability.
Always perform your own analysis and use proper risk management.
Statistics
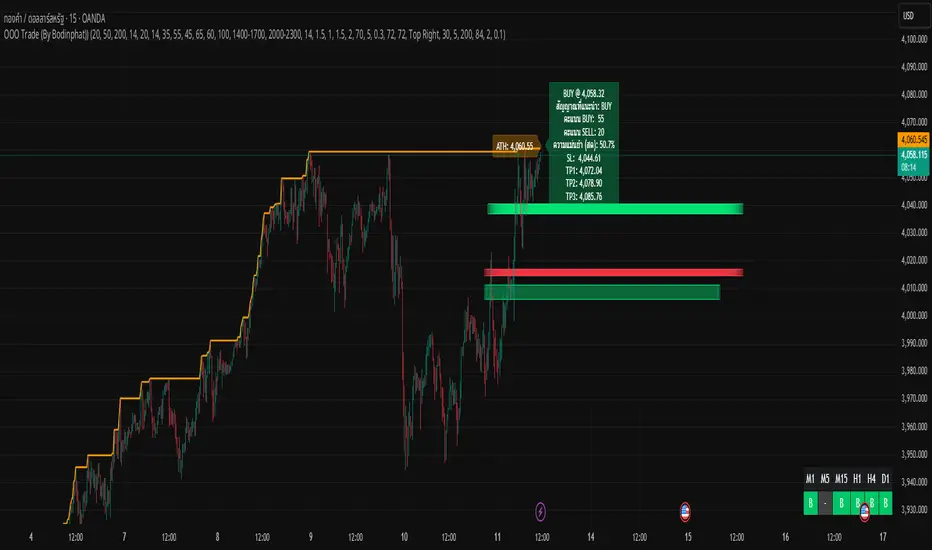
OOO Trade (By Bodinphat) V.2Description:
This indicator is an advanced trend-following system that combines multi-timeframe signals, order block zones (OB Zones), and precision-based metrics to help traders identify high-probability buy and sell opportunities.
It automatically analyzes EMA trends, RSI pullbacks, ADX strength, and volume confirmation to calculate a dynamic confidence score for both long and short directions.
The system also displays:
📊 Multi-Timeframe Trend Strip (M1 → D1) — showing each timeframe’s directional bias (Buy/Sell/Neutral).
🎯 OB Zones (Order Blocks) — highlights institutional demand (Bullish OB) and supply (Bearish OB) zones on the chart.
📋 Right-Side Info Panel — displays key metrics such as score, accuracy, SL/TP targets, and bias direction in real-time.
⚡ Session Filters — optional London/NY session filters for more accurate signal alignment.
This tool is ideal for traders who want to follow structured price action while maintaining a clear view of market strength and institutional zones.
It works best with XAUUSD, GBPUSD, and major indices on intraday or swing timeframes.
OOO Trade (By Bodinphat)Script Description (for TradingView Publish Page)
Description:
This indicator is an advanced trend-following system that combines multi-timeframe signals, order block zones (OB Zones), and precision-based metrics to help traders identify high-probability buy and sell opportunities.
It automatically analyzes EMA trends, RSI pullbacks, ADX strength, and volume confirmation to calculate a dynamic confidence score for both long and short directions.
The system also displays:
📊 Multi-Timeframe Trend Strip (M1 → D1) — showing each timeframe’s directional bias (Buy/Sell/Neutral).
🎯 OB Zones (Order Blocks) — highlights institutional demand (Bullish OB) and supply (Bearish OB) zones on the chart.
📋 Right-Side Info Panel — displays key metrics such as score, accuracy, SL/TP targets, and bias direction in real-time.
⚡ Session Filters — optional London/NY session filters for more accurate signal alignment.
This tool is ideal for traders who want to follow structured price action while maintaining a clear view of market strength and institutional zones.
It works best with XAUUSD, GBPUSD, and major indices on intraday or swing timeframes.
Disclaimer:
This indicator is for educational and informational purposes only.
It does not constitute financial advice. Please test thoroughly before using in live trading.

Michal D. Lagless Moving Average | MisinkoMasterThe 𝕸𝖎𝖈𝖍𝖆𝖑 𝕯. 𝕷𝖆𝖌𝖑𝖊𝖘𝖘 𝕸𝖔𝖛𝖎𝖓𝖌 𝕬𝖛𝖊𝖗𝖆𝖌𝖊 is my latest creation of a trend following tool, which is a bit different from the rest. By trying to de-lag the classical moving average, it gives you fast signals on changes in trend as fast as possible, keeping traders & investors always in check for potential risks they might want to avoid.
How does it work?
First we need to calculate lengths. The lengths are calcuted using a user defined input called the "Length Multiplier" and we of course need as well the length input too.
The indicator uses 10 lengths, 5 for an average price, 5 for median price.
The length for the average is the following:
length_2_avg = length_1_avg * length_multiplier
length_3_avg = length_2_avg * length_multiplier
...
and for the median lengths:
length_1_median = length_2_avg
length_2_median = length_3_avg
Here applies this rule
length_x_median < length_x_avg
This is intentional, and it is because the average is a little more reactive, while the median is a bit slower. To make up for the "slowness" of the median, we simple reduce the length of it a bit more than the average.
Now that we have our length we are ready to calculate averages and medians over their respective period. This is the a normal average from elementary school, nothing too fancy.
Now that we have all of them we match the pairs using another user defined input called "Median Weight" like so:
(Average_x * (2-median_weight) + Median_x * median_weight)/2
This gives more weight to the average (also due to the max value limit set to avoid breaking the fundational logic behind it).
After doing it to all the pairs we now average those pairs using another input called "Exponential Weight Multiplier".
The Exponential Weight Multiplier is used for weights which I will cover soon:
weight1 = weight
weight2 = weight * weight
weight3 = weight * weight * weight....
This is done until we have all the weights calculated
This gives exponentially more weight to the less lagging indicators, which is how we delag the indicator.
Then we sum all the pairs like so:
sum = pair1 * weight1 + pair2 * weight2 + pair3 * weight3 + pair4 * weight4 + pair5 * weight5
Then the sum is divided by the sum of weights, this results in us getting the final value.
Methodology & What is the actual point & how was it made?
I want to cover this one a bit deeper:
The methodology behind this was creating an indicator that would not be lagging, and would be able to avoid lag while not producing signals too often.
In many attempts in the first part, I tried using EMA, RMA, DEMA, TEMA, HMA, SMA and so on, but they were too noisy (except for SMA & RMA, but those had their flaws), so I tried the classical average taught in elementary school. This one worked better, but the noise was too high still after all this time. This made me include the median, which helped the noise, but made it far too lagging.
Here came the idea of making the median length lower and adding weights to counter the lag of the median, but it was still too lagging. This made me make the weights for lengths more exponential, while previously they were calculated using a little bit amplified sums that were alright, but nowhere near my desired result.
Using the new weights I got further, and after a bit of testing I was sattisfied with the results.
The logic for the trend was a big part in my development part, there were many I could think of, but not enough time to try them, so I stuck to the usual one, and I leave it up to YOU to beat my trend logic and get even better results.
Use Cases:
- Price/MA Crossovers
Simple, effective, useful
- Source for other indicators
This I tried myself, and it worked in a cool way, making the signals of for example RSI much smoother, so definitely try it out if you know how to code, or just simply put it in the source of the RSI.
- ROC
This trend logic stuck with me, I think you could find a way to make it good, but mainly for the people that can code in pine, trying out to combine the trend logic with ROC could work very well, do not sleep on it!
- Education
This concept is not really that complex, so for people looking for new ideas, inspiration, or just watching how trend following tools behave in general this is something that could benefit anyone, as the concept can be applied to ANYTHING, even the classical RSI, MACD, you could try even the Parabolic SAR, maybe STC or VZO, there is no limit to imagination.
- Strategy creation
Filtering this indicator with "and" conditions, or maybe even "or" or anything really could be very useful in a strategy that desires fast signals.
- Price Distance from bands
I noticed this while looking at past performance:
The stronger the trend the higher the distance from the Moving Average.
Final Notes
Watch out for mean reverting markets, as this is trend following you could get easily screwed in them.
Play around with this if it fits your desired outcome, you might find something I did not.
Hope you find it useful,
See you next time!

Stochastic %K Colored by VolumeDescription:
"Stochastic %K Colored by Volume is a technical indicator that combines the traditional Stochastic %K oscillator with volume-based coloring. It highlights periods of high, low, and neutral trading volume by changing the color of the %K line. Additionally, it identifies bullish and bearish divergences between price and the %K oscillator, helping traders spot potential reversals and trend changes. The indicator also includes key levels for overbought, oversold, and extreme zones to guide trading decisions."

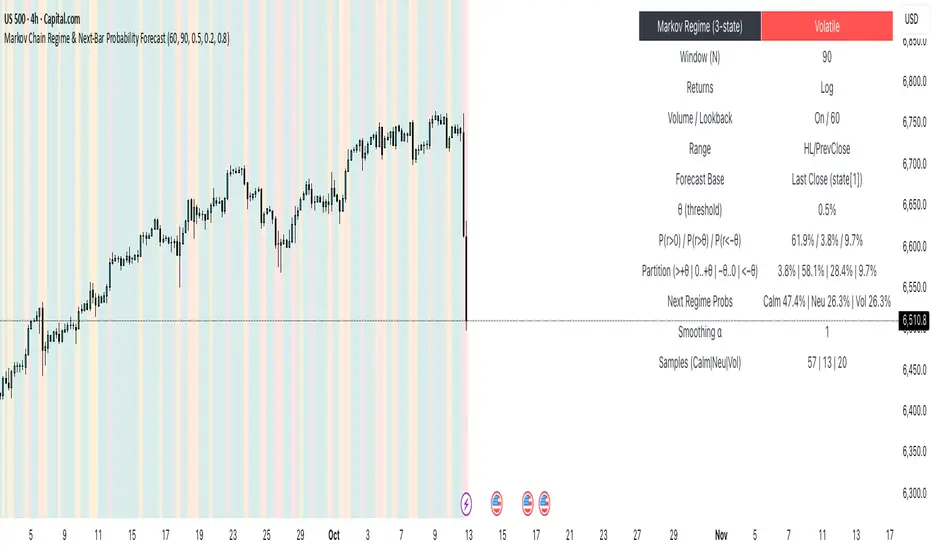
Markov Chain Regime & Next‑Bar Probability Forecast✨ What it is
A regime-aware, math-driven panel that forecasts the odds for the very next candle. It shows:
• P(next r > 0)
• P(next r > +θ)
• P(next r < −θ)
• A 4-bucket split of next-bar outcomes (>+θ | 0..+θ | −θ..0 | <−θ)
• Next-regime probabilities: Calm | Neutral | Volatile
🧠 Why the math is strong
• Markov regimes: Markets cluster in volatility “moods.” We learn a 3-state regime S∈{Calm, Neutral, Volatile} with a transition matrix A, where A = P(Sₜ₊₁=j | Sₜ=i).
• Condition on the future state: We estimate event odds given the next regime j—
q_pos(j)=P(rₜ₊₁>0 | Sₜ₊₁=j), q_gt(j)=P(rₜ₊₁>+θ | Sₜ₊₁=j), q_lt(j)=P(rₜ₊₁<−θ | Sₜ₊₁=j)—
and mix them with transitions from the current (or frozen) state sNow:
P(event) = Σⱼ A · q(event | j).
This mixture-of-regimes view (HMM-style one-step prediction) ties next-bar outcomes to where volatility is likely headed.
• Statistical hygiene: Laplace/Beta smoothing, minimum-sample gating, and unconditional fallbacks keep estimates stable. Heavy computations run on confirmed bars; “Freeze at close” avoids intrabar flicker.
📊 What each value means
• Regime label & background: 🟩 Calm, 🟧 Neutral, 🟥 Volatile — quick read of market context.
• P(next r > 0): Directional tilt for the very next bar.
• P(next r > +θ): Odds of an outsized positive move beyond θ.
• P(next r < −θ): Odds of an outsized negative move beyond −θ.
• Partition row: Distributes next-bar probability across four intuitive buckets; they ≈ sum to 100%.
• Next Regime Probs: Likelihood of switching to Calm/Neutral/Volatile on the next bar (row of A for the current/frozen state).
• Samples row: How many next-bar samples support each next-state estimate (a confidence cue).
• Smoothing α: The Laplace prior used to stabilize binary event rates.
⚙️ Inputs you control
• Returns: Log (default) or %
• Include Volume (z-score) + lookback
• Include Range (HL/PrevClose)
• Rolling window N (transitions & estimates)
• θ as percent (e.g., 0.5%)
• Freeze forecast at last close (recommended)
• Display toggles (plots, partition, samples)
🎯 How to use it
• Volatility awareness & sizing: Rising P(next regime = Volatile) → consider smaller size, wider stops, or skipping marginal entries.
• Breakout preparation: Elevated P(next r > +θ) highlights environments where range expansion is more likely; pair with your setup/trigger.
• Defense for mean-reversion: If P(next r < −θ) lifts while you’re late long (or P(next r > +θ) lifts while late short), tighten risk or wait for better context.
• Calibration tip: Start θ near your market’s typical bar size; adjust until “>+θ” flags truly meaningful moves for your timeframe.
📝 Method notes & limits
Activity features (|r|, volume z, range) are standardized; only positive z’s feed the composite activity score. Estimates adapt to instrument/timeframe; rare regimes or small windows increase variance (hence smoothing, sample gating, fallbacks). This is a context/forecast tool, not a standalone signal—combine with your entry/exit rules and risk management.
🧩 Strategies too
We also develop full strategy versions that use these probabilities for entries, filters, and position sizing. Like this publication if you’d like us to release the strategy edition next.
⚠️ Disclaimer
Educational use only. Not financial advice. Markets involve risk. Past performance does not guarantee future results.
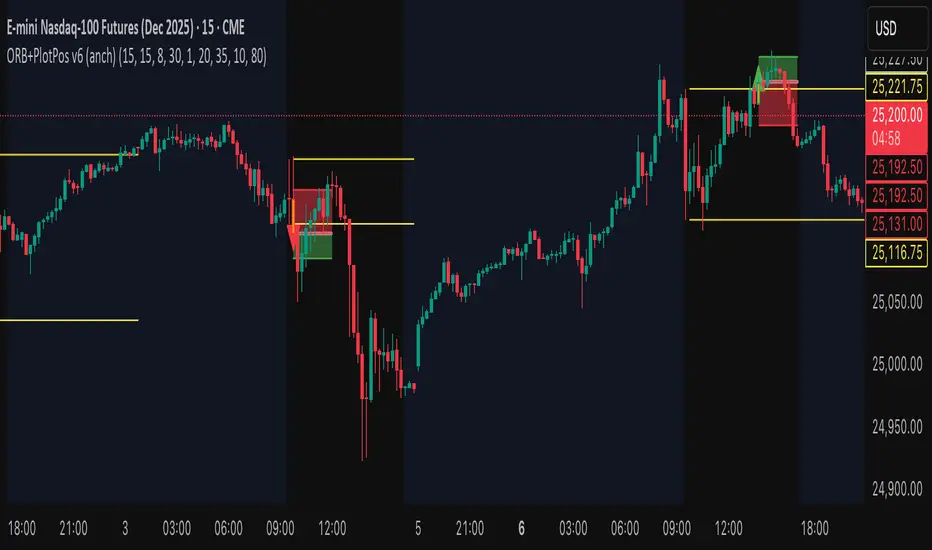
Opening Range Fibonacci Extensions (ATR Adjusted)this script displays daily, weekly, or monthly range extensions as a function of ATR in a Fibonacci retracement

SJA WINFUT B3-10
INDICATOR FOR WINFUT B3 – 5-minute chart.
This indicator was designed to trade the Bovespa index futures contract (WINFUT) on the 5-minute chart.
It integrates technical analysis and macroeconomic context elements.
It combines several indicators in which the system calculates a score weighted by color and intensity for each indicator, generating a metric called “STRENGTH %,” which reflects the dominance of buyers (green), sellers (red), or sideways movement (orange) at the moment.
The calculation is adapted to market hours:
Between 9:00 a.m. and 9:59 a.m., it considers only the available indicators; after 10:00 a.m., it uses all data.
The panel displays real-time information, including divergences between strength and price, providing robust decision support for short-term operations on the mini index.
Buying trend.
The more green indicators (at the top of the panel) and dark blue indicators (at the bottom of the panel) and the higher the strength percentage, the greater the probability of buying.
Selling trend.
The more red indicators (at the top of the panel) and dark blue indicators (at the bottom of the panel) and the higher the strength percentage, the greater the probability of selling.
Translated with DeepL.com (free version)

SJA WINFUT B3-BRINDICATOR FOR WINFUT B3 – 5-minute chart.
This indicator was designed to trade the Bovespa index futures contract (WINFUT) on the 5-minute chart.
It integrates technical analysis and macroeconomic context elements.
It combines several indicators in which the system calculates a score weighted by color and intensity for each indicator, generating a metric called “STRENGTH %,” which reflects the dominance of buyers (green), sellers (red), or sideways movement (orange) at the moment.
The calculation is adapted to market hours:
Between 9:00 a.m. and 9:59 a.m., it considers only the available indicators; after 10:00 a.m., it uses all data.
The panel displays real-time information, including divergences between strength and price, providing robust decision support for short-term operations on the mini index.
Buying trend.
The more green indicators (at the top of the panel) and dark blue indicators (at the bottom of the panel) and the higher the strength percentage, the greater the probability of buying.
Selling trend.
The more red indicators (at the top of the panel) and dark blue indicators (at the bottom of the panel) and the higher the strength percentage, the greater the probability of selling.

Swing Data - SimplifiedThe swing data indicator by jfsrev but simplified. Thank you jfsrev for your work!
CPR by VictorVCentral Pivot Range
Where price is vs CPR
Above TC: bullish bias; TC/BC act as support. Hold above TC → trend day likely.
Inside CPR (BC–TC): balanced/choppy; expect mean reversion between edges until a clean break.
Below BC: bearish bias; BC/TC act as resistance.
Width of the CPR
Narrow: energy coiled → higher chance of breakout/trend day.
Wide: balanced market → range-bound behavior more likely.
Shift vs yesterday
CPR shifted up: bullish undertone.
Shifted down: bearish undertone.
Overlapping: neutral/indecisive.
Intraday tells
Acceptance: Several candles holding outside BC/TC = expansion in that direction.
Rejection: Wicks through BC/TC that close back inside = likely fade back toward the opposite edge.
Pivot (P) magnet: On non-trend days, price often gravitates back to P.

Rebound Sigma Pro - IndicatorOverview
Rebound Sigma Pro is a mean-reversion indicator that detects statistically oversold conditions in trending markets.
It helps traders identify potential short-term rebounds based on momentum exhaustion and volatility-adjusted entry zones.
Concept
The indicator combines two quantitative components:
Short-term momentum to detect short-term exhaustion
Trend filter to ensure setups align with the long-term direction
When a stock in an uptrend becomes temporarily oversold, a limit-entry signal is plotted.
The trade is then tracked until short-term conditions normalize or a time-based exit occurs.
Visual Signals
Green Triangle: Suggests placing a limit order for the next session
Green Circle: Confirms entry was filled
Red Triangle: Signals an exit for the next session’s open
Orange Background: Pending order
Green Background: Position active
Red Background: Exit phase
Yellow Line: Entry reference price
User Inputs
Limit Entry (% below previous close) – Default 1 %
Use Limit Entry – Switch between limit or market entries
Enable Time Exit – Optional holding-period constraint
Maximum Holding Days
All other internal parameters (momentum length, filters) are pre-configured.
Alerts
Limit Order Signal: New setup detected
Entry Confirmed: Order filled
Exit Signal: Exit expected next day
Usage
Designed for liquid equities and ETFs
Works best in confirmed uptrends
Backtesting encouraged to adapt parameters per symbol and timeframe
Notes
Not an automated strategy; manual order execution required
Past behavior does not imply future performance
Always apply sound position sizing and risk management
Disclaimer
This indicator is provided for educational and analytical purposes only.
It does not constitute financial advice or performance assurance.

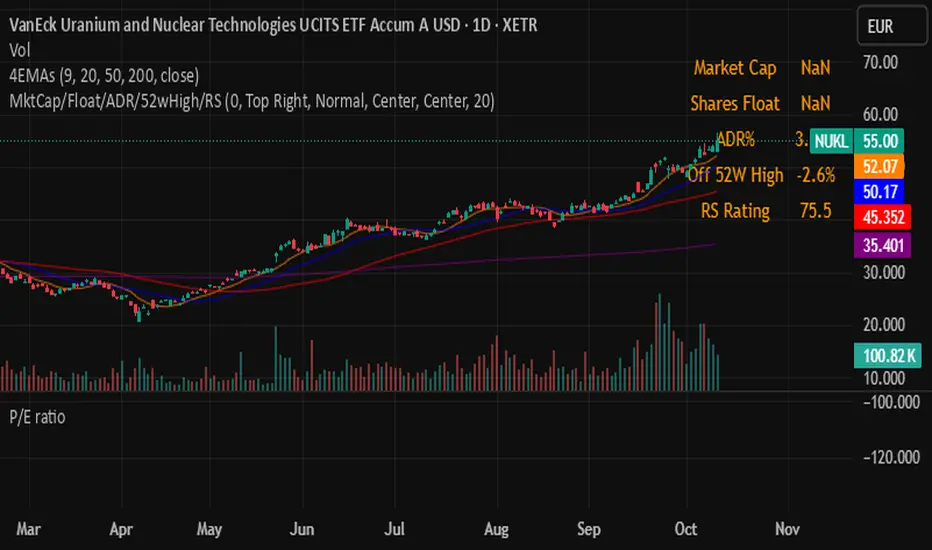
Uptrick: Relative Strength Rotation SystemIntroduction
The Uptrick: Relative Strength Rotation System is an indicator engineered to implement a regime-aware tactical allocation strategy across a predefined set of user-specified assets. It visualizes a simulated equity curve produced by a closed, managed rotation engine. The system is designed to identify relative strength relationships dynamically and rotate into stronger-performing assets, while offering an optional fallback into a defensive state when market conditions are deemed unfavorable by the logic.
Overview
This indicator allocates capital by continuously evaluating the relative strength between all asset pairs within the selected group. Unlike simplistic momentum models or rank-based selectors, this system uses internally calculated scores that compare each asset across multiple dimensions, forming a comprehensive decision matrix. These scores are evaluated through a regime-aware layer that determines whether the system should remain invested or move into an idle allocation. The rotation logic is implemented through a rebalancing structure that maintains exposure to a single asset at any time, or transitions into a fallback asset such as cash or PAXG based on internal conditions. Outputs include a dynamically colored equity curve, context-sensitive labels, and optional overlays comparing buy-and-hold performance of the selected assets.
Originality
The indicator utilizes a scoring matrix based on custom asset-to-asset comparative ratios, resulting in a relational framework that evaluates assets in the context of each other rather than in isolation. Each asset is analyzed through multiple statistical dimensions, including trend strength and normalized deviation using Z-score calculations. These metrics form the foundation of an adaptive matrix used to derive consensus leadership. A key differentiator lies in the optional routing of idle allocations to PAXG—a tokenized gold asset—offering a non-cash defensive alternative that introduces both diversification and risk modulation not typically seen in rotation models. The engine also includes an override layer that filters decisions through market state awareness, adding tactical discipline during ambiguous or bearish regimes. Taken together, these features form a self-contained rotation mechanism with multiple embedded controls and fallback logic, all of which are abstracted from the user.
Inputs and Features
Exponential Length (EMA Length)
Specifies the smoothing length used by one of the internal scoring models. Lower values allow for more responsive asset comparisons, while longer values smooth out short-term volatility in score changes.
Z Score
Controls the statistical lookback length used for normalized relative comparisons. This Z-score is a cornerstone of the system’s comparative matrix, standardizing inter-asset ratio behaviors to detect statistically significant deviations from recent behavior. It allows the rotation engine to isolate and prioritize sustained leadership across assets, regardless of price volatility.
Rebalance Every N Bars
Sets how frequently the system evaluates potential changes in leadership. This controls the cadence of reallocation and can be tuned for faster or slower responsiveness.
When Bearish / Neutral, go to
Lets the user select how the system behaves during non-confirmed or bearish conditions. It can either route to a flat cash-equivalent state or into a user-defined defensive asset (such as PAXG), introducing an added layer of optional protection.
Cash Filter
Activates an override that forces the system into an idle state during unfavorable market regimes, even if a leader is otherwise present. This regime-aware mechanism adds another layer of conditional control to mitigate exposure risk.
Start Date
Defines the point in history from which the equity simulation begins. All calculations and equity values prior to this point are excluded.
Asset Inputs (Asset 1 to Asset 4)
Allow the user to specify up to four assets to be evaluated within the rotation universe. These may include crypto, forex, or other tradable symbols supported by TradingView.
PAXG Fallback Asset
Specifies the asset used as a fallback when the idle state is active and the defensive mode is set to PAXG rather than cash.
Color Settings
Users can customize the chart color palette for each asset and idle condition for enhanced clarity.
HODL Curve Toggles
Enable buy-and-hold equity curves for each input asset to be plotted for direct performance comparison with the system’s output.
Simple Mode
Reduces visual noise by simplifying the chart’s appearance and removing optional elements.
Background Color and Shadow Equity Fill
Offer additional styling options that reflect the system's current allocation, enhancing chart readability.
COLORED EQUITY CURVE - PAXG
COLORED EQUITY CURVE - CASH
SYSTEM
Current System Text Color
Allows further customization of label text for visibility across different asset themes.
Summary
The Uptrick: Relative Strength Rotation System is a rotation engine that leverages a proprietary scoring matrix to simulate tactical asset allocation. It analyzes inter-asset behavior through pairwise ratio metrics and statistically normalized scoring methods, enabling it to identify leadership dynamics within a defined universe. The inclusion of PAXG as a defensive fallback, regime-aware cash filtering, and customizable rebalancing cadence gives the system adaptability beyond traditional relative strength models. Users are provided with transparent visual feedback through an equity curve, contextual labels, buy-and-hold overlays, and real-time equity statistics. The system is not designed to disclose its internal mechanics, but it enables full visualization of its output and decisions for comparative analysis.
Disclaimer
This script is intended solely for educational and informational purposes. It does not constitute financial advice, trading signals, or an offer to buy or sell any financial instrument. Trading and investing carry risk, and past performance does not guarantee future outcomes. Users should perform their own research and consult a licensed financial advisor before making trading decisions.


AlphaRadar - Market📊 ALPHARADAR - MARKET MONITOR
⚠️ IMPORTANT
🔴 This indicator MUST be used ONLY on DAILY (1D) timeframe. It will not work correctly on other timeframes.
Overview:
Real-time market and sector performance dashboard displaying major US indices and all 11 sector ETFs in a single, organized panel. Track market rotation and sector strength at a glance.
Features:
- Market Indices (4): SPY (S&P 500), QQQ (Nasdaq), IWM (Russell 2000), DIA (Dow Jones)
- Sector ETFs (11): Complete coverage of all US market sectors
- Performance Tracking: Day, 5D, 1M, 6M, and YTD returns
- Color-Coded: 🟢 Green (positive) / 🔴 Red (negative) for instant visual analysis
What You Can Track:
✅ Market breadth (all indices moving together vs divergence)
✅ Sector rotation (which sectors are leading/lagging)
✅ Risk-on vs Risk-off sentiment
✅ Short-term momentum (Day, 5D)
✅ Medium-term trends (1M, 6M)
✅ Year-to-date performance leaders
Market Sectors Included:
- XLC (Communication)
- XLY (Consumer Discretionary)
- XLP (Consumer Staples)
- XLE (Energy)
- XLF (Financials)
- XLV (Healthcare)
- XLI (Industrials)
- XLB (Materials)
- XLRE (Real Estate)
- XLK (Technology)
- XLU (Utilities)
How to Use:
🔍 Spot Market Rotation: Identify which sectors are outperforming
📈 Confirm Trends: All green = strong market, all red = market weakness
⚡ Find Opportunities: Rotate into leading sectors, avoid lagging ones
🎯 Risk Management: Divergence between indices = potential warning signal
Best For:
- Sector rotation strategies
- Market breadth analysis
- Swing trading
- Portfolio allocation decisions
- Daily market monitoring
Notes:
- Data updates in real-time during market hours
- All calculations based on daily closing prices
- Works with any chart symbol
- Free to use
🔔 Remember: Use DAILY (1D) charts only!

CISD Risk Calculator for futures tradingCISD Risk Calculator Indicator Explanation
The CISD Risk Calculator is a specialized trading indicator that helps traders identify key market structure changes and automatically calculate optimal position sizing based on risk parameters. Here's a detailed explanation of what it does:
Core Functionality: CISD Detection
CISD stands for "Change In Structure Direction," which identifies important shifts in market structure:
Market Structure Analysis: The indicator constantly analyzes price action to detect when the market structure changes from bullish to bearish or vice versa.
Bullish CISD: Occurs when price makes a higher high, then retraces, but fails to make a lower low. This suggests a potential bullish continuation.
Bearish CISD: Occurs when price makes a lower low, then bounces, but fails to make a higher high. This suggests a potential bearish continuation.
Risk Calculation Features
The primary purpose of this modified indicator is to calculate trading risk:
Points Risk Calculation: The indicator measures the distance in points (price units) between the current price and the relevant structure level (high or low).
Automatic Contract Value Detection: It automatically detects what instrument you're trading (ES, NQ, MES, MNQ) and applies the correct point value:
NQ: $20 per point
MNQ: $2 per point
ES: $50 per point
MES: $5 per point
Position Sizing Calculation: Using your inputted dollar risk amount (e.g., $250), it calculates exactly how many contracts you should trade to maintain that risk level.
Visual Interface
The indicator has a minimalist design:
Central Display Panel: Shows key information at the top center of your chart:
CISD Type (Bullish or Bearish)
Points Risk (distance to your stop level)
Trade Risk (recommended number of contracts)
Invisible CISD Levels: The actual CISD lines and markers are completely invisible, keeping your chart clean while still performing calculations.
Simple Settings: Only shows essential settings:
Dollar Risk Amount: How much money you want to risk
Label Color and Text Color: For visual customization
Text Size: Adjusts the display size

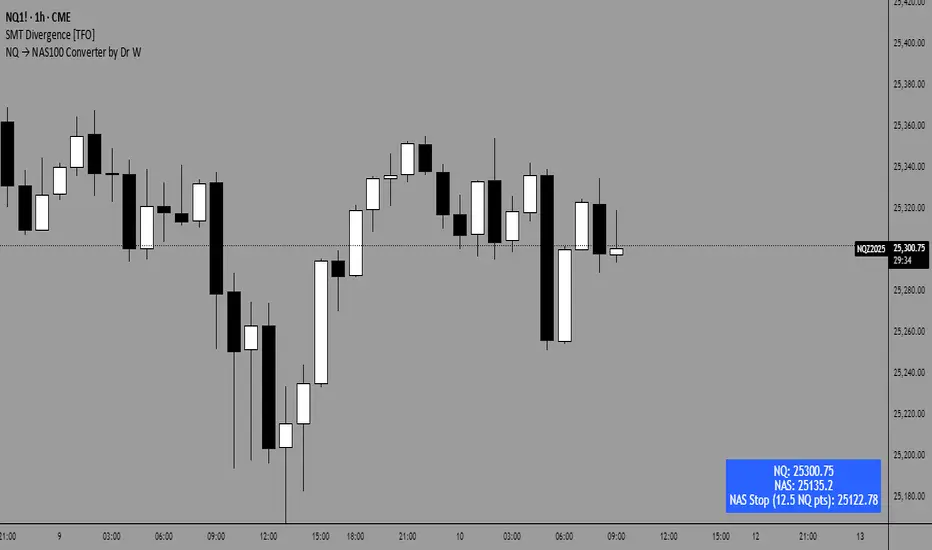
NQ → NAS100 Converter by Dr WThis indicator allows traders to quickly and accurately convert stop levels from NQ (E-mini Nasdaq futures) to NAS100 (CFD) values, helping users who trade across different instruments to manage risk consistently.
Key Features:
Real-time Price Conversion:
Displays the current NQ futures price and the corresponding NAS100 price on your chart, updated every bar.
Stop Distance Conversion:
Converts a user-defined stop distance in NQ points into the equivalent NAS100 stop level using proportional scaling based on current market prices.
Customizable Labels:
Choose between Candle-attached labels (appearing near the bar) or Chart-fixed labels (HUD style).
Adjust label position, background color, text color, and label style (left, right, center).
Flexible Display Options:
Show/hide NQ price, NAS100 price, and converted stop independently.
Perfect for traders who want a quick visual reference without cluttering the chart.
Trading Direction Support:
Select Long or Short trades, and the stop conversion automatically adapts to the trade direction.
How It Works:
The indicator requests the latest NQ and NAS100 prices at your chart’s timeframe.
It calculates the NAS100 stop using the formula:
NAS_Stop = NAS_Price ± (Stop_NQ_Points / NQ_Price * NAS_Price)
+ is used for short trades, - for long trades.
The converted stop, along with the underlying prices, is displayed according to your label settings.
Use Cases:
Risk management for cross-instrument traders.
Quickly visualizing equivalent stops when trading NQ futures vs NAS100 CFDs.
An educational tool to understand proportional stop sizing between instruments.
TradingView Policy Compliance Notes:
The indicator does not provide trading advice or signals; it only performs calculations and visualizations.
It does not execute trades or connect to brokerage accounts.
All values displayed are informational only; users should independently verify stop levels before placing trades.

Aladin Pair Trading System v1Aladin Pair Trading System v1
What is This Indicator?
The Aladin Pair Trading System is a sophisticated tool designed to help traders identify profitable opportunities by comparing two related stocks that historically move together. Think of it as finding when one twin is running ahead or lagging behind the other - these moments often present trading opportunities as they tend to return to moving together.
Who Should Use This?
Beginners: Learn about statistical arbitrage and pair trading
Intermediate Traders: Execute mean-reversion strategies with confidence
Advanced Traders: Fine-tune parameters for optimal pair relationships
Portfolio Managers: Implement market-neutral strategies
💡 What is Pair Trading?
Imagine two ice cream shops next to each other. They usually have similar customer traffic because they're in the same area. If one day Shop A is packed while Shop B is empty, you might expect this imbalance to correct itself soon.
Pair trading works the same way:
You find two stocks that normally move together (like TCS and Infosys)
When one stock moves too far from the other, you trade expecting them to realign
You buy the lagging stock and sell the leading stock
When they come back together, you profit from both sides
Key Features
1. Z-Score Analysis
What it is: A statistical measure showing how far the price relationship has deviated from normal
What it means:
Z-Score near 0 = Normal relationship
Z-Score at +2 = Stock A is expensive relative to Stock B (Sell A, Buy B)
Z-Score at -2 = Stock A is cheap relative to Stock B (Buy A, Sell B)
2. Multiple Timeframe Analysis
Long-term Z-Score (300 bars): Shows the big picture trend
Short-term Z-Score (100 bars): Shows recent movements
Signal Z-Score (20 bars): Generates quick trading signals
3. Statistical Validation
The indicator checks if the pair is suitable for trading:
Correlation (must be > 0.7): Confirms the stocks move together
1.0 = Perfect positive correlation
0.7 = Strong correlation
Below 0.7 = Warning: pair may not be reliable
ADF P-Value (should be < 0.05): Tests if the relationship is stable
Low value = Good for pair trading
High value = Relationship may be random
Cointegration: Confirms long-term equilibrium relationship
YES = Pair tends to revert to mean
NO = Pair may drift apart permanently
Visual Elements Explained
Chart Zones (Color-Coded Areas)
Yellow Zone (-1.5 to +1.5)
Normal Zone: Relationship is stable
Action: Wait for better opportunities
Blue Zone (±1.5 to ±2.0)
Entry Zone: Deviation is significant
Action: Prepare for potential trades
Green/Red Zone (±2.0 to ±3.0)
Opportunity Zone: Strong deviation
Action: High-probability trade setups
Beyond ±3.0
Risk Limit: Extreme deviation
Action: Either maximum opportunity or structural break
Signal Arrows
Green Arrow Up (Buy A + Sell B):
Stock A is undervalued relative to B
Buy Stock A, Short Stock B
Red Arrow Down (Sell A + Buy B):
Stock A is overvalued relative to B
Sell Stock A, Buy Stock B
Settings Guide
Symbol Inputs
Pair Symbol (Symbol B): Choose the second stock to compare
Default: NSE:INFY (Infosys)
Example pairs: TCS/INFY, HDFCBANK/ICICIBANK, RELIANCE/ONGC
Z-Score Parameters
Long Z-Score Period (300): Historical context
Short Z-Score Period (100): Recent trend
Signal Period (20): Trading signals
Z-Score Threshold (2.0): Entry trigger level
Higher = Fewer but stronger signals
Lower = More frequent signals
Statistical Parameters
Correlation Period (240): How many bars to check correlation
Hurst Exponent Period (50): Measures mean-reversion tendency
Probability Lookback (100): Historical probability calculations
Trading Parameters
Entry Threshold (0.0): Minimum Z-score for entry
Risk Threshold (1.5): Warning level
Risk Limit (3.0): Maximum deviation to trade
How to Use (Step-by-Step)
Step 1: Choose Your Pair
Add the indicator to your chart (this becomes Stock A)
In settings, select Stock B (the comparison stock)
Choose stocks from the same sector for best results
Step 2: Verify Pair Quality
Check the Statistics Table (top-right corner):
✅ Correlation > 0.70 (Green = Good)
✅ ADF P-value < 0.05 (Green = Good)
✅ Cointegrated = YES (Green = Good)
If all three are green, the pair is suitable for trading!
Step 3: Wait for Signals
BUY SIGNAL (Green Arrow Up)
Z-Score crosses above -2.0
Action: Buy Stock A, Sell Stock B
Exit: When Z-Score returns to 0
SELL SIGNAL (Red Arrow Down)
Z-Score crosses below +2.0
Action: Sell Stock A, Buy Stock B
Exit: When Z-Score returns to 0
Step 4: Risk Management
Yellow Zone: Monitor only
Blue Zone: Prepare for entry
Green/Red Zone: Active trading zone
Beyond ±3.0: Maximum risk - use caution
⚠️ Important Warnings
Not All Pairs Work: Always check the statistics table first
Market Conditions Matter: Correlation can break during market stress
Use Stop Losses: Set stops at Z-Score ±3.5 or beyond
Position Sizing: Trade both legs with appropriate hedge ratios
Transaction Costs: Factor in brokerage and slippage for both stocks
Example Trade
Scenario: TCS vs INFOSYS
Correlation: 0.85 ✅
Z-Score: -2.3 (TCS is cheap vs INFY)
Action to be taken:
Buy 1lot of TCS Future
Sell 1lot of INFOSYS Future
Expected Outcome:
As Z-Score moves toward 0, TCS outperforms INFOSYS
Close both positions when Z-Score crosses 0
Profit from the convergence
Best Practices
Test Before Trading: Use paper trading first
Sector Focus: Choose pairs from the same industry
Monitor Statistics: Check correlation daily
Avoid News Events: Don't trade pairs during earnings/major news
Size Appropriately: Start small, scale with experience
Be Patient: Wait for high-quality setups (±2.0 or beyond)
What Makes This Indicator Unique?
Multi-timeframe Z-Score analysis: Three different perspectives
Statistical validation: Built-in correlation and cointegration tests
Visual risk zones: Easy-to-understand color-coded areas
Real-time statistics: Live pair quality monitoring
Beginner-friendly: Clear signals with educational zones
Technical Background
The indicator uses:
Engle-Granger Cointegration Test: Validates pair relationship
ADF (Augmented Dickey-Fuller) Test: Tests stationarity
Pearson Correlation: Measures linear relationship
Z-Score Normalization: Standardizes deviations
Log Returns: Handles price differences properly
Support & Community
For questions, suggestions, or to share your pair trading experiences:
Comment below the indicator
Share your successful pair combinations
Report any issues for quick fixes
Disclaimer
This indicator is for educational and informational purposes only. It does not constitute financial advice. Pair trading involves risk, including the risk of loss.
Always:
Do your own research
Understand the risks
Trade with money you can afford to lose
Consider consulting a financial advisor
📌 Quick Reference Card
Z-ScoreInterpretationAction-3.0 to -2.0A very cheap vs BStrong Buy A, Sell B-2.0 to -1.5A cheap vs BBuy A, Sell B-1.5 to +1.5Normal rangeHold/Wait+1.5 to +2.0A expensive vs BSell A, Buy B+2.0 to +3.0A very expensive vs BStrong Sell A, Buy B
Good Pair Statistics:
Correlation: > 0.70
ADF P-value: < 0.05
Cointegration: YES
Version: 1.0
Last Updated: 10th October 2025
Compatible: TradingView Pine Script v6
Happy Trading!

KKF RangeIts a very unique range indicator that uses stochastics and volume bookmap and radp to view current trend to identify potential entries.
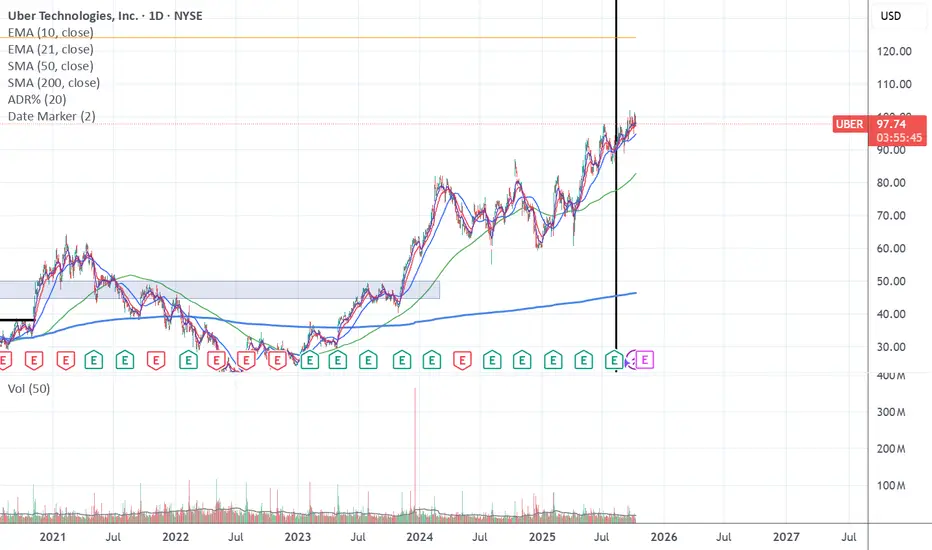
Date Marker📅 Date Marker
Date Marker is a simple, lightweight indicator that draws a single vertical line on a chosen date — ideal for quickly comparing how different charts looked at the same point in time.
Switch between symbols or timeframes, and the line automatically stays fixed at your selected date.
Perfect for studying market reactions to key events, earnings, announcements, or macro shifts.
Multi Brownian Forecast📊 Multi Brownian Forecast (Time-Adaptive, Probabilistic)
This indicator uses a sophisticated Geometric Brownian Motion (GBM) Monte Carlo simulation to project future price paths. It adapts to any chart timeframe and provides quantitative, multi-period probability signals.
---
🧠 Core Mathematical Methodology
The model relies on GBM, which is a continuous-time stochastic process that models asset prices.
1. Historical Analysis (Drift & Volatility):
* The script first calculates Logarithmic Returns over a user-defined Historical Lookback (Hours) .
* Drift ($\mu$): Computed as the average of the log returns.
* Volatility ($\sigma$): Computed as the standard deviation of the log returns.
* These values are then time-adapted to an hourly step, compensating for the chart's current timeframe (e.g., 5-minute, 1-hour).
2. Monte Carlo Simulation:
* It runs a specified Number of Simulations (e.g., 1000).
* For each simulation, the price is stepped forward hourly using the GBM formula, which incorporates the calculated drift and a random shock drawn from a normal distribution (generated via the Box-Muller transform ).
---
✨ Key Features
Probabilistic Quartile Forecast: Plots a dynamic "cone" of probability on the chart. It shows key price percentiles (Q1, Q2/Median, Q3, and Q4/Outer Bound) at the forecast's expiration, visualizing the expected range of price outcomes based on the simulations.
Multi-Period Probability Signals: This is the core signal feature. Users can define multiple, independent forecast periods (e.g., 4h, 16h, 48h) in a comma-separated list.
* For each period, a Probability Up and Probability Down is calculated based on hitting a custom Target Price Change (%) (e.g., 2%) at a certain confidence level given a simulation over the historical backlook.
* The probabilities are displayed in a chart table. The cell text turns white if the calculated probability exceeds the user-defined Signal Confidence (%) .
Conditional Fibonacci Retracement: Optionally displays a Fibonacci Retracement on the chart. This feature is only activated when one of the multi-period signals reaches its minimum confidence threshold, providing a contextual technical level when a probabilistic edge is found.
