DCA Simulation for CryptoCommunity v1.1Overview
This script provides a detailed simulation of a Dollar-Cost Averaging (DCA) strategy tailored for crypto traders. It allows users to visualize how their DCA strategy would perform historically under specific parameters. The script is designed to help traders understand the mechanics of DCA and how it influences average price movement, budget utilization, and trade outcomes.
Key Features:
Combines Interval and Safety Order DCA:
Interval DCA: Regular purchases based on predefined time intervals.
Safety Order DCA: Additional buys triggered by percentage price drops.
Interactive Visualization:
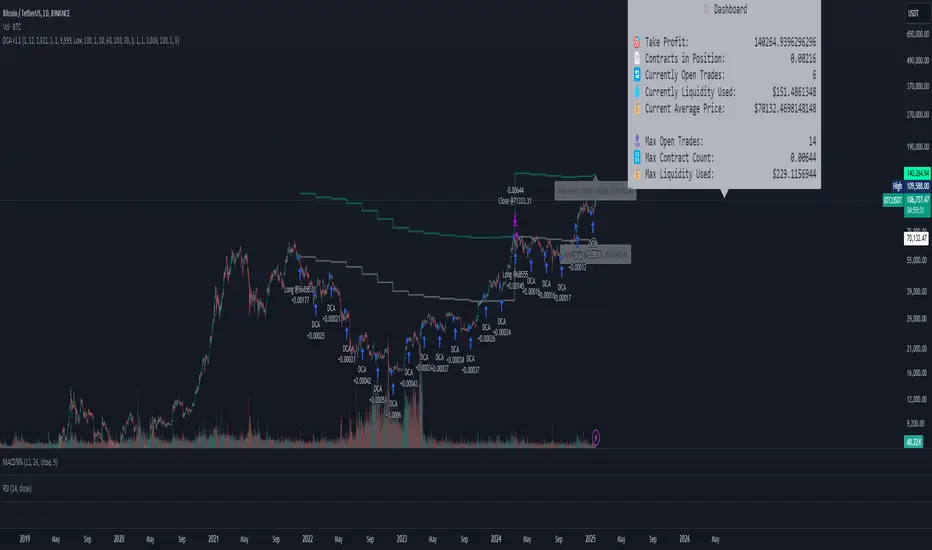
Displays buy levels, average price, and profit-taking points on the chart.
Allows traders to assess how their strategy adapts to price movements.
Comprehensive Dashboard:
Tracks money spent, contracts acquired, and budget utilization.
Shows maximum amounts used if profit-taking is active.
Dynamic Safety Orders:
Resets safety orders when a new higher high is established.
Customizable Parameters:
Adjustable buy frequency, safety order settings, and profit-taking levels.
Suitable for traders with varying budgets and risk tolerances.
Default Strategy Settings:
Account Size: Default account size is set to $10,000 to represent a realistic budget for the average trader.
Commission & Slippage: Includes realistic trading fees and slippage assumptions to ensure accurate backtesting results.
Risk Management: Defaults to risking no more than 5% of the account balance per trade.
Sample Size: Optimized to generate a minimum of 100 trades for meaningful statistical analysis. Users can adjust parameters to fit longer timeframes or different datasets.
Usage Instructions:
Configure Your Strategy: Set the base order, safety order size, and buy frequency based on your preferred DCA approach.
Analyze Historical Performance: Use the chart and dashboard to understand how the strategy performs under different market conditions.
Optimize Parameters: Adjust settings to align with your risk tolerance and trading objectives.
Important Notes:
This script is for educational and simulation purposes. It is not intended to provide financial advice or guarantee profitability.
If the strategy's default settings do not meet your needs, feel free to adjust them while keeping risk management in mind.
TradingView limits the number of open trades to 999, so reduce the buy frequency if necessary to fit longer timeframes.
Statistic
trend_switch
█ Description
Asset price data was time series data, commonly consisting of trends, seasonality, and noise. Many applicable indicators help traders to determine between trend or momentum to make a better trading decision based on their preferences. In some cases, there is little to no clear market direction, and price range. It feels much more appropriate to use a shorter trend identifier, until clearly defined market trend. The indicator/strategy developed with the notion aims to automatically switch between shorter and longer trend following indicator. There were many methods that can be applied and switched between, however in this indicator/strategy will be limited to the use of predictive moving average and MESA adaptive moving average (Ehlers), by first determining if there is a strong trend identified by calculating the slope, if slope value is between upper and lower threshold assumed there is not much price direction.
█ Formula
// predictive moving average
predict = (2*wma1-wma2)
trigger = (4*predict+3*predict +2*predict *predict)
// MESA adaptive moving average
mama = alpha*src+(1-alpha)*mama
fama = .5*alpha*mama+(1-.5-alpha)*fama
█ Feature
The indicator will have a specified default parameter of:
source = ohlc4
lookback period = 10
threshold = 10
fast limit = 0.5
slow limit = 0.05
Strategy type can be switched between Long/Short only and Long-Short strategy
Strategy backtest period
█ How it works
If slope between the upper (red) and lower (green) threshold line, assume there is little to no clear market direction, thus signal predictive moving average indicator
If slope is above the upper (red) or below the lower (green) threshold line, assume there is a clear trend forming, the signal generated from the MESA adaptive moving average indicator
█ Example 1 - Slope fall between the Threshold - activate shorter trend
█ Example 2 - Slope fall above/below Threshold - activate longer trend

Strategy weekly results as numbers v1This script is based on an idea of monthly statistics that have been found across tradingview community scripts. This is an improved version with weekly results with the ability to define the size of every group (number of weeks within one group).
Initial setup of the strategy
1. Set the period to calculate the results between.
2. Set the statistic precision and group size.
3. Enable "Recalculate" → "On every tick" under the strategy "Properties" section.
The logic under the hood
1. Get the period between which to calculate the strategy.
2. Calculate the first day of the first week within the period.
3. Calculate the latest day of the latest week within the period.
4. Calculate the results of the selected period.
5. Group the values by the defined number of cells.
6. Calculate the summary of every group.
7. Render the table.
Please, be careful . To use this tool you will need to enable the "Recalculate" → "On every tick" option but it means that your strategy will be executed on every tick instead of bar close. It can cause unexpected results in your strategy behaviour.
