OBV + WaveTrend Volume Scalper [GratefulFutures]This script is a combination script of three different strategies that provides buy and sell signals based on the change of volume with momentum confirmations.
Sources used:
This script relies on the outstanding scripts of the great script writer LazyBear: LazyBear
The following scripts were used in this publication:
1. A modified "On-Balance Volume Oscillator" modified from LazyBear's original script:
2. Wavetrend Oscillator with crosses, Author: LazyBear
3. Squeeze Momentum Oscillator, Author: LazyBear
This script functions based on the following criteria being true:
1. On balance volume oscillator turning from negative to positive (buy) or positive to negative (sell)
2. Squeeze Momentum value is increasing (buy) or decreasing (sell)
3. Wavetrend 1 (wt1) is greater than wavetrend 2 (wt2) (buy)/ Wavetrend 1 (wt1) is less than wavetrend 2 (wt2) (sell)
By combining these factors the indicator is able to signal exactly when net buying turns to net selling (OBV) and when this change is most advantageous to continue based on the momentum and price action of the underlying asset (SQMOMO and Wavetrend).
This allows you to pair volume and price action for a powerful tool to identify where price will reverse or continue providing exceptional entries for short term trades, especially when combined with other aspects such as support and resistance, or volume profile.
How to use:
Simply adjust the settings to your preference and read the given signals as generated.
Settings
There are multiple ways to tune the signals generated. It is set standard for my preferred use on a 1 minute chart.
OBV Oscillator Settings
The first 4 dropdowns in the Inputs section tune the On Balance Volume Oscillator (OBVO) portion of the indicator. You can choose if you want it to calculate based on close, open, high, low, or other value.
The most impactful in the entire settings is going to be the length and smoothing of the OBVO EMA. Making this number lower increasing the sensitivity to changes in volume, making the signals come quicker but is more susceptible to quick fluctuations. A value of between (5-20) is reasonable for the OBVO EMA length. There is a separate smoothing factor titled OBV Smoothing Length and below that, OBV Smoothing Type , a value of (2) is standard with "SMA" for smoothing type with a value of between 2-10 being reasonable. You may also play with these values to see what you like for your trading style.
Wavetrend Settings
The next 3 options are to modify the wavetrend portion of the indicator. I do not modify these from standard, and feel that they work appropriately on all time frames at the following values: n1 length (10), n2 length (20), Wavetrend Signal SMA length (4)
Squeeze Momentum Settings
The following 5 options through the end modify the Squeeze momentum portion of the indicator. The only one that modifies the signals generated is the KC Length , Making this number lower increasing the sensitivity to changes in price action, making the signals come quicker but is more susceptible to quick fluctuations. A value of between (18-25) is reasonable for KC Length .
Style Setting
You may select if you want to see the buy and sell signals. The following 5 options Raw OBV Osc through Squeeze Momentum allow you to see where each specific requirement was met, posted as a vertical line, but for live use it is recommended to turn all of these vertical lines off and only use the buy and sell signals.
Time Frames:
While this script is most effective on shorter time frames (1 minute for scalping and daytrading) it is also viable to use it on longer timeframes, due to the nature of its components being independent of time frame.
Examples of use - (Green and red vertical lines are for visualization purpose and are not part of the script)
SPY 1 Minute (Factory Settings):
SPX 15 minutes (Factory Settings):
Considerations
This script is meant primarily for short term trading, trades on the basis of seconds to minutes primarily. While they can be a good indication of volume lining up with momentum, it is always wise to use them in combination with other factors such as support, resistance, market structure, volume levels, or the many other techniques out there...
As Always... Happy Trading.
-Not_A_Mad_Scientist (GreatfulFutures Trade University)
Squeezemomentum

KC-BB Squeeze Trend Trader█ OVERVIEW
The KC-BB Squeeze Trend Trader identifies volatility compression and expansion by detecting when Bollinger Bands contract inside Keltner Channels and then release with confirmed momentum. It highlights potential trend-starting breakouts by combining squeeze detection, directional momentum, trend bias, and optional volume filters.
During periods of low volatility, price consolidates and energy builds. When volatility expands again, strong directional moves often follow. This tool helps traders spot those opportunities early with clear visual cues and optional performance tracking.
█ KEY FEATURES
Squeeze detection using Bollinger Bands inside Keltner Channels
Automatic identification of volatility expansion after the squeeze ends
Optional filters for momentum, trend direction, volume, and signal cooldown
Dynamic color fills for squeeze, bullish expansion, bearish expansion, and neutral states
Dashboard showing squeeze duration, tightness, momentum, trend, and volume context
Optional win-rate analytics using ATR-based target and stop evaluation
Multi-timeframe confirmation for higher-quality breakouts
█ HOW IT WORKS
A squeeze occurs when both Bollinger Bands sit inside the Keltner Channels.
A breakout begins when the Bollinger Bands expand outside the KCs.
Long signals appear when squeeze release aligns with bullish momentum and trend strength.
Short signals appear when bearish momentum and trend conditions agree.
Volume and cooldown filters help reduce noise and avoid low-quality entries.
█ HOW TO USE
Wait for a squeeze period (yellow fill).
Monitor duration and tightness: longer/tighter squeezes often lead to stronger moves.
When a long or short signal appears, use the plotted ATR-based target and stop as reference levels.
Watch for contraction or exit hints when momentum fades or volatility narrows again.
Higher timeframes generally provide cleaner and more reliable signals.
█ TIMEFRAME GUIDANCE
Crypto: 4H or 1D; consider increasing KC multiplier for high volatility.
Forex: 1H–4H; longer squeeze duration can improve selectivity.
Stocks: 1D–1W; consider slightly higher BB multiplier on slow-moving markets.
█ SETTINGS SUMMARY
Adjustable Bollinger Band and Keltner Channel lengths and multipliers
Three momentum modes: Linear Regression, Price–SMA, or ROC
Trend and volume filters (optional)
Configurable minimum squeeze duration and signal cooldown
ATR-based target and stop multipliers
Optional historically tight squeeze filter (percentile-based)
█ ALERTS
Squeeze Detected
Squeeze Released
Long Entry
Short Entry
Exit Hint
Historically Tight Squeeze
█ NOTES
ATR-based win-rate calculations provide simplified performance estimates.
Past behavior does not guarantee future movement.
Use position sizing and risk management appropriate for the instrument and timeframe.
█ CREDITS
Inspired by the Bollinger Band and Keltner Channel squeeze concept popularized by John Carter’s TTM Squeeze, with added enhancements for squeeze strength, filtering, and real-time performance metrics.

TTM Squeeze Candles (Trade The Matrix) with Dynamic Strength BarHere is my tribute, tip of the cap to one of the greatest traders of our generation John F. Carter
It was my goal to try and simply visualize the squeeze with candle sticks, dynamic momentum, and signals all on one chart in one indicator. Please study and master the squeeze setup before trying to apply this indicator . You must have a deep understanding of how to trade the squeeze. Read "Mastering The Trade " watch JC's videos etc, and practice with a simulated or paper account before ever trying out new strategies with real money. Not financial advice, I am not a financial advisor! DYOR- with that said - I hope you like it :)
The **"TTM Squeeze Candles (Custom Colors) with Dynamic Strength Bar"** is a **custom TradingView Pine Script (v6)** indicator that visualizes the **TTM Squeeze** strategy — a popular volatility-based momentum system originally developed by John Carter of TradeTheMarkets (TTM). This version enhances the classic TTM Squeeze with **custom candle coloring**, **dynamic momentum strength**, **visual alerts**, and a **real-time strength meter**.
---
## OVERVIEW: What is the TTM Squeeze?
The **TTM Squeeze** identifies periods when **volatility is contracting** (price is consolidating), followed by a **potential explosive breakout** when volatility expands.
It combines:
1. **Bollinger Bands (BB)** – measure statistical volatility
2. **Keltner Channels (KC)** – measure average true range (ATR) volatility
3. **Momentum Oscillator** – determines direction and strength of potential breakout
> **Squeeze ON** = BB inside KC → Low volatility (consolidation)
> **Squeeze OFF** = BB outside KC → Volatility expanding (breakout possible)
---
## DETAILED BREAKDOWN OF THIS INDICATOR
---
### 1. **User Inputs (Customizable Settings)**
| Input | Default | Purpose |
|------|--------|--------|
| `length` | 20 | Period for SMA, BB, KC |
| `bbMult` | 2.0 | Bollinger Band multiplier |
| `kcMult` | 1.5 | Keltner Channel ATR multiplier |
| `momentumLen` | 12 | Length for momentum regression |
| `showHistogram` | true | Show momentum histogram |
| `showStrengthMeter` | true | Show dynamic strength bar |
| `useSqueezeCandle` | true | Replace chart candles with colored squeeze candles |
---
### 2. **Core Calculations**
#### A. **Bollinger Bands**
```pinescript
basis = ta.sma(close, length)
dev = ta.stdev(close, length)
bbUpper = basis + bbMult * dev
bbLower = basis - bbMult * dev
```
- Standard BB using SMA and standard deviation.
#### B. **Keltner Channels (ATR-based)**
```pinescript
kcBasis = ta.sma(close, length)
atrv = ta.atr(length)
kcUpper = kcBasis + kcMult * atrv
kcLower = kcBasis - kcMult * atrv
```
- Uses ATR instead of stdev → more adaptive to recent volatility.
#### C. **Squeeze Condition**
```pinescript
squeezeOn = (bbUpper < kcUpper) and (bbLower > kcLower)
```
- **Squeeze ON**: BB completely inside KC → **low volatility**
- **Squeeze OFF**: BB breaks outside KC → **volatility expansion**
---
### 3. **Momentum Calculation (TTM Style)**
```pinescript
momRaw = close - basis
mom = ta.linreg(momRaw, momentumLen, 0)
```
- Measures **price deviation from the basis (SMA)** via **linear regression**
- Positive = bullish momentum, Negative = bearish
```pinescript
momRising = ta.change(mom) > 0
```
- Tracks whether momentum is increasing.
---
### 4. **Dynamic Momentum Strength (Key Feature)**
```pinescript
absMom = math.abs(mom)
strength = absMom / ta.highest(absMom, 50)
strengthSmooth = ta.sma(strength, 5)
```
- **Normalizes momentum** over last 50 bars
- **Smooths** with 5-period SMA → avoids jitter
- Result: `strengthSmooth` = **0 to 1** (0% to 100% of recent peak)
> **Strong Momentum** = `>= 50%` of recent peak
> **Weak Momentum** = `< 50%`
---
### 5. **Custom Candle Coloring Logic**
| Condition | Candle Color |
|--------|-------------|
| **Squeeze ON** | Semi-transparent **Gray** (`colSqueeze`) |
| **Squeeze OFF + Bullish + Strong** | **Cyan** (`#00FFFF`) |
| **Squeeze OFF + Bullish + Weak** | **Dark Blue** (`#00008B`) |
| **Squeeze OFF + Bearish + Strong** | **Red** (`#FF0000`) |
| **Squeeze OFF + Bearish + Weak** | **Yellow** (`#FFFF00`) |
> Wicks use same color as body
> Optional: Overrides chart candles (`useSqueezeCandle = true`)
---
### 6. **Visual Plot Elements**
| Element | Description |
|-------|-----------|
| `plotcandle()` | Draws **custom colored candles** (if enabled) |
| **Red Dots (below bar)** | Squeeze **ON** |
| **Green Triangle Up (above bar)** | Squeeze **OFF + Bullish** |
| **Red Triangle Down (above bar)** | Squeeze **OFF + Bearish** |
| **Histogram** | Momentum value, colored by direction & strength |
| **BB Lines** | Faint blue |
| **KC Lines** | Faint orange |
---
### 7. **Dynamic Squeeze Strength Bar (Bottom Center)**
```pinescript
table.new(position.bottom_center, 101, 1)
```
- A **101-cell horizontal bar** (0–100%)
- **Filled up to current `strengthSmooth * 100`**
- **Color-coded** by momentum direction & strength
- **Fades out** from filled → empty for smooth gradient
- Updates **only on last bar**
> Example:
> - 78% strength, bullish, strong → **Cyan bar filled to 78%**, fading to gray
---
### 8. **Info Label (Top-Right of Last Bar)**
```pinescript
Squeeze: ON/OFF
Momentum: +0.45
Strength: 72%
```
- Real-time status box
- Auto-updates on new bars
---
### 9. **Alert Conditions**
| Alert | Trigger |
|------|--------|
| `"Squeeze Started"` | `squeezeOn` becomes true |
| `"Squeeze Released"` | `squeezeOff AND bbUpper crosses above kcUpper` |
> Note: Only triggers on **bullish release** via `crossUp`.
> You can modify to add bearish release.
---
## HOW TO INTERPRET THE INDICATOR
| Signal | Meaning | Action |
|-------|--------|-------|
| **Gray Candles + Red Dots** | Squeeze ON → Consolidation | **Prepare** |
| **Cyan/Blue Candle + Green ▲** | Squeeze OFF → **Bullish Breakout** | **Go Long** |
| **Red/Yellow Candle + Red ▼** | Squeeze OFF → **Bearish Breakout** | **Go Short** |
| **Bright Color (Cyan/Red)** | **Strong Momentum** | Higher conviction |
| **Dim Color (Dark Blue/Yellow)** | **Weak Momentum** | Caution / possible fakeout |
| **Strength Bar >70%** | High momentum relative to recent history | Strong trend likely |
---
## TRADING STRATEGY EXAMPLE
1. **Wait for Squeeze ON** (gray candles, red dots)
2. **Watch momentum histogram** turning positive/negative
3. **Enter on Squeeze OFF** with:
- **Green triangle + cyan/dark blue candle**
- **Strength > 50%**
4. **Exit** on momentum fade or opposite signal
---
## UNIQUE FEATURES OF THIS VERSION
| Feature | Benefit |
|-------|--------|
| **Custom candle override** | Replaces default chart for clarity |
| **Dynamic strength normalization** | Compares current momentum to recent peaks |
| **Smooth strength bar** | Visual momentum intensity meter |
| **Color-coded strength levels** | Instantly see weak vs strong moves |
| **Info label** | At-a-glance stats |
| **Clean visuals** | No clutter, intuitive |
---
## LIMITATIONS & NOTES
- **Lagging by design** (uses SMAs, regression)
- **Repaints slightly** due to `ta.linreg(..., 0)` on current bar
- **Strength bar uses last 50 bars** — may vary by timeframe
- **No built-in stop-loss or TP** — use with price action or other tools
---
## BEST USED ON
- **Timeframes**: 15m, 1H, 4H, Daily
- **Markets**: Stocks, Forex, Crypto, Futures
- **Pairs well with**: Volume, VWAP, Support/Resistance
---
## SUMMARY
> **This is a highly visual, trader-friendly version of the TTM Squeeze** that:
> - **Colors candles** based on squeeze state and momentum strength
> - **Shows real-time momentum intensity** via histogram + strength bar
> - **Alerts on squeeze start/release**
> - **Normalizes momentum** for fair strength comparison
> - **Provides clean, actionable signals** for breakout trading
---
**Ideal for swing traders and day traders** looking to catch **high-momentum breakouts from low-volatility consolidations** with **clear entry signals and conviction levels**.

Squeeze Go Momentum Pro [KingThies] █ OVERVIEW
The Squeeze Momentum Pro indicator identifies volatility compression phases and breakout opportunities by comparing Bollinger Bands to Keltner Channels. When price consolidates (squeeze), the bands contract inside the channels, signaling an imminent breakout. The momentum histogram shows directional bias, helping traders anticipate which way price will move when the squeeze releases.
This indicator displays in a separate panel below the price chart, providing clear visual signals without cluttering price action.
█ KEY FEATURES
Momentum Histogram
The histogram is the primary visual element, displaying momentum strength and direction with four distinct color states:
• Dark Green (#00C853) — Strong bullish momentum that is increasing. This signals strengthening upward pressure and potential continuation.
• Light Green (#26A69A) — Bullish momentum that is decreasing. Price remains in bullish territory but upward force is weakening.
• Dark Red (#D32F2F) — Strong bearish momentum that is increasing. This signals strengthening downward pressure and potential continuation.
• Light Red (#EF5350) — Bearish momentum that is decreasing. Price remains in bearish territory but downward force is weakening.
The color intensity provides immediate feedback on momentum strength and trend health.
Squeeze State Indicator
Colored dots on the zero line communicate the current volatility state:
• Orange Dots — Squeeze is ON. Bollinger Bands have contracted inside Keltner Channels, indicating consolidation and low volatility.
A breakout is building and traders should prepare for directional movement.
• Green Dots — Squeeze is OFF. Bollinger Bands have expanded outside Keltner Channels, indicating active momentum and higher volatility.
Price is moving with conviction in the current direction.
• Gray Dots — Neutral state. The bands are transitioning between squeeze states.
Release Triangles
Triangle shapes mark the exact bar when a squeeze releases, providing precise entry timing:
• Green Triangle Up — Bullish squeeze release. The squeeze has ended with positive momentum, suggesting a long setup opportunity.
• Red Triangle Down — Bearish squeeze release. The squeeze has ended with negative momentum, suggesting a short setup opportunity.
Information Panel
A compact dashboard in the top-right corner displays real-time trading intelligence:
• Squeeze Status — Current state: ON, OFF, or NEUTRAL with color coding
• Momentum Direction — Current bias: BULL or BEAR
• Momentum Value — Precise numerical reading of momentum strength
• Trading Signal — Actionable status: LONG SETUP, SHORT SETUP, WAIT, or MONITOR
Configurable Parameters
All calculation inputs are adjustable to match your trading style and timeframe:
• BB Length — Bollinger Bands period (default: 20)
• BB StdDev — Bollinger Bands standard deviation multiplier (default: 2.0)
• KC Length — Keltner Channels period (default: 20)
• KC ATR Multiplier — Keltner Channels range multiplier (default: 1.5)
• Momentum Length — Linear regression period for momentum calculation (default: 20)
Alert System
Four alert conditions notify you of critical trading opportunities:
• Bullish Squeeze Release — Squeeze has released with bullish momentum, indicating a potential long entry
• Bearish Squeeze Release — Squeeze has released with bearish momentum, indicating a potential short entry
• Squeeze Started — Volatility compression detected, prepare for upcoming breakout
• Squeeze Ended — Volatility expansion confirmed, breakout is active
█ TRADING METHODOLOGY
The indicator follows a clear four-step process for identifying and trading squeeze breakouts:
1 - Wait for Orange Dots . When orange dots appear on the zero line, a squeeze is building. This indicates price consolidation and declining volatility.
Do not enter trades during this phase. Instead, prepare by identifying key support and resistance levels and potential breakout directions.
2 - Watch for Release Triangle . When a triangle appears, the squeeze has released and a breakout is beginning. This is your entry signal.
The triangle color (green up or red down) combined with the histogram direction indicates the breakout direction.
3 - Confirm with Histogram Direction . Check the momentum histogram for directional confirmation:
• Green histogram + green triangle up = Go long. Bullish momentum supports upward breakout.
• Red histogram + red triangle down = Go short. Bearish momentum supports downward breakout.
4 - Monitor Momentum Intensity . Stay in the trade while histogram bars maintain their dark, intense color.
When colors lighten (dark green to light green, or dark red to light red), momentum is weakening and you should consider taking profits or tightening stops.
█ INTERPRETATION GUIDE
Squeeze Detection Logic
A squeeze occurs when Bollinger Bands contract inside Keltner Channels. This happens when:
• Standard deviation of price decreases (BB narrows)
• Price consolidates within a tight range
• Volatility compresses to unsustainable levels
The orange dots signal this condition, warning traders that explosive movement is imminent.
Squeeze Release Logic
A squeeze releases when Bollinger Bands expand outside Keltner Channels. This happens when:
• Price volatility increases sharply
• Price breaks out of consolidation
• Volume typically expands (check volume separately)
The green dots and release triangles signal this condition, indicating the direction and timing of the breakout.
Momentum Reading
The histogram uses linear regression to calculate momentum relative to the midpoint of the recent range:
• Above Zero : Price is trading above the range midpoint with bullish pressure
• Below Zero : Price is trading below the range midpoint with bearish pressure
• Increasing Bars : Momentum is strengthening in the current direction (darker color)
• Decreasing Bars : Momentum is weakening in the current direction (lighter color)
█ BEST PRACTICES
• Timeframe Selection — The indicator works on all timeframes but performs best on 15-minute to daily charts.
Lower timeframes may produce more false signals due to noise.
• Confluence Trading — Combine squeeze releases with support/resistance levels, trend lines, or other indicators for higher probability setups.
• Volume Confirmation — Check that squeeze releases occur with increasing volume. Low volume breakouts are more likely to fail.
• Multiple Timeframe Analysis — Check higher timeframes for overall trend direction. Trade squeeze releases that align with the larger trend.
• Parameter Adjustment — Increase BB and KC lengths for smoother signals on higher timeframes. Decrease for more sensitive signals on lower timeframes.
█ LIMITATIONS
• The indicator does not predict breakout direction before the squeeze releases. The momentum histogram provides bias but is not definitive until the breakout occurs.
• False breakouts can occur, particularly in choppy or low-volume market conditions. Always use proper risk management and stop losses.
• The indicator works best in trending markets. In deeply ranging markets with no clear direction, squeeze signals may be less reliable.
• Momentum calculations use linear regression which can lag during extremely fast price movements. Confirm signals with price action.
█ NOTES
This implementation uses linear regression for momentum calculation rather than simple moving averages, providing more responsive and accurate directional signals. The four-color histogram system gives traders nuanced feedback on momentum strength that binary color schemes cannot provide.
The indicator automatically adjusts to any symbol and timeframe without modification, making it suitable for stocks, forex, crypto, and futures markets.
█ CREDITS
Squeeze methodology inspired by John Carter's TTM Squeeze indicator. Momentum calculation and visual design optimized for modern trading workflows.

Custom Bollinger Band Squeeze Screener [Pineify]Custom Bollinger Band Squeeze Screener
Key Features
Multi-symbol scanning: Analyze up to 6 tickers simultaneously.
Multi-timeframe flexibility: Screen across four selectable timeframes for each symbol.
Bollinger Band Squeeze algorithm: Detect volatility contraction and imminent breakouts.
Advanced ATR integration: Measure expansion and squeeze states with custom multipliers.
Customizable indicator parameters: Fine-tune Bollinger and ATR settings for tailored detection.
Visual table interface: Rapidly compare squeeze and expansion signals across all instruments.
How It Works
At the core, this screener leverages a unique blend of Bollinger Bands and Average True Range (ATR) to quantify volatility states for multiple assets and timeframes at once. For each symbol and every selected timeframe, the indicator calculates Bollinger Band width and compares it against ATR levels, offering real-time squeeze (consolidation) and expansion (breakout) signals.
Bollinger Band width is computed using standard deviations around a SMA basis.
ATR is calculated to gauge market volatility independent of price direction.
Squeeze: Triggered when BB width contracts below a multiple of ATR, forecasting lower volatility and set-up for a move.
Expansion: Triggered when BB width expands above a higher ATR multiple, signaling a high-volatility breakout.
Display: Results shown in an intuitive table, marking each status per ticker and TF.
Trading Ideas and Insights
Spot assets poised for volatility-driven breakouts.
Compare squeeze presence across timeframes for optimal entry timing.
Integrate screener results with price action or volume for high-confidence setups.
Use squeeze signals to avoid choppy or non-trending conditions.
Expand and diversify watchlists with multi-symbol coverage.
How Multiple Indicators Work Together
This script seamlessly merges Bollinger Bands and ATR with customized multipliers:
Bollinger Bands identify price consolidation and volatility squeeze zones.
ATR tailors the definition of squeeze and expansion, making signals adaptive to volatility regime changes.
By layering these with multi-symbol/multi-timeframe data, traders access a high-precision view of market readiness for trend acceleration or reversal.
The real synergy is in the screener's ability to visualize volatility states for a diverse asset selection, transforming traditional single-chart analysis into a broad market view.
Unique Aspects
Original implementation: Not a simple trend or scalping indicator; utilizes advanced volatility logic.
Fully multi-symbol and multi-timeframe support uncommon in most screeners.
Custom ATR multipliers for both squeeze and expansion allow traders to match their risk profile and market dynamics.
Visual clarity: Table structure promotes actionable insights and reduces decision fatigue.
How to Use
Add the indicator to your TradingView chart (supports any asset class including crypto, forex, stocks).
Select up to six symbols (tickers) and set your preferred timeframes.
Adjust Bollinger Band Length/Deviation and ATR multipliers to refine squeeze/expansion criteria.
Review the screener table: Look for "SQZ" (squeeze) or "EXP" (expansion) cells for entry/exit ideas.
Combine screener information with other technical or fundamental signals for trade confirmation.
Customization
Symbols: Choose any tickers for scanning.
Timeframes: Select short- to long-term intervals to match your trading style.
Bollinger Band parameters: Modify length and deviation for sensitivity.
ATR multipliers: Set low or high values to adjust squeeze/expansion triggers.
Table size and layout: Adapt display for optimal workflow.
Conclusion
The Bollinger Band Squeeze Screener Pineify delivers an innovative, SEO-friendly multi-asset solution for volatility and trend detection. Harness its original algorithmic design to uncover powerful breakout opportunities and optimize your portfolio. Whether you trade crypto with dynamic volatility or scan stocks for momentum, this tool supercharges your TradingView workflow.

Momentum Variance OscillatorWhat MVO measures:
-PV (Price-Volume) Oscillator – how far price is from a volatility-scaled basis, then weighted by relative volume.
- > 0 = bullish pressure; < 0 = bearish pressure.
-|PV| larger ⇒ stronger momentum.
-Signal line (EMA of PV) – a smoother track of PV; crossings flag momentum shifts.
-Zero line gradient – instantly shows direction (greenish bull / reddish bear) and strength (paler → stronger).
-Extreme bands (±obLevel) – “hot zone” thresholds; being beyond them = exceptional push.
-Variance histogram – MACD-like view (PV minus slower PV-EMA) to see thrust building vs. fading.
-(Optional) Bar coloring & background tint – paints price bars and/or the panel on key events so you can read the regime at a glance.
-Auto-Tune – searches a grid of (obLevel, weakLvl) pairs and (optionally) auto-applies the best, ranked by CAGR vs. drawdown.
Core signals & how to trade them:
1) Define the regime:
-Bullish regime: PV above 0 and/or PV above Signal; zero line is in bull gradient.
-Bearish regime: PV below 0 and/or PV below Signal; zero line is in bear gradient.
-Action: Prefer trades with the regime (avoid fading strong color/strength unless you have a clear reversal setup).
2) Entries:
Momentum entry:
-Long: PV crosses above Signal while PV > 0.
-Short: PV crosses below Signal while PV < 0.
Breakout/acceleration:
-Long add-on: PV crosses above +obLevel (extreme top) and holds.
-Short add-on: PV crosses below −obLevel (extreme bottom) and holds.
-Histogram confirm: Growing bars in your direction = thrust improving; shrinking/flip = thrust stalling.
3) Exits / risk:
-Soft exit / tighten stops: PV loses the extreme and re-enters inside, or histogram fades/turns against you.
-Hard exit / reverse: Opposite PV↔Signal crossover and PV crosses the zero line.
-Weak zone filter: If |PV| < weakLvl, treat signals as lower quality (smaller size or skip).
4) Practical setup - Suggested defaults (good starting point):
-Signal length: 26
-Volume power: 0.50
-obLevel (extreme): 2.00
-weakLvl: 0.75
-Show histogram & dots: On
-Auto-Tune (recommended)
-Turn Auto-Select Best ON. MVO will scan obLevel 1.50→3.00 (step 0.05) and weakLvl 0.50→1.00 (step 0.05), then use the top-ranked pair (CAGR/(1+MDD)).
-If you want to see the top combos, enable the Optimizer Table (Top-3).
5) Visual options
-Bar Colors: Regime+Strength – bars follow the zero-line gradient (great for quick read).
-Extremes – paint only when beyond ±obLevel.
-Cross Signals – paint only on the bar that crosses an extreme.
-Background on breach: A one-bar tint when PV crosses an extreme.
6) Example playbook:
Long setup:
-Zero line shows bull gradient and PV > 0.
-PV crosses above Signal (entry).
-If PV drives above +obLevel, consider add-on; trail under the last minor swing or use ATR.
-Exit/trim on PV crossing below Signal or histogram turning negative; flatten on a drop through 0.
Short setup mirrors the above on the bear side.
7) Tips to avoid common traps:
-Don’t fade strong extremes without clear confirmation (e.g., PV re-entering inside + histogram flip).
-Respect the weak zone: if |PV| < weakLvl, signals are fragile—size down or wait.
-Align with structure: higher-timeframe trend and SR improve expectancy.
-Instrument personality matters: use Auto-Tune or re-calibrate obLevel/weakLvl across assets/timeframes.
8) Alerts you can set:
-Bull Signal X – PV crossed above Signal
-Bear Signal X – PV crossed below Signal
-Bull Baseline X – PV crossed above 0
-Bear Baseline X – PV crossed below 0

Gabriel's Squeeze Momentum📊 Gabriel’s Squeeze Momentum — Deluxe Volatility + Momentum Suite
An advanced, all-in-one squeeze & momentum framework that times volatility compression/expansion and trend shifts, with optional CVD (cumulative volume delta) momentum, ATR zone context, Discontinued Signal Lines (DSL) scalps, Colored DMI trend label, Williams VIX Fix (WVF) low-volatility exhaustion pings, Buff’s VTTI/VPCI volume confirmation, and real-time divergence detection.
What it does:
Discover Squeezes. They occur when volatility contracts, often preceding significant price moves.
Measures momentum with a fast, ATR-normalized linear regression—optionally on Price or CVD—so you see direction and “how hard it’s pushing.”
🧭 Signal Legend ~ Colors the squeeze so you instantly know regime:
🟡 / 🟣 (Tight/Very Tight): Coiled spring; prepare a plan.
🔴 / ⚫ = (Regular/Wide): Watch for Divergences between Price and Momentum.
🟢 (Fired): Expansion started; trade with momentum cross and bias.
Adds context bands at ±1/±2/±3 ATR (“trend / expansion / OB-OS”) to filter late or weak signals.
DSL (Discontinued Signal Lines) give early scalp flips on momentum vs. adaptive bands.
DMI label & triangles communicate trend strength and whether +DI / −DI is in control.
Williams VIX Fix flags capitulation/exhaustion style spikes (with optional VIX proxy).
VTTI/VPCI modules confirm when volume aligns with price trend or contradicts it.
Divergences (regular & hidden) auto-draw with optional live (may repaint) or on-close.
🎢 Squeeze Momentum — How the Logic Works 🎢
The Squeeze Momentum model is built on the principle of volatility compression and expansion. In markets, periods of low volatility are often followed by explosive moves, while high volatility eventually contracts. The “squeeze” seeks to identify these compression phases and prepare traders for the likely expansion that follows.
This indicator achieves that by comparing Bollinger Bands (BB) to Keltner Channels (KC).
Bands: Bollinger vs. Keltner
Bollinger Bands (BB): Calculated using a Simple Moving Average (SMA) of price and standard deviations (σ) of the closing price. The bands expand and contract depending on volatility.
Keltner Channels (KC): Built from an SMA plus/minus multiples of the Average True Range (ATR). Unlike some simplified squeeze indicators that approximate ATR, this implementation uses a true ATR-based KC, ensuring accuracy across different assets and timeframes.
By comparing whether the Bollinger Bands are inside or outside the Keltner Channels, the indicator identifies different squeeze regimes, each representing a distinct volatility environment.
📦 Regime Colors
The squeeze states are color-coded for quick interpretation:
🔹Wide Squeeze (⚫): BB inside KC with a high ATR multiplier. Extremely low volatility, often before major expansion.
🔹Normal Squeeze (🔴): BB inside KC with a moderate ATR multiplier (about 25% more sensitive than Wide). Typical compression setting.
🔹Narrow Squeeze (🟡): BB inside KC with a lower ATR multiplier (about 50% more sensitive than Wide). Signals tighter compression.
🔹Very Narrow Squeeze (🟣): BB inside KC with the lowest ATR multiplier (100% more sensitive than Wide). Indicates extreme coiling.
🔹Fired Squeeze (🟢): BB break outside KC. Marks the release of volatility and potential trend acceleration.
This multi-layered system improves upon classical SQZPRO by using precisely calculated Keltner Channels and multiple sensitivity levels, giving traders more granular information about volatility states.
🔒 Multi-Timeframe Support
The indicator automatically adjusts squeeze thresholds for different timeframes — hourly, 4-hour, daily, weekly, and monthly charts. Each regime has been manually tuned for its timeframe, allowing traders to use the same tool whether scalping, swing trading, or holding longer-term positions.
🎯 Momentum Core
Detecting a squeeze is only half the equation — the indicator also includes a momentum engine to determine direction and strength.
Price momentum is measured as the distance of Close from its Highest High and Lowest Low range, smoothed with a Simple Moving Average, and refined with Linear Regression.
This value is then divided by ATR, normalizing momentum relative to volatility.
Optionally, CVD Mode (Cumulative Volume Delta ÷ Volume) can replace price momentum for assets where order-flow and volume dynamics dominate (e.g., crypto).
🦆 Signal Line
Momentum is paired with a Simple Moving Average signal line:
🔹Bullish: Momentum > Signal.
🔹Bearish: Momentum < Signal.
This crossover logic provides directional bias and filters for false squeezes.
🚀 When to Use Price vs. CVD
CVD Mode (Crypto, FX with tick volume): Best for assets with strong volume/order-flow signals.
Price Mode (Equities, Commodities, Higher TFs): Best for assets with irregular or thin volume data.
🛢️ATR Zones (context filter) 🛢️
Its design is straightforward yet effective: it measures the difference between the current price from its highest highs, lowest lows, and a moving average over a chosen period, then expresses that difference in terms of the Average True Range (ATR) over the same period. By normalizing price deviations against volatility, ATR provides a clear sense of how far and how fast price is moving relative to its “normal” range.
Interpreting the Zone
Positive Values: When it is above zero, price is trading above its HH, LL, and moving average, suggesting bullish momentum. The higher the value, the stronger the momentum relative to volatility.
Negative Values: When the Momentum is below zero, price is trading below its HH, LL, and moving average, signaling bearish momentum. The deeper the reading, the stronger the downside pressure.
Magnitude Matters: Because the Momentum is expressed in ATR units, traders can immediately gauge whether the move is small (less than 1 ATR), moderate (1–2 ATRs), or extreme (3+ ATRs). This makes it especially useful for assessing overbought or oversold conditions in a normalized way.
Strengths:
🔹Volatility-Normalized: Unlike simple squeeze momentum oscillators that have different OB/OS levels, this Momentum adjusts for volatility. This makes signals more consistent across assets with different volatility profiles.
🔹Simplicity:
±1 ATR: trending zone (bulls above +1, bears below −1)
±2 ATR: expansion (keep, add, or trail). Stretch/risk of mean reversion.
±3 ATR: potential exhaustion/mean-revert zone.
🔹Momentum Clarity: By framing momentum in ATR terms, it is easier to distinguish between a small deviation from trend and a genuinely significant move. Sometimes it is a good sign that it trend to ±3/2 ATR, looks for similar directional moves.
Color: The script shades +2/+3 (OB) and −2/−3 (OS) areas and provides swing alerts at ±1 ATR.
💚 What Are Discontinued Signal Lines (DSL)? 💚
In technical analysis, one of the most common tools for smoothing out noisy data is the signal line. This concept appears in many indicators, such as the MACD or stochastic oscillator, where the raw value of an indicator is compared to a smoothed version of itself. The signal line acts as a lagging filter, making it easier to identify shifts in momentum, crossovers, and directional changes.
While useful, the classic signal line approach has limitations. By design, a single smoothed line introduces lag, which means traders may receive signals later than ideal. Additionally, a one-size-fits-all smoothing process often struggles to adapt to different levels of volatility or rapidly changing market conditions.
This is where Discontinued Signal Lines (DSL) come in. DSL is an advanced extension of the traditional signal line concept. Instead of relying on just one smoothed comparison, DSL employs multiple adaptive lines that adjust dynamically to the current state of the indicator. These adaptive lines effectively “discontinue” the dependence on a single, fixed smoothing method, producing a more flexible and nuanced representation of market conditions.
How DSL Works?
Traditional Signal Line: Compares an the Momentum against its own moving average. Provides crossover signals when the raw indicator value moves above or below the smoothed line.
Strength: reduces noise. Weakness: delayed signals and limited adaptability.
DSL Extension: Uses multiple adaptive lines that respond differently to the indicator’s current behavior. Instead of one static moving average, the DSL approach creates faster and slower “reaction lines.” These lines adapt dynamically, capturing acceleration or deceleration in the indicator’s state.
Result: Traders see how momentum is evolving across multiple adaptive thresholds. This reduces false signals and improves responsiveness in volatile conditions.
Benefits of Discontinued Signal Lines
🔹Nuanced Trend Detection
DSL doesn’t just flag when momentum changes direction—it shows the quality of that shift, highlighting whether it is gaining strength, losing steam, or consolidating.
🔹Adaptability Across Markets
Because DSL adjusts to the Momentum’s own dynamics, it works well across different asset classes and timeframes, from equities and futures to forex and crypto.
🔹Earlier Signal Recognition
Multiple adaptive lines allow traders to spot developing trends earlier than with a single smoothed signal line, without being overwhelmed by raw indicator noise.
🔹Better Confirmation
DSL is particularly useful for confirmation. If both adaptive lines agree then a fill is applied in the direction, confidence in the trend is higher as the color turns bull/bear.
🔹Practical Uses
Momentum Trading: Spot acceleration or deceleration in trend strength.
Trend Confirmation: Verify whether a breakout has momentum behind it.
Noise Filtering: Smooth out erratic moves while retaining adaptability.
⚖️ Colored Directional Movement Index (CDMI) ⚖️
The Directional Movement Index (DMI), created by J. Welles Wilder, is one of the most respected trend-following indicators in technical analysis. It is actually a family of three separate indicators combined into one: the +DI (Positive Directional Indicator), the –DI (Negative Directional Indicator), and the ADX (Average Directional Index). Together, they measure not only whether the market is trending but also the strength of that trend. Traders have used the DMI for decades to identify trend direction, gauge momentum, and filter out periods of market noise.
However, despite its reliability, the traditional DMI can be challenging to interpret. Reading three separate lines at once and extracting meaningful signals requires both experience and careful observation. This complexity often discourages newer traders from fully utilizing its power.
The Colored Directional Movement Index (CDMI) is a modern reinterpretation of Wilder’s classic tool. It condenses the same information into a single visual line while using color, shape, and density to communicate what’s happening beneath the surface. The goal is simple: make the DMI’s insights faster to read, easier to act upon, and more intuitive to integrate into trading decisions.
Key Features of CDMI
🔹Color Scale for Trend Strength
The main triangle changes its base color depending on the strength of the DI reading. Dark Red or Green, colors correspond to stronger trends, while faded Gray or lighter yellow tones signal weaker or fading trends. This makes it visually clear when the market is consolidating versus trending strongly.
🔹Color Density for Momentum
Beyond strength, the CDMI uses color density to represent momentum in the trend’s strength. If the ADX is rising (trend gaining momentum), the triangles grows more darker. If the ADX is falling (trend losing momentum), the triangle becomes paler. This provides an instant sense of whether a trend is accelerating or decelerating.
🔹Directional Triangles for Trend Direction
To replace the separate +DI and –DI lines, the CDMI plots small triangle shapes along the bottom axis. An upward-facing triangle indicates that +DI is dominant, confirming bullish direction. A downward-facing triangle signals –DI dominance, confirming bearish direction. This way, both strength and direction are shown without the clutter of multiple overlapping lines.
🔹Label Display for Detailed Values
For traders who want precise data alongside the visuals, CDMI includes a label that shows:
Current trend strength (ADX value).
Current +DI and –DI values.
Momentum status of the ADX (rising or falling).
Historical values of DMI readings, so traders can track how the indicator has evolved over time.
Tooltips are also available to explain “How to read the colored DMI line”, making this version more beginner-friendly.
Why CDMI Matters
The CDMI retains the proven reliability of Wilder’s DMI while solving its biggest drawback—interpretation difficulty. Instead of juggling three separate plots, traders get a single, information-rich line supplemented with intuitive shapes and labels. This streamlined format makes trend verification, momentum analysis, and signal confirmation much faster.
For trading applications, the CDMI can help:
Confirm Entries by showing whether the market is trending strongly enough to justify a position.
Avoid False Signals by filtering out periods of low ADX (weak trend).
Enhance Timing by tracking momentum shifts in trend strength.
By simplifying the complexity of the original DMI into an elegant, color-coded tool, the CDMI makes one of technical analysis’ most advanced indicators practical for everyday use.
😅 The VIX, the Williams Vix Fix, and Market Bottoms 😎
The VIX, formally known as the CBOE Volatility Index, has long been considered one of the most reliable indicators for spotting major market bottoms. Often referred to as the “fear gauge,” it measures the market’s expectation of volatility in the S&P 500 over the next 30 days. When fear grips investors and volatility spikes, the VIX rises sharply. Historically, these moments of extreme fear often coincide with powerful buying opportunities, as markets have a tendency to rebound once panic selling exhausts itself.
Larry Williams, a well-known trader and author, developed the Williams Vix Fix as a way to replicate the insights of the VIX across any tradable asset. While the VIX itself is tied specifically to S&P 500 options, Williams wanted a tool that could capture similar panic-driven dynamics in stocks, futures, forex, and other markets where the VIX is not directly applicable. His “fix” uses price action and volatility formulas to approximate the same emotional extremes reflected in the official VIX, creating almost identical results in practice. This makes the Williams Vix Fix a powerful addition to the trader’s toolbox, allowing the same principle that works on U.S. equities to be applied universally.
One of the most important characteristics of both the VIX and the Williams Vix Fix is that they are far more reliable at signaling market bottoms than market tops. The reason is psychological as much as it is mathematical. At market bottoms, fear and panic are widespread. Retail investors often capitulate, selling in a frenzy as prices drop. This panic drives volatility higher, producing the spikes we see in the VIX. At the same time, professional traders and institutions—those with larger capital and more disciplined strategies—tend to step in when volatility is stretched. They buy when others are fearful, using the panic of retail investors as an opportunity to acquire assets at discounted prices. This confluence of retail panic and institutional buying power is what makes the VIX such a strong bottom-finding tool.
In contrast, at market tops, the dynamic is very different. Tops tend not to be marked by panic or fear. Instead, they form quietly as enthusiasm fades, liquidity dries up, and buying interest wanes. Investors are often complacent, assuming prices will continue to rise, while professional money begins distributing their positions. Because there is no surge in fear, volatility remains muted, and the VIX does not offer a clear warning. This is why traders who rely on the VIX or the Williams Vix Fix must understand its limitations: it is exceptional for detecting bottoms but less useful for anticipating tops.
For traders, the lesson is straightforward. When you see the VIX or Williams Vix Fix spiking to extreme levels, it often indicates a high-probability environment for a rebound. These tools should not be used in isolation, but when combined with support levels, sentiment indicators, and market breadth, they can provide some of the most reliable bottom-fishing signals available. While no indicator is perfect, few have stood the test of time as consistently as the VIX—and thanks to Williams’ adaptation, its power can now be applied to nearly every market.
Indicator Signals (Great in risk-off charts):
🔹Flags spike events (tops/bottoms) with both original and filtered (AE/FE) criteria.
🔹Great as a risk overlay: tighten stops into AE/FE, or require “no spike” to enter.
🤯 Volume Comfirmation: VTTI & VPCI (Buff Dormeier) 🤯
Volume Trend Technical Indicator (VTTI)
The Volume Trend Technical Indicator (VTTI) is a momentum-style tool that analyzes how volume trends interact with price movement. Unlike basic volume measures that simply report how many shares or contracts were traded, the VTTI evaluates whether volume is expanding or contracting in the same direction as the prevailing price trend. The underlying logic is that healthy trends are supported by rising volume, while weakening trends often occur on shrinking volume.
At its core, VTTI looks at the rate of change in volume compared to price movements. By smoothing and normalizing these relationships, the indicator helps traders determine whether momentum is accelerating, decelerating, or diverging.
Rising VTTI: Suggests that volume is confirming the current price trend, strengthening the case for continuation. Flips BG Green after crossing it's signal.
Falling VTTI: Indicates that the trend may be losing participation, often a sign of possible consolidation or reversal. Flips BG Red after crossing it's signal.
Traders often use VTTI to filter entries and exits. For example, if price breaks out but VTTI does not rise above zero, the breakout may lack conviction. On the other hand, when both price and VTTI are aligned, probability of continuation improves.
Volume Price Confirmation Indicator (VPCI)
The Volume Price Confirmation Indicator (VPCI), developed by Buff Dormeier, takes the relationship between price and volume a step further. While traditional indicators like On-Balance Volume (OBV) or Chaikin Money Flow look at cumulative patterns, VPCI breaks price and volume into trend and volatility components and then recombines them to measure how well they confirm each other.
In essence, VPCI asks: “Does volume confirm what price is signaling?”
The formula integrates:
Price Trend Component – whether the market is trending upward or downward.
Volume Trend Component – whether trading activity supports that price trend.
Volatility Adjustments – to account for irregular swings.
The resulting oscillator fluctuates around a zero line:
Positive VPCI: Indicates that price and volume trends are in agreement (bullish confirmation).
Negative VPCI: Suggests that price and volume are diverging (bearish warning or false move).
Crossovers of Zero: Can serve as potential buy or sell signals, depending on context.
A key strength of VPCI is its sensitivity to divergence. When prices continue rising but VPCI begins falling, it often foreshadows a weakening rally. Conversely, a rising VPCI during a flat or down market can highlight early accumulation.
VTTI (Entry Signal) vs. VPCI (Exit Signal)
While both indicators study price-volume dynamics, their focus differs:
VTTI is simpler, emphasizing the trend of volume relative to price for momentum confirmation.
VPCI is more advanced, decomposing both price and volume into multiple components to produce a nuanced oscillator.
Used together, they provide complementary insights. VTTI helps quickly spot whether volume is supporting a move, while VPCI offers deeper confirmation and highlights subtle divergences.
Note: The Up/Down Volume Alert works better on the 4 HR, for Daily scalps or 30 minute for HR scalps. Intraday it's 2/10 minute.
🦅 Divergence toolkit 🦅
Divergences in Technical Analysis
Divergence occurs when the price action of an asset moves in one direction while a technical indicator, such as RSI, MACD, or Momentum, moves in the opposite direction. This disagreement between price and indicator often signals a shift in underlying market dynamics. Traders use divergences to anticipate either potential reversals or continuations in trends.
There are two main types of divergences: regular divergences, which typically precede reversals, and hidden divergences, which suggest continuation of the current trend.
Regular Divergence (Reversal Signals)
A regular divergence occurs when price and indicator disagree during a trend extension. These divergences signal that momentum is no longer fully supporting the current trend and that a reversal may be imminent.
🔹Regular Bullish Divergence
Price Action: Forms a lower low.
Indicator: Forms a higher low.
Interpretation: Price is making new lows, but the indicator is gaining strength. This suggests that selling pressure is weakening, and a reversal to the upside may occur.
Example: RSI rising while price dips to fresh lows.
🔹Regular Bearish Divergence
Price Action: Forms a higher high.
Indicator: Forms a lower high.
Interpretation: Price is reaching new highs, but the indicator shows weakening momentum. This implies that buying pressure is fading, warning of a potential downside reversal.
Example: MACD histogram falling while price makes higher highs.
Regular divergences are often spotted near the end of trends and are most powerful when aligned with key support/resistance levels or overbought/oversold conditions.
Hidden Divergence (Continuation Signals)
A hidden divergence occurs during retracements within a trend. Unlike regular divergences, hidden divergences suggest that the prevailing trend still has strength and is likely to continue.
🔹Hidden Bullish Divergence
Price Action: Forms a higher low.
Indicator: Forms a lower low.
Interpretation: Price is retracing within an uptrend, but the indicator is overshooting downward. This shows that momentum remains intact, supporting continuation upward.
🔹Hidden Bearish Divergence
Price Action: Forms a lower high.
Indicator: Forms a higher high.
Interpretation: Price is retracing within a downtrend, while the indicator overshoots upward. This indicates that bearish momentum remains strong, supporting continuation downward.
Hidden divergences often appear during pullbacks, helping traders time entries in the direction of the prevailing trend.
Practical Use of Divergences
🔹Trend Reversal Alerts – Regular divergences are early warnings that a trend may be ending.
🔹Trend Continuation Signals – Hidden divergences help confirm that retracements are simply pauses, not full reversals.
🔹Confluence with Other Tools – Divergences are more reliable when combined with support/resistance, candlestick patterns, or volume analysis.
🔹Multi-Timeframe Analysis – Spotting divergences on higher timeframes often produces stronger signals.
🕭🔔🛎️ Alert 🛎️🔔🕭
🔹Squeeze
🟢 Fired Squeeze
⚫ Low (Wide) Squeeze / 🔴 Normal / 🟡 Tight / 🟣 Very Tight
🔹Momentum
🐂 Bullish Trend Reversal (Crossover of Momentum and Signal from sub −2)
🐻 Bearish Trend Reversal (Crossover of Momentum and Signal from above +2)
📈 Bullish Swing (cross above +1 ATR) / 📉 Bearish Swing (cross below −1 ATR)
🔹DSL
💚 Bullish DSL Scalp / 💔 Bearish DSL Scalp
🔹Volume
🎯 Strong Up Volume (VPCI > 0 and VTTI up)
⏳ Strong Down Volume (VPCI < 0 and VTTI down)
🔹Divergences
🦅 Bullish, 🦆 Bearish, 🦅 Bullish Hidden, 🦆 Bearish Hidden
Management: Search Vanguard ETFs in your browser, look up full list of VOO holdings. Download it, or copy paste all the ticker symbols. Place that with a AI, just ask it to place , in between each ticker. NVDA, TSLA, AVGO, etc. Create a new watchlist, in the + add all tickers separated by commas. Place a watchlist alert ⚠️ only available for premium + subscribers.
Practical playbook
1) Classic Squeeze Break
Setup: 🔴(D)/🟡(2D)/🟣(3D) squeeze → wait for 🟢(1HR) Fired.
Confirm: Momentum > Signal and above +1 ATR (or DMI strong & rising).
Manage: add on pullbacks that hold +1 ATR; scale near +2 ATR or WVF AE/FE.
2) DSL Scalp in Trend
Setup: Clear trend (DMI strong) + DSL bull/bear trigger in the direction of trend.
Filter: avoid tight/very tight yellow/purple unless you want micro-scalps.
Exit: opposite DSL or ATR midline loss.
3) Mean-Reversion Fade
Setup: Momentum extended to ±3 ATR, WVF spike, and a regular divergence.
Entry: Counter signal only when mom crosses back through ±3 ATR toward mid. Exit early if squeeze ⚫/🔴, Momentum may extend to ±3/2 ATR in the same direction.
Risk: reduce size; this is a fade, not trend following.
4) Volume-Confirmed Breakout
Setup: Squeeze → 🟢 Fired + VPCI > 0 and VTTI up → trend continuation.
Manage: trail behind +1 ATR (long) or −1 ATR (short). 9 SMA works good.
Inputs at a glance (key ones)
Mode: Price or CVD momentum; Squeeze Sensitivity (σ); Momentum Length; Signal Length; ATR Smoothing.
🧮 Colors:
SQZMOM: per squeeze regime, momentum, ATR fills.
DSL: On/Off, Fast/Slow, Length.
ATR Zones: Bullish/Bearish levels (±1), ±2/±3 zone lines & fills.
DMI: Lengths, key & weak thresholds, label on/off.
WVF/VIX: Lookbacks, bands, AE/FE toggles, VIX proxy symbol.
VTTI/VPCI: Fast/slow/signal (VTTI), Short/Long (VPCI), and volume source (Tick/CVD/NVI/PVI/OBV/PVT/AccDist/VWAP).
Divergences: Regular/Hidden toggles, Sensitivity %, Lifetime, Live vs On-Close, Lines/Labels.
🔎 Suggested defaults (feel free to tweak)
Calibration: Size Momentum, so that when it's above zero the asset is trending up. For the signal, it can be kept the same or lower.
Intraday (60–240m): σ = 2.0, 18~20, 3~5, DSL Fast, DMI key 23, weak 17.
Daily/Weekly: keep σ = 2.0, consider DSL Slow, DMI key 25, weak 20, widen ATR filters; lean on VPCI/VTTI (4-HR).
CVD mode: use where tick/volume quality is high (index futures, liquid equities, crypto majors).
🪟 Tips & caveats
Swing Screener: Favor liquid underlyings (index futures/ETFs, large caps). Large-Cap, 2 M Vol, Mid-Cap, 500K Vol. Squeeze: BB( 20) upper < KC (20) upper, and BB (20) lower > KC (20) lower. Optional: Price above 9 SMA, 21 SMA, and 50 SMA, they are my SMA of choice. 200 SMA too, unless you are willing to fish in a bear market. Vice-versa for shorts. Optional: ADX 4 HR > 17, or 23 depending on what you are looking for.
Scalp Screener: Same as above, change the D 9 SMA to 5, and the BB/KC from D to 1 HR. Scalps may last 2~3 days.
Position Screener: Change all daily setting to W, aside from Volume. Optional: PEG < 1.5, FCF > 0, ROA > 8% or ROE > 6%.
Good with Moving averages (9/21/50) and low-volume zones.
Position size by IV, ATR, and account risk. Consider stop/hedge rules around ±2/±3 ATR.
Let alerts stage your watchlist; act only on combined squeeze + momentum signals.
Divergences in live mode can repaint (Real-Time); for algo or alerts, use on-close.
Tight/Very tight squeezes are great for scalps but choppy; combine with DMI rising + VPCI>0.
±3 ATR is exhaustion context, not an auto-fade—look for WVF/Div/DSL confirmation.
For alerts, pair “Fired Squeeze + Bullish Swing” (or bearish) to avoid false starts.
🎯 How to Trade Entry ~ Recap:
Tight/very tight squeeze → fires → momentum crosses up (or DSL bull).
Exit/Flip: Momentum crosses down into/after expansion or hits +2/+3 ATR with fade signs. Filter: Avoid fresh longs at +3 ATR; avoid fresh shorts at −3 ATR unless fading with confirmation.
📐 Options Integrations
✅ Risk Reversal/Modified Risk Reversal (Bullish: Short Put + Long Call)
Use when: Squeeze fires up from 🟡/🟣 and momentum crosses above signal (or zero/DSL).
Playbook Entry: On or just after the bullish fire and momentum upcross. DMI or Volume supports trend as well.
Structure: Sell a put at/just below the −2 ATR reference (or recent swing support). Buy a call at/above the breakout zone (prior high/mid-range +1 to +2 ATR).
A classic risk reversal is a long call plus a short put. That’s a very bullish structure—you gain if the price rallies (via the call), and you collect a premium by selling a put. But it has a naked downside risk. The modified risk reversal fixes that by adding a long lower put (making the short put into a defined put credit spread).
Management: If momentum stays above signal, ride toward +2 → +3 ATR. Sell the put near the current price → receive big premium. Buy the lower put → spend part of that premium (risk cap). Buy the call above the current price → spend more, but the short put premium mostly pays for it.
Exits/Adjust: Momentum downcross or squeeze flips back on (new compression) → reduce. If price retests −1/−2 ATR and holds, you can roll the short put down/out.
Breakout = Big Success; No Breakout = you keep the initial credit. Reversal = Max loss is capped by the long lower put.
✅ Iron Condor (Neutral: Short OTM Put Spread + Short OTM Call Spread)
Use when: Squeeze is active (🟡/🟣), momentum is flat near zero, and there is no directional edge. 🟢 lasts for around 5~8 bars typically. I measure the historical duration of it, and wait for a range period to occur.
Playbook Entry: During compression, set wings outside ±2 ATR (or recent range extremes). I prefer identifying boxes where the rectangle pattern occurs on the chart.
Management: Time decay works while price remains trapped in the coil. High-winrate ~80%, but 1 loser can wipe most of the gains.
Exits/Adjust: If a squeeze fires and momentum breaks hard one way, close the losing side, consider converting to a vertical or rotating to a directional spread aligned with momentum.
4HR-Bullish, closing one wing:
Tip: Align daily/weekly context with your intraday entries. 9 > 50 on Weekly, similar on Daily. Sell premium into compression; switch to directional spreads on expansion and momentum confirmation.
✅ Naked Call/Puts (Directional: 10~30 Delta Calls)
Stick to naked calls and puts when the squeezes are fired from either 🔴 or ⚫.
Look for Strikes slightly out of the money with an OI and Volume spread less than <10%.
If Strike Date is >45, manage 21 Days before expiration. Scalp: Expiration Strikes of 1/4 of the Squeeze period. Leap: Expiration Strikes of 1.75x of the Squeeze period.
📐 Futures Integrations
Playbook Entry:
Verify if the squeeze on the hourly is red or green, and enter on the 2- or 5-minute during a similar squeeze state.
Trend-Following: Traditional 2 Renko Block above 21 SMA and Momentum is bullish, or vice versa. (2~ES, 5~NQ)
Structure: Go long at/just below the ATR reference (or recent swing support). Exit below the breakout zone (prior high/mid-range +1 to +2 ATR).
Management: If momentum stays above +1 ATR ride toward +2 → +3 ATR, etc. House-money, should be kept.
Exits/Adjust: Momentum downcross or squeeze flips back on (new compression) → exit. On Renko Charts, lower the sensitivity to 0.7~1. If price retests 0/−1/−2 ATR and holds, you can enter when the 9 SMA flips. The 50 SMA is better for Daily and up; I wouldn't trade against it then.
📌 FOMO Trading Playbook
Credits & License
Credits: @JF10R (Multi-Timeframe Squeeze), @BigBeluga (DSL), @OskarGallard (Colored DMI base), @ChrisMoody (WVF ideas), @PineCodersTASC (VTTI/VPCI), @EliCobra (Divergence toolkit).
License: Mozilla Public License 2.0 (MPL-2.0).
Author: © GabrielAmadeusLau

Quantum Range Filter by MRKcoin### Quantum Range Filter by MRKcoin
**Overview**
This indicator is a sophisticated range detection tool designed based on the principles of quantitative multi-factor models. Instead of relying on a single condition, it assesses the market from three different dimensions to provide a more robust and reliable identification of range-bound (sideways) markets.
When the background is highlighted in red, it indicates that the market is likely in a range phase, suggesting that trend-following strategies may be less effective, and mean-reversion (range trading) strategies could be more suitable.
---
**Core Logic: A Multi-Factor Approach**
The filter evaluates the market state using the following three independent factors:
1. **Momentum Volatility (RSI Bollinger Bandwidth):**
* **Question:** Is the momentum of the market contracting?
* **Method:** It measures the width of the Bollinger Bands applied to the RSI. A narrow bandwidth suggests that momentum is consolidating, which is a common characteristic of a range market.
2. **Price Volatility (ATR Ratio):**
* **Question:** Is the actual price movement shrinking?
* **Method:** It calculates the Average True Range (ATR) as a percentage of the closing price. A low ratio indicates that the price volatility itself is low, reinforcing the case for a range environment.
3. **Absence of Trend (ADX):**
* **Question:** Is there a lack of a clear directional trend?
* **Method:** It uses the Average Directional Index (ADX), a standard tool for measuring trend strength. A low ADX value provides active confirmation that the market is not in a trending phase.
---
**How to Use**
1. **Range Detection:** The primary use is to identify ranging markets. The red highlighted background serves as a visual cue.
2. **Strategy Selection:**
* **Inside the Red Zone:** Consider using range-trading strategies (e.g., buying at support, selling at resistance, using oscillators like RSI or Stochastics for overbought/oversold signals). Avoid using trend-following indicators like moving average crossovers, as they are prone to generating false signals in these conditions.
* **Outside the Red Zone:** The market is likely trending. Trend-following strategies are more appropriate.
3. **Parameter Tuning (In Settings):**
* **This is the key to adapting the filter to any market or timeframe.** Different assets (like BTC vs. ETH) and different timeframes have unique volatility characteristics. Don't hesitate to adjust the parameters to fit the specific chart you are analyzing.
* **Range Detection Score:** This is the most important setting. It determines how many of the three factors must agree to classify the market as a range. The default is `2`, which provides a good balance.
* If the filter seems **too sensitive** (highlighting too often), increase the score to `3`.
* If the filter seems **not sensitive enough** (missing obvious ranges), decrease the score to `1`.
* **Factor Thresholds:** For fine-tuning, adjust the thresholds for each factor.
* **`RSI BB Width Threshold`:** If you want to detect even tighter momentum consolidations, *decrease* this value.
* **`ATR Ratio Threshold`:** If you want to be stricter about price volatility, *decrease* this value.
* **`ADX Threshold`:** To be more lenient on what constitutes a "trendless" market, *increase* this value (e.g., to 30). To be stricter, *decrease* it (e.g., to 20).
* **Pro Tip:** Use the Debug Table (uncomment it in the script's code) to see the live values of each factor. This will give you a clear idea of how to set the thresholds for the specific asset you are trading.
**Disclaimer**
This indicator is a tool to assist in market analysis and should not be used as a standalone signal for making financial decisions. Always use it in conjunction with your own trading strategy, risk management, and analysis. Past performance is not indicative of future results.
**Credits**
* **Concept & Vision:** MRKcoin

Squeeze Momentum Indicator With EMAThis is a upgraded verison of the most popular Squeeze Momentum Indicator with highlighted lines on the chart to better show entry and exits.
Also includes arrows for easy visibility.
Can also set up ALERTS easily and you can change the color of the momentum highlighted areas to your preference.
HOW TO USE :
***ENTER/EXIT WHEN***
1.Ema 56 / 112 / 672 lines up
2.WHEN CROSSOVER ABOVE = Highlighted green with arrows means bullish entry or bearish exit.
3.WHEN CROSSOVER DOWN = Highlighted red with arows means bearish entry or bullish exit.
4.Exit when black areas occur
***AVOID TRADING WHEN***
1.Arrows within black areas (Non momentum areas or non-squeeze areas)
2.Arrows not following trend(Down arrow during an upwards EMA trend)
**Caution**
You can decide to hold onto a position if you'd like durin the trend, but look at price action before exiting.

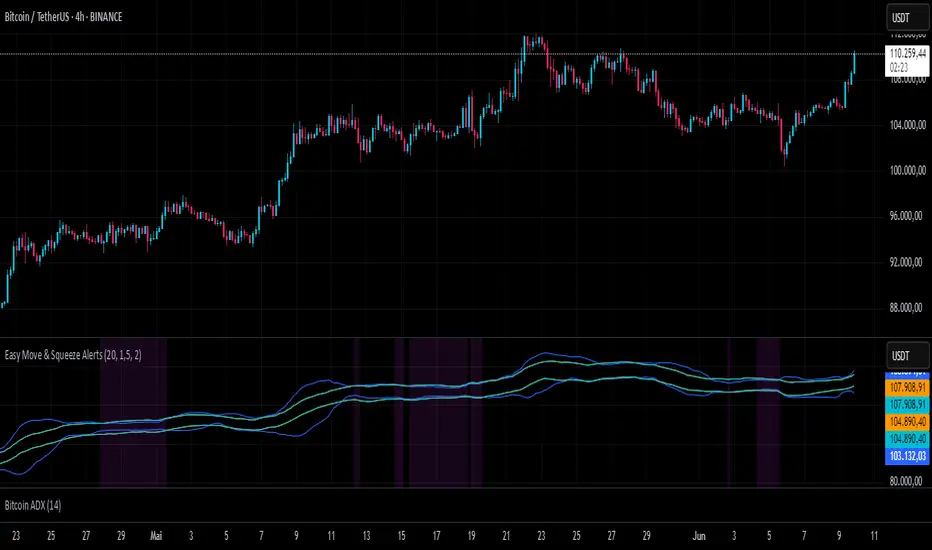
Easy Move & Squeeze Alerts1. Overview
The Easy Move & Squeeze Alerts indicator combines two proven techniques to help you anticipate major price swings and spot volatility compressions (long/short squeezes) early on. It offers:
Automated Alerts via TradingView’s alert engine
On-chart Visual Cues for immediate context
Flexible Inputs to fine-tune sensitivity, lookback length, and display options
2. TTM Squeeze (Volatility Compression)
Core Concept: Compares Bollinger Bands (standard deviation channels) with Keltner Channels (ATR-based channels).
Squeeze On: BBs lie completely inside Keltner Channels → volatility is compressed, signaling a potential buildup.
Squeeze Off: BBs break outside Keltner Channels → typically the start of a strong directional move.
Alert: When the squeeze releases, the indicator fires an alert:
💥 Squeeze Release – Volatility incoming!
Chart Label: A small, purple “🔒 Squeeze” label appears above the high of each bar while compression persists, giving you a real-time visual flag.
3. ATR Breakouts (Detecting Large Moves)
Core Concept: Builds a dynamic price channel around an EMA using ATR (Average True Range) multiplied by your chosen factor.
Cross Events:
Price crosses above the upper ATR band → potential bullish breakout.
Price crosses below the lower ATR band → potential bearish breakdown.
Alert Conditions: Separate alert triggers for “🚀 Move Up” and “📉 Move Down” fire the moment the close breaches the ATR-based bounds.
4. Visualization & Usage
Channel Plots:
Bollinger Bands in blue
Keltner Channels in orange
ATR Channels in aqua (optional)
Toggle all channel plots on or off with the showZones input.
Background Highlight: During a squeeze, the chart background lightly tints purple for quick visual confirmation.
Alerts Setup:
Simply click Create Alert in TradingView, select this indicator, and choose the event(s) you want (squeeze release, ATR breakouts).
You can route notifications via email, webhook, SMS, or platform pop-ups.
5. Deployment & Customization
Timeframes: Effective across all timeframes; most popular for day- and swing-trading.
Parameter Tuning:
Increase the len value to smooth channels and focus on only the most significant compressions/moves.
Adjust the ATR or BB multipliers to make alerts more or less sensitive.
With this indicator, you gain a clear, actionable framework for spotting both volatility squeezes and breakouts before they unfold—empowering you to enter trades ahead of the crowd. Enjoy customizing and putting it to work!
Balancelink : SMI-Optimal Stopping 1.0Core Components
Stochastic Momentum Index (SMI) Calculation:
The indicator computes the SMI on both the current and a dynamically selected lower timeframe. By applying exponential and simple moving averages, it derives smoothed SMI values along with an EMA signal line. Crossovers between these smoothed values serve as primary triggers for long and short entry signals.
Multi-Timeframe Analysis:
A helper function automatically selects an appropriate lower timeframe based on the chart’s current resolution. This allows the indicator to fine-tune its calculations for more precise momentum detection.
Dynamic Volatility Metrics:
It computes session-based statistics such as mean percentage changes and percentile levels. These statistics are then used in further calculations to estimate key metrics (e.g., “Global maximum bar” counts) that contribute to stop-loss and trend estimations.
Advanced Momentum and Stop-Loss Logic
Momentum Pattern Detection:
Using linear regression on price data (through a variable referred to as “vax”), the script detects distinct momentum patterns. It identifies local tops and bottoms, which can be visualized on the chart with optional markers.
Adaptive Stop-Loss Setting:
When a specific momentum pattern is recognized and confirmed by RSI conditions, the script calculates an optimal stop-loss level based on the current bar’s high and session volatility metrics. It then dynamically plots a stop-loss line along with an informative label displaying details such as:
The determined stop-loss level.
Global session statistics (e.g., the number of bars representing maximum momentum shifts).
RSI values and estimated trend, rebound, and reverse bar counts.
Alert Integration:
The script is set up to trigger alerts when key conditions are met (both for RSI below 65 and above 65), ensuring that traders are notified of potential reversal points or momentum shifts.
Customization Options
Visual Controls:
Users can toggle the display of momentum markers and labels, providing flexibility to either see a detailed breakdown on the chart or maintain a cleaner view.
Alert Conditions:
Predefined alert conditions based on the interplay between momentum patterns and RSI levels allow for real-time notifications, making it easier to manage trades without constant monitoring.

TTM Squeeze Momentum MTF [Cometreon]TTM Squeeze Momentum MTF combines the core logic of both the Squeeze Momentum by LazyBear and the TTM Squeeze by John Carter into a single, unified indicator. It offers a complete system to analyze the phase, direction, and strength of market movements.
Unlike the original versions, this indicator allows you to choose how to calculate the trend, select from 15 different types of moving averages, customize every parameter, and adapt the visual style to your trading preferences.
If you are looking for a powerful, flexible and highly configurable tool, this is the perfect choice for you.
🔷 New Features and Improvements
🟩 Unified System: Trend Detection + Visual Style
You can decide which logic to use for the trend via the "Show TTM Squeeze Trend" input:
✅ Enabled → Trend calculated using TTM Squeeze
❌ Disabled → Trend based on Squeeze Momentum
You can also customize the visual style of the indicator:
✅ Enable "Show Histogram" for a visual mode using Histogram, Area, or Column
❌ Disable it to display the classic LazyBear-style line
Everything updates automatically and dynamically based on your selection.
🟩 Full Customization
Every base parameter of the original indicator is now fully configurable: lengths, sources, moving average types, and more.
You can finally adapt the squeeze logic to your strategy — not the other way around.
🟩 Multi-MA Engine
Choose from 15 different Moving Averages for each part of the calculation:
SMA (Simple Moving Average)
EMA (Exponential Moving Average)
WMA (Weighted Moving Average)
RMA (Smoothed Moving Average)
HMA (Hull Moving Average)
JMA (Jurik Moving Average)
DEMA (Double Exponential Moving Average)
TEMA (Triple Exponential Moving Average)
LSMA (Least Squares Moving Average)
VWMA (Volume-Weighted Moving Average)
SMMA (Smoothed Moving Average)
KAMA (Kaufman’s Adaptive Moving Average)
ALMA (Arnaud Legoux Moving Average)
FRAMA (Fractal Adaptive Moving Average)
VIDYA (Variable Index Dynamic Average)
🟩 Dynamic Signal Line
Apply a moving average to the momentum for real-time cross signals, with full control over its length and type.
🟩 Multi-Timeframe & Multi-Ticker Support
You're no longer limited to the chart's current timeframe or ticker. Apply the squeeze to any symbol or timeframe without repainting.
🔷 Technical Details and Customizable Inputs
This indicator offers a fully modular structure with configurable parameters for every component:
1️⃣ Squeeze Momentum Settings – Choose the source, length, and type of moving average used to calculate the base momentum.
2️⃣ Trend Mode Selector – Toggle "Show TTM Squeeze Trend" to select the trend logic displayed on the chart:
✅ Enabled – Shows the trend based on TTM Squeeze (Bollinger Bands inside/outside Keltner Channel)
❌ Disabled – Displays the trend based on Squeeze Momentum logic
🔁 The moving average type for the Keltner Channel is handled automatically, so you don't need to select it manually, even if the custom input is disabled.
3️⃣ Signal Line – Toggle the Signal Line on the Squeeze Momentum. Select its length and MA type to generate visual cross signals.
4️⃣ Bollinger Bands – Configure the length, multiplier, source, and MA type used in the bands.
5️⃣ Keltner Channel – Adjust the length, multiplier, source, and MA type. You can also enable or disable the True Range option.
6️⃣ Advanced MA Parameters – Customize the parameters for advanced MAs (JMA, ALMA, FRAMA, VIDYA), including Phase, Power, Offset, Sigma, and Shift values.
7️⃣ Ticker & Input Source – Select the ticker and manage inputs for alternative chart types like Renko, Kagi, Line Break, and Point & Figure.
8️⃣ Style Settings – Choose how the squeeze is displayed:
Enable "Show Histogram" for Histogram, Area, or Column style
Disable it to show the classic LazyBear-style line
Use Reverse Color to invert line colors
Toggle Show Label to highlight Signal Line cross signals
Customize trend colors to suit your preferences
9️⃣ Multi-Timeframe Options - Timeframe – Use the squeeze on higher timeframes for stronger confirmation
🔟 Wait for Timeframe Closes -
✅ Enabled – Prevents multiple signals within the same candle
❌ Disabled – Displays the indicator smoothly without delay
🔧 Default Settings Reference
To replicate the default settings of the original indicators as they appear when first applied to the chart, use the following configurations:
🟩 TTM Squeeze (John Carter Style)
Squeeze
Length: 20
MA Type: SMA
Show TTM Squeeze Trend: Enabled
Bollinger Bands
Length: 20
Multiplier: 2.0
MA Type: SMA
Keltner Channel
Length: 20
Multiplier: 1.0
Use True Range: ON
MA Type: EMA
Style
Show Histogram: Enabled
Reverse Color: Enabled
🟩 Squeeze Momentum (LazyBear Style)
Squeeze
Length: 10
MA Type: SMA
Show TTM Squeeze Trend: Disabled
Bollinger Bands
Length: 20
Multiplier: 1.5
MA Type: SMA
Keltner Channel
Length: 10
Multiplier: 1.5
Use True Range: ON
MA Type: SMA
Style
Show Histogram: Disabled
Reverse Color: Disabled
⚠️ These values are intended as a starting point. The Cometreon indicator lets you fully customize every input to fit your trading style.
🔷 How to Use Squeeze Momentum Pro
🔍 Identifying Trends
Squeeze Momentum Pro supports two different methods for identifying the trend visually, each based on a distinct logic:
Squeeze Momentum Trend (LazyBear-style):
Displays 3 states based on the position of the Bollinger Bands relative to the Keltner Channel:
🔵 Blue = No Squeeze (BB outside KC and KC outside BB)
⚪️ White = Squeeze Active (BB fully inside KC)
⚫️ Gray = Neutral state (none of the above)
TTM Squeeze Trend (John Carter-style):
Calculates the difference in width between the Bollinger Bands and the Keltner Channel:
🟩 Green = BB width is greater than KC → potential expansion phase
🟥 Red = BB are tighter than KC → possible compression or pre-breakout
📈 Interpreting Signals
Depending on the active configuration, the indicator can provide various signals, including:
Trend color → Reflects the current compression/expansion state (based on selected mode)
Momentum value (above or below 0) → May indicate directional pressure
Signal Line cross → Can highlight momentum shifts
Color change in the momentum → May suggest a potential trend reversal
🛠 Integration with Other Tools
Squeeze Momentum Pro works well alongside other indicators to strengthen market context:
✅ Volume Profile / OBV – Helps confirm accumulation or distribution during squeezes
✅ RSI – Useful to detect divergence between momentum and price
✅ Moving Averages – Ideal for defining primary trend direction and filtering signals
☄️ If you find this indicator useful, leave a Boost to support its development!
Every piece of feedback helps improve the tool and deliver an even better trading experience.
🔥 Share your ideas or feature requests in the comments!

Borrow Fee & Squeeze TrackerSqueeze tracker.
This script helps identify potential short squeeze setups by detecting two key indicators: unusual volume and significant price changes.
The script combines both volume and price changes to give a more reliable indication of potential squeeze opportunities. When both criteria are met, it signals that there may be unusual market activity. The script also allows you to set up automatic alerts when both the volume and price change exceed thresholds, so you can react quickly to potential opportunities without constantly monitoring the charts.
Once added, you can set an alert:
Click on the Alert button
In the "Condition" dropdown, select the Squeeze Alert that was created.
Set the alert options
Now, when the script detects both a volume spike and a price change spike, it will trigger an alert based on your settings.
Enjoy!

Super Oscillator with Alerts by BigBlueCheeseSuper Oscillator with Alerts (by BigBlueCheese)
I got sick of eyeballing multiple oscillators generating output on different scales and interpreting them on the fly, so I picked 4 of my favs, 2 fisher transforms (fast & slow) The Squeeze & my own Market Rhythm Oscillator & made the Super Oscillator with Alerts which combines multiple indicators and oscillators to analyze market conditions and generate actionable trading signals.
The output is buy/sell/neutral signals and a color coded table summarizing indicator states (strong buy to strong sell etc). The color legend can be disabled once you get used to the color codes. The user can choose to watch the table output and its changing output, OR unclutter their screen by toggling the table off & just watching for the signals SO+ (buy), SO-(sell), SO?(neutral)
The combined signals are run through a scoring and weighting scheme that utilizes each indicators Z-scores, Min-Max normalization, and raw values which are all used in different parts of the scoring process.
A velocity filter (for more immediate/sensitive response) is available for the user to toggle on/off. The raw indicator values are classified into categories reflecting their current strength and are assigned momentum points.
Z-scores measure how far each oscillator's current value deviates from its mean in terms of standard deviations. Basically, the Z-scores focus on relative behavior, while momentum captures directional trends. Together, they provide a more nuanced view of market conditions. Large Z-scores increase the likelihood of stronger signals. The idea is to are amplify influence in extreme conditions whereas low Z scores will have minimal impact on the cumulative score, making signals less prone to noise.
Inputs and Their Contributions
1. Momentum: Controlled by the raw oscillator values and thresholds.
2. Min-Max: Automatically calculated based on the historical range of oscillators.
3. Velocity: Input: useVelocity (true/false) toggle. Weights: User-defined weights for velocity contribution.
4. Z-Score: Input: useZScore (true/false) toggle. Weights: User-defined weights for Z-score contribution.
The system combines momentum, Min-Max normalization, (and if enabled) velocity, and Z-scores, to generate dynamic and actionable trading signals that appear as markers on the chart indicating buy, sell, and neutral signals.
Alerts can also be triggered based on these signals.
Users can customize the weighting and inclusion of velocity and Z-scores to align the scoring system with their trading strategy and preferences.
If there is enough interest for some other preferred oscillator, I will substitute it for out my Market Rhythm Oscillator & republish with the code. LMK
For the curious out there, the Market Rhythm Oscillator (MRO) is a custom oscillator that analyzes price dynamics using a combination of weighted volatility-based calculations. It helps measure price momentum and potential exhaustion levels by identifying high and low volatility regions.
• Purpose: The MRO is particularly effective at identifying market trends and potential reversals by analyzing price extremes and their behavior over a defined lookback period.
• Calculation Components might include:
o Waveform Volatility Factor (WVF): Measures the price's deviation from its highest or lowest values within a given period.
o Bands and Smoothing:
Upper and lower bands based on standard deviations of WVF.
Smoothing is applied to the WVF for better trend clarity.
o Exhaustion Levels: Uses the MRO's trend length to calculate when the price action may become overextended.
Happy hunting but as always, not a trade recommendation, past results not indicative of future results, DYOR!

Squeeze Momentum Oscillator [AlgoAlpha]🎉📈 Introducing the Squeeze Momentum Oscillator by AlgoAlpha 📉🎊
Unlock the secrets of market dynamics with our innovative Squeeze Momentum Oscillator! Crafted for those who seek to stay ahead in the fast-paced trading environment, this tool amalgamates critical market momentum and volatility indicators to offer a multifaceted view of potential market movements. Here's why it's an indispensable part of your trading toolkit:
Key Features:
🌈 Customizable Color Schemes: Easily distinguish between bullish (green) and bearish (red) momentum phases for intuitive analysis.
🔧 Extensive Input Settings: Tailor the oscillator lengths for both Underlying and Swing Momentum to match your unique trading approach.
📊 Dedicated Squeeze Settings: Leverage precise volatility insights to identify market squeeze scenarios, signaling potential breakouts or consolidations.
🔍 Advanced Divergence Detection: Utilize sophisticated algorithms to detect and visualize both bullish and bearish divergences, pointing towards possible market reversals.
📈 Hyper Squeeze Detection: Stay alert to high-momentum market movements with our hyper squeeze feature, designed to extremely suppressed market volatility.
🔔 Comprehensive Alert System: Never miss a trading opportunity with alerts for momentum changes, squeeze conditions, and more.
Quick Guide to Using the Squeeze Momentum Oscillator:
🛠 Add the Indicator: Add the indicator to your favourites. Adjust the oscillator and squeeze settings to suit your trading preferences.
📊 Market Analysis: Keep an eye on the squeeze value and momentum z-score for insights into volatility and market direction. Hyper Squeeze signals are your cue for high momentum trading opportunities.
🔔 Alerts: Configure alerts for shifts in underlying and swing momentum, as well as entry and exit points for squeeze conditions, to capture market moves efficiently.
How It Works:
The Squeeze Momentum Oscillator by AlgoAlpha synergistically combines the principles of momentum tracking and market squeeze detection. By integrating the core logic of the Squeeze & Release indicator, it calculates the Squeeze Value (SV) through a comparison of the Exponential Moving Average (EMA) of the Average True Range (ATR) against the high-low price EMA. This SV is further analyzed alongside its EMA to pinpoint squeeze conditions, indicative of potential market breakouts or consolidations. In addition to this, the oscillator employs Hyper Squeeze Detection for identifying extremely low volatility. The momentum aspect of the oscillator evaluates the price movement relative to EMAs of significant highs and lows, refining these observations with a z-score normalization for short-term momentum insights. Moreover, the incorporation of divergence detection aids in identifying potential reversals, making this oscillator a comprehensive tool for traders looking to harness the power of volatility and momentum in their market analysis. The combination of the Squeeze & Release and the Momentum Oscillator allows traders to time their trades with more precision by entering when the market is in a squeeze and front running the volatility of a major move.
Elevate your trading strategy with the Squeeze Momentum Oscillator by AlgoAlpha and gain a competitive edge in deciphering market dynamics! 🌟💼 Happy trading!

Squeeze Momentum DeluxeThe Squeeze Momentum Deluxe is a comprehensive trading toolkit built with features of momentum, volatility, and price action. This script offers a suite for both mean reversion and trend-following analysis. Developed based on the original TTM Squeeze implementation by @LazyBear, this indicator introduces several innovative components to enhance your trading insights.
🔲 Components and Features
Momentum Oscillator - as rooted in the TTM Squeeze, quantifies the relationship between price and its extremes over a defined period. By normalizing the calculation, the values become comparable throughout time and across securities, allowing for a nuanced assessment of Bullish and Bearish momentum. Furthermore, by presenting it as a ribbon with a signal line we gain additional information about the direction of price swings.
Squeeze Bars - The original squeeze concept is based on the relationship between the Bollinger Bands and Keltner Channel , once the BB resides inside the KC a squeeze occurs. By understanding their fundamentals a new form of calculation can be inferred.
method bb(float src, simple int len, simple float mult) => method kc(float src, simple int len, simple float mult) =>
float basis = ta.sma (src, len) float basis = ta.sma (src, len)
float dev = ta.stdev(src, len) float rng = ta.atr ( len)
float upper = basis + dev * mult float upper = basis + rng * mult
float lower = basis - dev * mult float lower = basis - rng * mult
Both BB and KC are constructed upon a moving average with the addition of Standard Deviation and Average True Range respectively. Therefore, the calculation can be transformed to when the Stdev is lower than the ATR a squeeze occurs.
method sqz(float src, simple int len) =>
float dev = ta.stdev(src, len)
float atr = ta.atr ( len)
dev < atr ? true : false
This indicator uses three different thresholds for the ATR to gain three levels of price "Squeeze" for further analysis.
Directional Flux- This component measures the overall direction of price volatility, offering insights into trend sentiment. Presented as waves in the background, it includes an OverFlux feature to signal extreme market bias in a particular direction which can signal either exhaustion or vital continuation. Additionally, the user can choose if to base the calculation on Heikin-Ashi Candles to bias the tool toward trend assessment.
Confluence Gauges - Placed at the top and bottom of the indicator, these gauges measure confluence in the relationship between the Momentum Oscillator and Directional Flux. They provide traders with an easily interpretable visual aid for detecting market sentiment. Reversal doritos displayed alongside them contribute to mean reversion analysis.
Divergences (Real-Time) - Equipped with a custom algorithm, the indicator detects real-time divergences between price and the oscillator. This dynamic feature enhances your ability to spot potential trend reversals as they occur.
🔲 Settings
Directional Flux Length - Adjusts the period of which the background volatility waves operate on.
Trend Bias - Bases the calculation of the Flux to HA candles to bias its behavior toward the trend of price action.
Squeeze Momentum Length - Calibrates the length of the main oscillator ribbon as well as the period for the squeeze algorithm.
Signal - Controls the width of the ribbon. Lower values result in faster responsiveness at the cost of premature positives.
Divergence Sensitivity - Adjusts a threshold to limit the amount of divergences detected based on strength. Higher values result in less detections, stronger structure.
🔲 Alerts
Sell Signal
Buy Signal
Bullish Momentum
Bearish Momentum
Bullish Flux
Bearish Flux
Bullish Swing
Bearish Swing
Strong Bull Gauge
Strong Bear Gauge
Weak Bull Gauge
Weak Bear Gauge
High Squeeze
Normal Squeeze
Low Squeeze
Bullish Divergence
Bearish Divergence
As well as the option to trigger 'any alert' call.
The Squeeze Momentum Deluxe is a comprehensive tool that goes beyond traditional momentum indicators, offering a rich set of features to elevate your trading strategy. I recommend using toolkit alongside other indicators to have a wide variety of confluence to therefore gain higher probabilistic and better informed decisions.

Squeeze Momentum TD - A Revisited Version of the TTM SqueezeDescription:
The "Squeeze Momentum TD" is our unique take on the highly acclaimed TTM Squeeze indicator, renowned in the trading community for its efficiency in pinpointing market momentum. This script is a tribute and an extension to the foundational work laid by several pivotal figures in the trading industry:
• John Carter, for his creation of the TTM Squeeze and TTM Squeeze Pro, which revolutionized the way traders interpret volatility and momentum.
• Lazybear, whose original interpretation of the TTM Squeeze, known as the "Squeeze Momentum Indicator", provided an invaluable foundation for further development.
• Makit0, who evolved Lazybear's script to incorporate enhancements from the TTM Squeeze Pro, resulting in the "Squeeze PRO Arrows".
Our script, "Squeeze Momentum TD", represents a custom version developed after reviewing all variations of the TTM Squeeze indicator. This iteration focuses on a distinct visualization approach, featuring an overlay band on the chart for an user-friendly experience. We've distilled the essence of the TTM Squeeze and its advanced version, the TTM Squeeze Pro, into a form that emphasizes intuitive usability while retaining comprehensive analytical depth.
Features:
-Customizable Bollinger Bands and Keltner Channels: These core components of the TTM Squeeze.
-Dynamic Squeeze Conditions: Ranging from No Squeeze to High Compression.
-Momentum Oscillator: A linear regression-based momentum calculation, offering clear insights into market trends.
-User-Defined Color Schemes: Personalize your experience with adjustable colors for bands and plot shapes.
-Advanced Alert System: Alerts for key market shifts like Bull Watch Out, Bear Watch Out, and Momentum shifts.
-Adaptive Band Widths: Modify the band widths to suit your preference.
How to use it?
• Transition from Light Green to Dark Green: Indicates a potential end to the bullish momentum. This 'Bull Watch Out' signal suggests that traders should be cautious about continuing bullish trends.
• Transition from Light Red to Dark Red: Signals that the bearish momentum might be fading, triggering a 'Bear Watch Out' alert. It's a hint for traders to be wary of ongoing bearish trends.
• Shift from Dark Green to Light Green: This change suggests an increase in bullish momentum. It's an indicator for traders to consider bullish positions.
• Change from Dark Red to Light Red: Implies that bearish momentum is picking up. Traders might want to explore bearish strategies under this condition.
• Rapid Change from Light Red to Light Green: This swift shift indicates a quick transition from bearish to bullish sentiment. It's a strong signal for traders to consider switching to bullish positions.
• Quick Shift from Light Green to Light Red: Demonstrates a speedy change from bullish to bearish momentum. It suggests that traders might want to adjust their strategies to align with the emerging bearish trend.
Acknowledgements:
Special thanks to Beardy_Fred for the significant contributions to the development of this script. This work stands as a testament to the collaborative spirit of the trading community, continuously evolving to meet the demands of diverse trading strategies.
Disclaimer:
This script is provided for educational and informational purposes only. Users should conduct their own due diligence before making any trading decisions.

Adaptive Squeeze Momentum (Zeiierman)█ Overview
Adaptive Squeeze Momentum (Zeiierman) is a hybrid oscillator that models the market’s transition between trend-efficient and inefficient (choppy or reversal-prone) regimes. It fuses a price efficiency framework, volatility-adaptive responsiveness, and a bounded directional trend score, then intelligently blends them through a dynamic transition band to emphasize either smooth, directional structure or spiky inefficiency.
Unlike traditional momentum tools, it does not simply measure speed or volatility. It measures how efficiently the price is moving. This multidimensional approach allows it to identify when markets are compressed and ready to expand, or stretched and ready to revert.
In essence, Adaptive Squeeze Momentum (Zeiierman) gives traders a deep structural perspective of efficiency, momentum, and compression energy, helping to expose hidden squeezes, early reversals, and trend continuations with remarkable accuracy.
⚪ Why This One Is Unique
Adaptive Squeeze Momentum (Zeiierman) stands out because it doesn’t rely on static momentum or volatility measures alone. It merges price efficiency, volatility adaptivity, and trend structure into one cohesive system capable of detecting:
Early squeeze build-ups and directional releases
Reversals emerging from inefficiency spikes
Shifts between clean trends and noisy, unstable ranges
Adaptive behavior across changing volatility conditions
In essence, it acts as a self-adjusting market intelligence tool, revealing when the price is efficient, exhausted, or preparing for significant expansion.
█ Main Features
⚪ Adaptive Squeeze Momentum Oscillator
The Adaptive Squeeze Momentum (Zeiierman) captures how price structure transitions between compression, expansion, and inefficiency. It merges a volatility-adaptive momentum engine with an efficiency-aware structure filter, creating a responsive oscillator that reflects not just how fast the market moves, but how efficiently it moves.
Adaptive Momentum: Reacts dynamically to changing volatility regimes
Efficiency Awareness: Distinguishes stable, directional flow from unstable or noisy price action
Volatility Squeeze Detection: Identifies buildup (compression) and breakout (release) conditions
Directional Context: Shows momentum alignment, exhaustion, or imbalance through color-coded histograms
This hybrid model provides a multidimensional view of trend quality, squeeze pressure, and inefficiency, ideal for precision-based trend following and structural reversal recognition.
⚪ Understanding the Squeeze
A squeeze occurs when volatility contracts, prices compress, and market energy builds, much like a coiled spring preparing to release. Once volatility expands, that stored energy transforms into directional movement, often marking the beginning of a significant breakout or new trend phase.
Traditional squeeze indicators focus only on volatility contraction. Adaptive Squeeze Momentum (Zeiierman) goes further by incorporating efficiency analysis to evaluate how organized or chaotic the buildup is. This reveals not only when a squeeze may fire but also whether the ensuing release is likely to be sustainable or structurally weak.
Visual Interpretation:
Lighter Dots: Represent low-volatility compression, energy building within an efficient or balanced structure.
Yellow Dots: Mark volatility release, the expansion phase where momentum accelerates.
⚪ Inefficiency Columns
Efficient Price Action
Efficient moves are clean, directional, and purposeful. Price advances with minimal back-and-forth noise, revealing strong conviction and structural alignment. In the indicator, these appear as smooth, non-blue histogram columns. Such periods indicate organized, high-probability momentum where breakouts, trends, and continuations are supported by efficient order flow.
Inefficient Price Action
Inefficient moves are noisy, erratic, and spiky, showing that price is fighting its own structure. Liquidity is thin, reactions are emotional, and momentum lacks balance. In the oscillator, inefficiency is displayed through blue columns, path-break spikes, or OB/OS inefficiency crosses (green/red). These elements act as early warnings of structural instability, suggesting the market may be overextended, losing organization, or entering a mean-reversion or reversal phase.
█ How to Use
⚪ Trend Following
When oscillator bars are above or below zero and growing in color intensity, momentum is expanding, confirming active, efficient trends. When colors fade, momentum is decelerating, signaling potential exhaustion or consolidation.
Interpretation:
Sustained smooth growth above zero indicates strong, efficient bullish momentum.
Sustained smooth growth below zero indicates efficient bearish continuation.
Color fading or a zero-line cross suggests trend fatigue or rotation.
Tip: Confirm trend continuation when yellow squeeze-release dots appear in the same direction. They often precede sustained breakouts following compression.
⚪ Inefficiency Reversals or Breakouts
Adaptive Squeeze Momentum (Zeiierman) excels at detecting instability within active trends, highlighting when moves lose internal efficiency and become unsustainable. When bars change color, outbreak columns appear, or Overbought/Oversold Inefficiency Crosses (green/red) appear, the structure is shifting toward potential reversal or exhaustion.
Blue Inefficiency Columns:
Above Zero: Indicates inefficient buying pressure where markets push higher impulsively or emotionally. Often signals an overstretched or unstable rally prone to short-term corrections or FOMO-driven peaks.
Below Zero: Reflects inefficient selling pressure where panic-driven or disorderly sell-offs often precede exhaustion and recovery phases.
Main Oscillator Inefficiency:
Spiky Column Above Zero
When the main oscillator suddenly surges upward and prints a tall, spiky column above the zero line without turning blue, it signals an inefficient and overextended push to the upside. This type of move breaks the oscillator’s usual smooth rhythm, showing that buyers are becoming overaggressive or emotional, often driven by FOMO or reactive momentum chasing.
Even though the column remains green, the abrupt path break reveals that the move is losing internal structure and may be unsustainable. Such inefficient upward bursts often indicate upside exhaustion or an overshoot, where the market temporarily loses control.
From here, two scenarios can unfold:
A sustained breakout if structure confirms (for example, a valid squeeze release or strong volume support).
A snapback or reversal if follow-through fails on the next bars and the oscillator begins to fade (growth → fall).
Spiky Column Below Zero
When the oscillator sharply dives and prints a tall, spiky column below the zero line without turning blue, it reflects an inefficient and emotional push to the downside. This behavior typically emerges during panic-driven selling, where traders aggressively dump positions, breaking the oscillator’s normal rhythm.
Even though the color remains red, this kind of path-break spike shows that the market has become disordered or overstretched. These inefficient downward thrusts often suggest bear exhaustion, capitulation, or a temporary overshoot below fair structure.
From this point, two potential outcomes can occur:
A sustained breakdown if the move is supported by strong volume or new structural lows.
A rebound or mean reversion occurs when momentum fails to extend, indicating that selling pressure has burned out.
Setting Tip: To focus purely on the oscillator’s structural peaks, set Inefficiency Detection and Inefficiency Duration to identical values, then adjust Inefficiency Price Peaks to control sensitivity. Use lower values for crisp detection and higher values for smoother blending.
Overbought and Oversold Inefficiency Signals
Green Overbought Cross: Signals that buyers are driving the market too aggressively, often from emotional extension or FOMO. This imbalance typically leads to short-term pauses, pullbacks, or corrections.
Red Oversold Cross: Signals panic-driven or emotionally imbalanced selling, marking structural exhaustion. Often precedes rebounds or base formations as volatility normalizes.
Interpretation: Both crosses identify where momentum is inefficient rather than simply overbought or oversold, helping detect exhaustion before conventional oscillators do.
⚪ Squeeze Builds and Releases (Volatility Expansion)
The squeeze system highlights volatility cycles when the market compresses, builds energy, and releases it through expansion.
Lighter Dots: Compression, where volatility contracts, structure tightens, and energy builds.
Yellow Dots: Release, where volatility expands, triggering directional movement.
Interpretation: Light dots signal potential breakout setups. When followed by a yellow dot and an aligned oscillator direction, they confirm momentum ignition —the moment the market transitions from equilibrium to expansion.
█ How It Works
⚪ Inefficiency Logic
The indicator evaluates how efficiently the price progresses relative to internal volatility. When market flow loses directional clarity, it transitions into an inefficiency state, represented by blue columns or sudden outbreaks within the oscillator. These moments reveal when the underlying structure becomes unstable or overly reactive, often preceding reversals or false momentum bursts.
Calculation: Applies an adaptive efficiency model that compares directional movement to internal dispersion and classifies it within a controlled stability band. A dual-threshold hysteresis with smooth interpolation ensures stable transitions between efficient (trend) and inefficient (spike) phases.
⚪ Directional Tendency Core
The directional tendency component models the underlying slope of market intent, expressing the balance between structured progression and reactive drift. It transforms directional bias into a bounded, volatility-normalized range that remains consistent across instruments and timeframes.
Calculation: Constructs a normalized directional field derived from trend displacement over an adaptive window, filtered through a nonlinear bounding transform and dynamic smoothing to control lag and oscillation.
⚪ Squeeze Engine
The squeeze system isolates compression and release cycles, the rhythmic build-up and discharge of volatility. Compression phases represent equilibrium and contraction, while release phases signify volatility expansion and directional acceleration.
Calculation: Integrates a volatility-adjusted energy model with directional gating. Compression forms during sustained contraction, while release occurs as volatility and momentum expand.
⚪ OB/OS Inefficiency Extremes
The OB/OS inefficiency system detects imbalanced extremes in order flow, when price pushes too far in one direction without structural support. These regions often precede exhaustion or rapid mean reversion.
Calculation: Generates an efficiency-weighted propagation field that identifies directional overextension. Threshold analysis and adaptive state classification determine overbought (green) and oversold (red) inefficiency zones.
⚪ Final Oscillator Composition
The final oscillator is an adaptive blend of inefficiency, directional tendency, and volatility state. It continuously morphs between spike-dominant and trend-dominant behavior based on the evolving efficiency environment. This produces a responsive structural map that visualizes the interplay between market stability, momentum, and compression energy.
Calculation: Combines the signed inefficiency signal and the bounded trend vector through a soft-weighted blending function governed by the efficiency band.
-----------------
Disclaimer
The content provided in my scripts, indicators, ideas, algorithms, and systems is for educational and informational purposes only. It does not constitute financial advice, investment recommendations, or a solicitation to buy or sell any financial instruments. I will not accept liability for any loss or damage, including without limitation any loss of profit, which may arise directly or indirectly from the use of or reliance on such information.
All investments involve risk, and the past performance of a security, industry, sector, market, financial product, trading strategy, backtest, or individual's trading does not guarantee future results or returns. Investors are fully responsible for any investment decisions they make. Such decisions should be based solely on an evaluation of their financial circumstances, investment objectives, risk tolerance, and liquidity needs.
Ücretli komut dosyası

Divergence RSI V2This indicator is based on the concept of divergence. I recommend that you find out and study about this yourself as the concept of divergence will not be explained in depth in this description.
This indicator will show divergences between the asset price and the RSI oscillator. The indicator will look for divergent points between the rising highs and falling lows of the asset; and the rising lows and falling highs of the RSI.
The trend of the asset tends to follow the behavior of the oscillator when a divergence occurs. So if we find a divergence between the two, the price of the asset is likely to follow the trend of the oscillator.
This indicator looks for these types of divergences and will show (based on the RSI) if there is a bullish or bearish divergence.
If it is bullish, it will show a line joining those points in green and if it is bearish in red. In addition, it will show a label where you can see the number of occurrences that have been found from a certain point to another.
Note: this indicator can be complemented with the “Divergence V2” indicator which is also found in my library.
Settings
Backtesting Bars : is the number of bars back that the indicator will check. No more than 1000 is recommended as this will slow down the search.
Tolerance: number of times a divergent line can cross a bar. If you place 0, no bar can be crossed by a diverging line.
Min Bars To detect: will only search for divergences (or lines) that have the minimum number of bars selected in this option. Default option is 30.
Min Bars To detect: it will only search for divergences (or lines) that have the maximum number of bars selected in this option. Default option is 100.
Source Highs: The high points will be based on the close of each bar. You can use as another alternative.
Source Lows: The low points will be based on the close of each bar. You can use as another alternative.
Use squeeze parameter: only look for divergences (bullish or bearish) at times when such an indicator is in favor of the trend or coincides with the corresponding RSI divergence.
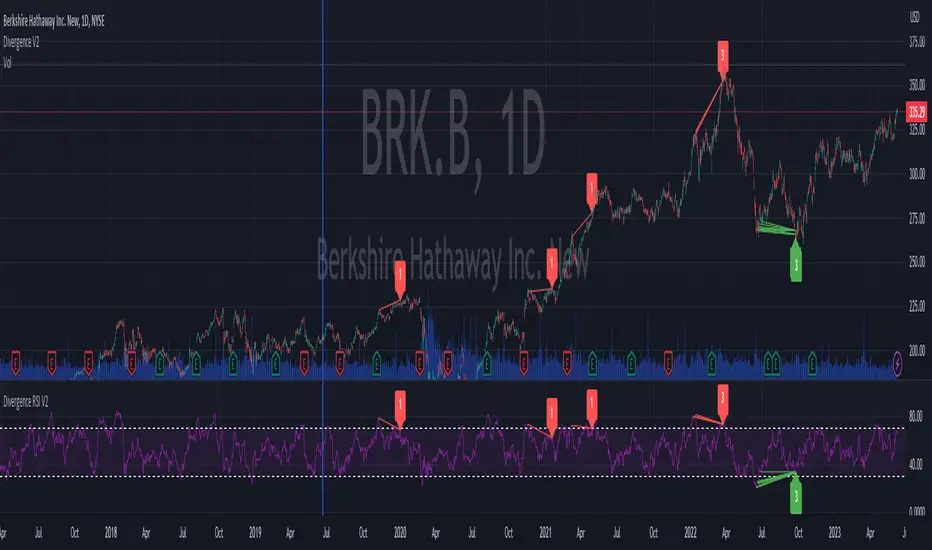
Trend Momentum SynthesizerBy analyzing the MACD (Moving Average Convergence Divergence) and Squeeze Momentum indicators, this indicator helps identify potential bullish, bearish, or undecided market conditions.
The algorithm within considers the positions of the MACD and Squeeze Momentum indicators to determine the overall market sentiment. When the indicators align and indicate a bullish market condition, the indicator's plot color will be either dark green, green, yellow, or lime, indicating a potential bullish trend. Conversely, if the indicators align and indicate a bearish market condition, the plot color will be maroon or red, denoting a potential bearish trend. When the indicators are inconclusive, the plot color will be orange, suggesting an undecided market.
The ADX is an addon component of this indicator, helping to assess the strength of a trend. By analyzing the ADX, the indicator determines whether a trend is strong enough, providing additional confirmation for potential trade signals. The ADX smoothing and DI (Directional Index) length parameters can be customized to suit individual trading preferences.
By combining these indicators, the algorithm provides traders with a comprehensive view of the market, helping them make informed trading decisions. It aims to assist traders in identifying potential market opportunities and aligns with the objective of maximizing trading performance.
How to use the indicator:
Note: I used back-testing for fine tuning do not base your trades on signals from the testing framework.
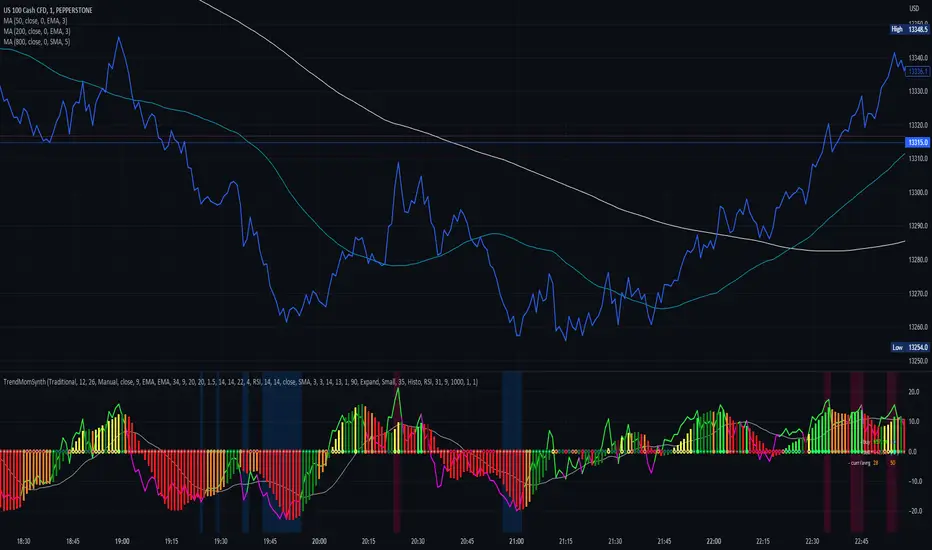
1st Gray Cross Signals ━ Histogram SQZMOM [whvntr][LazyBear]This is the Histogram Version of one of my other indicators named: SQZ Momentum + 1st Gray Cross Signals (with arrows) Which is a modification of "Squeeze Momentum Indicator" by user: "LazyBear". In that indicator of his he described, and suggested, the use of his gray cross signals to find points of interest for trading based on the direction of momentum when the first gray cross appears... I have programmed these points, and highlighted them, for ease of use. The 1st gray cross strategy, he said , is from John F. Carter's book, Chapter 11, "Mastering the Trade".
Here we have the Histogram version, with background highlights only, and nothing on the chart, in true SQZ Momentum style.
Disclaimer: using this indicator, or any indicator anywhere, involves risk when trading and isn't a guarantee of 100% accurate results.

Squeeze Momentum MTF [LPWN]//ENGLISH
Squeeze momentum of lazy bear, multiple time frames, It gives you information if the cycles with high temporality momentums are in harmony, by default two more momentums are shown, I prefer to use only one extra, in the options you can change the time frame of the momentums, in addition to the momentums you can add the RSI and ADX, if the momentum look small, you can change the value of general scale to make them bigger, the table gives us information on how the momentums and the adx are, in the options you can set the candles to color according to the harmony of the momentums
// SPANISH
Squeeze momentum de lazy bear, multiple time frames, te da informacion si los ciclos con momentums de temporalidad alta estan en armonia,por defecto se muestran dos momentums mas, yo prefiero usar solo uno extra, en las opcoines puedes cambiar la temporalidad de los momentums, ademas de los momentums puedes agregar el RSI y el ADX, si el momentum se ve pequeño, puedes cambiar el valor de general scale para hacerlos mas grandes, la tabla nos da infomracion de como estan los momentums y el adx, en las opciones puedes poner que las velas se pongan del color de acuerdo a la armonia de los momentums
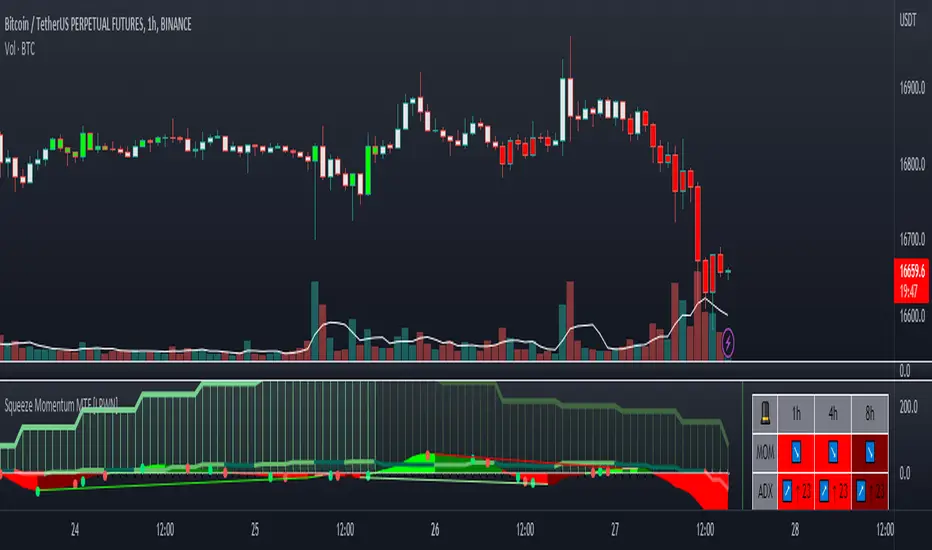
SQueezeVergenceThis is my SQueezeVergence indicator. It fires Buy and Sell signals based on squeeze momentum and trend. **It also creates Bull and Bear signals based on MACD divergence which should only be used as areas of support and resistance being as these signals repaint based on a 5 candle look back of pivots.** All settings are editable for better use. The default settings are what I use on the 1 Minute chart of ES to scalp. This is a simple indicator to help me get alerts on when I need to scalp. The divergence signals work well for areas of significance. I like to watch for breaks of these levels along with support and resistance. I hope this helps.