ADX Change
––––History & Credit
The idea of ADX change came from a trading book I read by Charles Le Beau and David Lucas (Computer Analysis of the Futures Market).
–––––What it does
The script calculates the Average Directional Index (ADX) and the period to period change. The script calculated 4 conditions:
– ADX accelerating to the upside (color cyan):
ADX>20
DMI+>DMI-
This period's absolute ADX number is HIGHER than pervious' period ADX number
- ADX momentum slowing to the upside (color blue):
ADX>20
DMI+>DMI-
This period's absolute ADX number is LOWER than pervious' period ADX number
- ADX momentum accelerating to the downside (color yellow):
ADX>20
DMI->DMI+
This period's absolute ADX number is HIGHER than pervious' period ADX number
- ADX momentum slowing to the downside (color yellow):
ADX>20
DMI->DMI+
This period's absolute ADX number is LOWER than pervious' period ADX number
–––––How to use it
I combine the ADX Change as a secondary indicator, that confirms my positions. I combine it with other momentum indicators like the TTM Squeeze.
If I am in position and the ADX Change is cyan, I would hold on the position until I see some shift in momentum or ADX change. This helps me hold on to my winners.
For the more advanced traders, it could be used to indicate shifts in momentum and buy points.
Squeeze

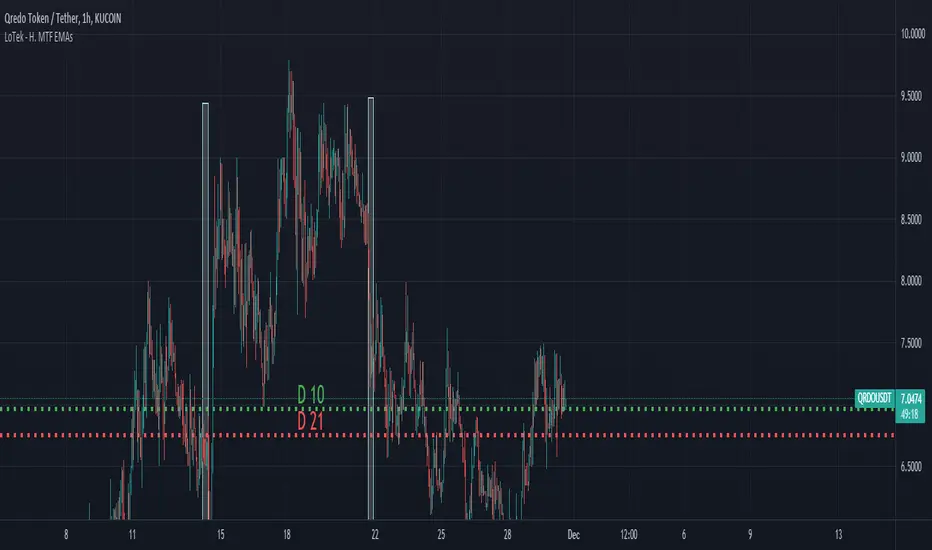
LoTek - Horizontal Multi Time-Frame EMAsThis script retrieves user definable EMA values from different timeframes and plots a Horizontal Line on the chart for the corresponding timeframe. Labels are switchable as well. This can help you identify an EMA squeeze on lower time frames quickly. In this image, I'm viewing QRDO on 1HR and can tell that the price is just above the D10.
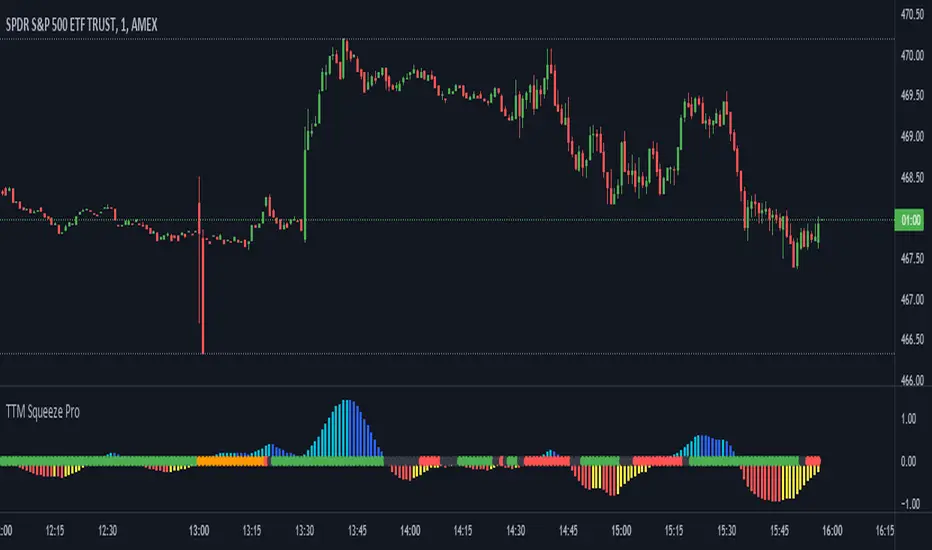
TTM Squeeze ProCredits:
-> John Carter creating the TTM Squeeze and TTM Squeeze Pro
-> Lazybear's original interpretation of the TTM Squeeze: Squeeze Momentum Indicator
-> Makit0's evolution of Lazybear's script to factor in the TTM Squeeze Pro upgrades - Squeeze PRO Arrows
This is my version of their collective works, with amendments primarily to the Squeeze Conditions to more accurately reflect the color coding used by the official TMM Squeeze Pro indicator.
For those unfamiliar with the TTM Squeeze, it is simply a visual way of seeing how Bollinger Bands (standard deviations from a simple moving average ) relate to Keltner Channels (average true range bands) compared with the momentum of the price action. The concept is that as Bollinger Bands compress within Keltner Channels, price volatility decreases, giving way for a potential explosive price movement up or down.
Differences between the original TTM Squeeze and TTM Squeeze Pro:
-> Both use a 2 standard deviation Bollinger Band ;
-> The original squeeze only used a 1.5 ATR Keltner Channel; and
-> The pro version uses 1.0, 1.5 and 2.0 ATR Keltner Channels .
The pro version therefore helps differentiate between levels of squeeze (compression) as the Bollinger Bands moves through the Keltner Channels i.e. the greater the compression, the more potential for explosive moves - less compression means more squeezing.
The Histogram shows price momentum whereas the colored dots (along the zeroline) show where the Bollinger Bands are in relation to the Keltner Channels:
-> Cyan Bars = positive, increasing momentum;
-> Blue Bars = positive, decreasing momentum (indication of a reversal in price direction);
-> Red Bars = negative, increasing momentum;
-> Yellow Bars = negative, decreasing momentum (indication of a reversal in price direction);
-> Orange Dots = High Compression / large squeeze (One or both of the Bollinger Bands is inside the 1st (1.0 ATR) Keltner Channel);
-> Red Dots = Medium Squeeze (One or both of the Bollinger Bands is inside the 2nd (1.5 ATR) Keltner Channel);
-> Black Dots = Low compression / wide squeeze (One or both of the Bollinger Bands is inside the 3rd (2.0 ATR) Keltner Channels );
-> Green Dots = No Squeeze / Squeeze Fired (One or both of the Bollinger Bands is outside of the 3rd (2.0 ATR) Keltner Channel).
Ideal Scenario:
As the ticker enters the squeeze, black dots would warn of the beginning of a low compression squeeze. As the Bollinger bands continue to constrict within the Keltner Channels , red dots would highlight a medium compression. As the price action and momentum continues to compress an orange dot shows warning of high compression. As price action leaves the squeeze, the coloring would reverse e.g. orange to red to black to green. Any compression squeeze is considered fired at the first green dot that appears.
Note: This is an ideal progression of the different types of squeezes, however any type of squeeze (and color sequence) may appear at anytime, therefore the focus is primarily on the green dots after any type of compression.
Entry and Exit Guide:
-> John Carter recommends entering a position after at least 5 black dots or wait for 1st green dot ; and
-> Exit on second blue or yellow bar or, alternatively, remain in the position after confirming a continuing trend through a separate indicator.
Squeeze Momentum + Volatility [LeonidasCrypto]Based on Squeeze Momentum indicator by LazyBear
This custom version of SQ is part of my Trading System.
How to use it.
Please read the description of the original author of this indicator here.
Volatility .
When the market is contracting or sideways usually you will see red or blue dots.
Blue dots. the market is in sideways and the volatility is low.
Red dots. the market is in the climax of volatility usually after of a big move this is a potential signal the peak of the move is near.
I added volatility to SQ because I consider volatility is a key factor for trading to anticipate the moves.

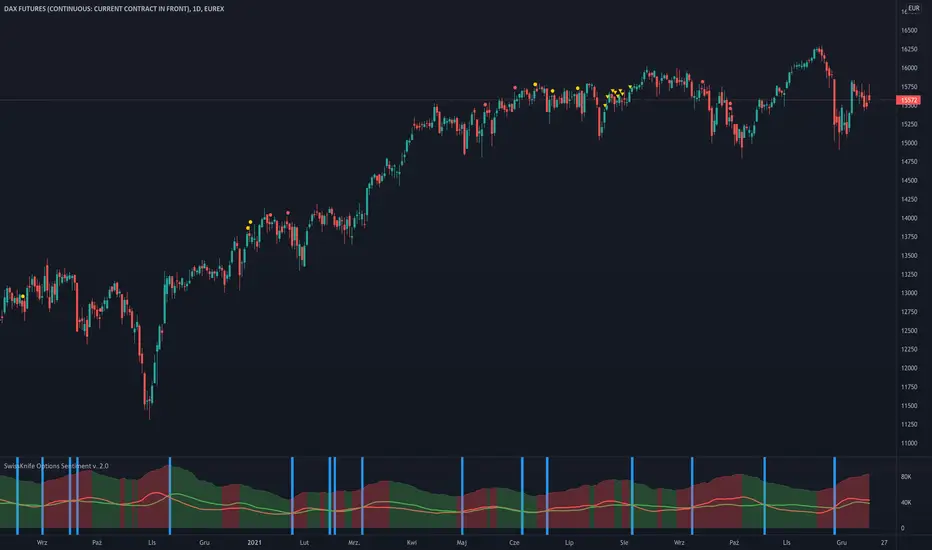
Options Flow Intraday SentimentScript useful for Intraday Trading - which based on Options data loaded in background - is showing sentiment of Investors. Very often Options are forecasting and precedes moves that will happen later on derivatives like Futures Contracts. Due to its' nature, data is useful during Regular Trading Hours sessions ( RTH ).
We take into account Options Volume flow & Put/Call Ratio from Options. Data is based from dataset on Quandl and loaded to TradingView. Therefore data is normalized as per different factors we have different scale of received data. Then I apply calculations comparing PUT and CALL Volume, giving the biggest weight ratio to those Options which have nearest Expiration Date. Another condition taken into account is Type of Option: either In the Money, Out of Money or At the money. Last but not least for Options there is calculated risk, where those orderflow entries with lowest risk are having the biggest weight in calculation while those with highest risk - are having lower ratio. Risk is calculated based on delta factor (coming out of Options standard definitions).
Background of indicator is coloured in direction of sentiment when we have alignment of sentiment factors calculated in background in one direction. Script is displaying additionally PUT Volume, CALL Volume from Options and PUT/CALL Ratio. Those are only additional information that can be useful for traders, but the whole logic is hidden under the hood (as described earlier) and is showing coloured background when sentiment is aligned. Therefore be prepared to take potentially a trade in direction of the background - but not blindly
Currently it's supporting SPX ( S&P500 ) and support for more instruments will come with next updates.
MACD PlusMoving Average Convergence Divergence – MACD
The MACD is an extremely popular indicator used in technical analysis. It can be used to identify aspects of a security's overall trend. Most notably these aspects are momentum, as well as trend direction and duration. What makes the MACD so informative is that it is actually the combination of two different types of indicators. First, the MACD employs two Moving Averages of varying lengths (which are lagging indicators) to identify trend direction and duration. Then, it takes the difference in values between those two Moving Averages (MACD Line) and an EMA of those Moving Averages (Signal Line) and plots that difference between the two lines as a histogram which oscillates above and below a center Zero Line. The histogram is used as a good indication of a security's momentum.
Added Color Plots to Settings Pane.
Switched MTF Logic to turn ON/OFF automatically w/ TradingView's Built in Feature.
Added Ability to Turn ON/OFF Show MacD & Signal Line.
Added Ability to Turn ON/OFF Show Histogram.
Added Ability to Change MACD Line Colors Based on Trend.
Added Ability to Highlight Price Bars Based on Trend.
Added Alerts to Settings Pane.
Customized Alerts to Show Symbol, TimeFrame, Closing Price, MACD Crosses Up & MACD Crosses Down Signals in Alert.
Alerts are Pre-Set to only Alert on Bar Close.
Added ability to show Dots when MACD Crosses.
Added Ability to Change Plot Widths in Settings Pane.
Added in Alert Feature where Cross Up if above 0 or cross down if below 0 (OFF By Default).
Squeeze Pro
Traditionally, John Carter's version uses 20 period SMAs as the basis lines on both the BB and the KC.
In this version, I've given the freedom to change this and try out different types of moving averages.
The original squeeze indicator had only one Squeeze setting, though this new one has three.
The gray dot Squeeze, call it a "low squeeze" or an "early squeeze" - this is the easiest Squeeze to form based on its settings.
The orange dot Squeeze is the original from the first Squeeze indicator.
And finally, the yellow dot squeeze, call it a "high squeeze" or "power squeeze" - is the most difficult to form and suggests price is under extreme levels of compression.
Colored Directional Movement Index (CDMI) , a custom interpretation of J. Welles Wilder’s Directional Movement Index (DMI), where :
DMI is a collection of three separate indicators ( ADX , +DI , -DI ) combined into one and measures the trend’s strength as well as its direction
CDMI is a custom interpretation of DMI which presents ( ADX , +DI , -DI ) with a color scale - representing the trend’s strength, color density - representing momentum/slope of the trend’s strength, and triangle up/down shapes - representing the trend’s direction. CDMI provides all the information in a single line with colored triangle shapes plotted on the bottom. DMI can provide quality information and even trading signals but it is not an easy indicator to master, whereus CDMI simplifies its usage. The CDMI adds additional insight of verifying/confirming the trend as well as its strength
Label :
Displaying the trend strength and direction
Displaying adx and di+/di- values
Displaying adx's momentum (growing or falling)
Where tooltip label describes "howto read colored dmi line"
Ability to display historical values of DMI readings displayed in the label.
Added "Expert Trend Locator - XTL"
The XTL was developed by Tom Joseph (in his book Applying Technical Analysis ) to identify major trends, similar to Elliott Wave 3 type swings.
Blue bars are bullish and indicate a potential upwards impulse.
Red bars are bearish and indicate a potential downwards impulse.
White bars indicate no trend is detected at the moment.
Added "Williams Vix Fix" signal. The Vix is one of the most reliable indicators in history for finding market bottoms. The Williams Vix Fix is simply a code from Larry Williams creating almost identical results for creating the same ability the Vix has to all assets.
The VIX has always been much better at signaling bottoms than tops. Simple reason is when market falls retail traders panic and increase volatility , and professionals come in and capitalize on the situation. At market tops there is no one panicking... just liquidity drying up.
The FE green triangles are "Filtered Entries"
The AE green triangles are "Aggressive Filtered Entries"

Jerry Romine Momentum Dream With Risk ManagementThe Momentum Dream Indicator with Risk Management is really two powerful indicators combined in one.
The Momentum Dream Indicator is a volatility and momentum indicator that measures the relationship between the Bollinger Bands and Keltner Channels to help identify consolidations and signal potential breakouts.
MOMENTUM DREAM INDICATOR:
SIGNALS AND ZONES:
Green Arrow = Post Squeeze Buy Triggered = GREEN ⇧ shows squeeze out on upward momentum (often a good time to buy)
Orange Arrow = Post Squeeze Sell Alert = ORANGE ⇩ shows squeeze out on downward momentum (often a good time to sell or NOT buy)
Green Dot on Chart - Day one of the buy zone
Green Shading - Buy Zone
Pink Dot on Chart - Day one of warning zone
Red Shading - Warning zone. Often a good time not to buy or to consider selling.
LABELS (Color Indicates Direction):
Momo Up / Down = Current momentum direction.
Squeeze = Squeeze is on and squeeze line dots are red.
Dots = number of day or bars the squeeze has been in red(on)
Squeeze Fired = Green or Orange arrow shows squeeze fired direction.
Stacked = Fibonacci 8, 21, 34, 55, 89 EMA are stacked up or down
SQUEEZE LINE COLOR DEFINITIONS:
Dark Red = Extra Squeeze (In & Out)
Red = Original Squeeze (In & Out)
Pink = Pre-Squeeze (In)
Yellow = Pre-Squeeze (Out)
Green = Bollinger Bands are officially outside of Keltner Channels
STRATEGY
There are multiple ways the Momentum Dream Indicator can be used.
1. Buy/Sell during the squeeze (generally lower volatility and lower option premiums)
2. Buy/Sell when the squeeze fires to catch the breakout (volume/volatility often increase)
3. Use Buy/Sell Zones with other signals for entering positions
4. Use Momentum to assist with position direction
5. Use fading momentum to tighten stops or close positions.
* The labels only show when certain criteria are met. For example if a squeeze fired the label only shows on that day but the indicator arrow will always show. For this reason the labels on the chart above will vary from day to day and only alert you when needed. :)
RISK MANAGEMENT INDICATOR
Risk management is a vital part of investing and this indicator provides 2 recommended positions sizes. One based on the classic 1-2% risk rule where you never risk more than X% of your account. A second based on position size not exceeding X% of your account.
The Risk Management Indicator does all of the hard math and provides you with a realistic trading plan, position size, and trail stop based on your customizable criteria. If you’ve ever wondered how much of a stock to buy, when to sell and when to take profits this indicator is for you!
Please Use the link below for more information or to purchase.

SQUEEZE MTF - @JuanSeNL// Thanks to LazyBear for SQZMOM_LB
The Squeeze Momentum Indicator have 2 indicators, The Momentum Indicator and the Squeeze Indicator, in this case I use the Squeeze Ind to shows how it works and to be easier to use it
The Squeeze indicator use Bollinger Bands and Keltner's Channels to find potential accumulation/distribution fases, a price range is a period when the price is moving sideways without any significant advancement in the upward or downward direction, so this indicator helps to detect the potential end for the range and alert for breakouts above or below the upper and lower trading range bounds.
When BB are into the KC bands signifies low volatility, so market preparing itself for an explosive move (up or down), and “Squeeze release”
GREEN: Low volatility
Multiple Time Frame Version - Allow to choose a different timeframe

ADX MULTICOLOR
ENGLISH:
ADX (AVERAGE DIRECTIONAL INDEX):
It is a non-directional oscillator type indicator, that is, it quantifies the strength of a trend regardless of its direction. In Spanish ADX means index of average direction. It is common to use it together with directional indicators of movement such as the (Squeeze Momentum Indicator), which show us the direction or predominant trend of the market.
HOW TO USE THE ADX INDICATOR
When the ADX is greater than 30, the market is in a strong trend, when it is between 23 and 30 it is not well defined and when it is less than 23 it indicates that the market is in range.
QUANTIFYING THE STRENGTH OF TREND:
ADX values help traders identify the strongest and most profitable trends to trade. Values are also important to distinguish between trending and non-trending conditions. Many traders will use ADX readings above 23 to suggest that the trend is strong enough for trend trading strategies. Conversely, when the ADX is below 23, many will avoid trending trading strategies.
ADX value Trend strength
0-23 Trend absent or weak
23-30 Strong trend
30-75 Very strong trend
75-100 Extremely strong trend
+ DI: (Green Color)
The + DI (Positive Directional Indicator) would be the indicator of positive direction and it would be showing us that the movements are trending upward.
-DI: (Red Color)
The –DI (Negative Directionl Indicator) would be the indicator of negative direction and it would be showing us that the movements have a downward trend.
IMPROVEMENTS IN THE DEVELOPMENT OF THE OSCILLATOR:
It is known that the ADX as a whole is composed of three lines, the first is the ADX itself, which measures the strength of the trend, when it has upward directionality, it means that there is strength in the movement.
The other two lines named (+ DI and -DI) mark if the force is bearish, bullish or, failing that, neutral.
When the + DI is above the -DI, it speaks of Bullish force. On the contrary, when these lines are reversed, we would be in the presence of a bearish force.
On the other hand, when the ADX is below the 23 point, it is considered that there is no force in the movement.
FUSION OF ADX AND LOS (+ DI and -DI):
To simplify this vision, we have merged the three lines that we talked about at the beginning of this section, attributing the color resulting from the crosses of the (+ DI and -DI) to the ADX itself, resulting in a single line that has the color of the type of present force.
CANDLE COLOR:
To help the more inexperienced trader, we have activated a function that will paint the candles the color of the ADX, providing a visual aid to the trader using this indicator.
THE ADX HAS 5 COLORS:
• ADX: Dark Green (Bullish force).
• ADX: Light Green (Loss of bullish strength).
• ADX: Dark Red (Bearish Force).
• ADX: Light Red (Loss of bearish strength).
• ADX: Orange (Lost strength, Disinterest and low volume).
NOTE:
It is possible to activate the lines (+ DI and -DI) in the indicator if you want to use the indicator independently, however, it is recommended to combine this indicator with a directional oscillator, such as the Squeeze Momentum Indicator.
---------------------------------------------------------------------------------------------------------------------------------------------------------------------------------------------------------------------------------------------------
ESPAÑOL:
ADX (ÍNDICE DIRECCIONAL PROMEDIO):
Es un indicador de tipo oscilador no direccional, es decir, cuantifica la fuerza de una tendencia independientemente de su dirección. En español ADX significa índice de dirección media. Es común usarlo junto con indicadores direccionales de movimiento como el (Squeeze Momentum Indicator), que nos muestran la dirección o tendencia predominante del mercado.
CÓMO USAR EL INDICADOR ADX
Cuando el ADX es mayor a 30, el mercado está en fuerte tendencia, cuando está entre 23 y 30 no está bien definido y cuando es menor a 23 indica que el mercado está en rango.
CUANTIFICACIÓN DE LA FUERZA DE LA TENDENCIA:
Los valores de ADX ayudan a los operadores a identificar las tendencias más fuertes y rentables para operar. Los valores también son importantes para distinguir entre condiciones con tendencia y sin tendencia. Muchos operadores utilizarán lecturas de ADX por encima de 23 para sugerir que la tendencia es lo suficientemente fuerte para las estrategias de negociación de tendencias. Por el contrario, cuando el ADX está por debajo de 23, muchos evitarán las estrategias comerciales de tendencia.
Valor ADX Fuerza de la tendencia
0-23 Tendencia ausente o débil
23-30 Fuerte tendencia
30-75 Tendencia muy fuerte
75-100 Tendencia extremadamente fuerte
+ DI: (Color verde)
El + DI (indicador direccional positivo) sería el indicador de dirección positiva y nos estaría mostrando que los movimientos tienen una tendencia alcista.
-DI: (Color rojo)
El –DI (indicador de dirección negativa) sería el indicador de dirección negativa y nos estaría mostrando que los movimientos tienen una tendencia a la baja.
MEJORAS EN EL DESARROLLO DEL OSCILADOR:
Se sabe que el ADX en su conjunto está compuesto por tres líneas, la primera es el propio ADX, que mide la fuerza de la tendencia, cuando tiene direccionalidad ascendente, significa que hay fuerza en el movimiento.
Las otras dos líneas denominadas (+ DI y -DI) marcan si la fuerza es bajista, alcista o, en su defecto, neutral.
Cuando el + DI está por encima del -DI, habla de fuerza alcista. Por el contrario, cuando estas líneas se invierten, estaríamos en presencia de una fuerza bajista.
Por otro lado, cuando el ADX está por debajo del punto 23, se considera que no hay fuerza en el movimiento.
FUSIÓN DE ADX Y LOS (+ DI y -DI):
Para simplificar esta visión, hemos fusionado las tres líneas de las que hablamos al principio de esta sección, atribuyendo el color resultante de los cruces de (+ DI y -DI) al propio ADX, dando como resultado una sola línea que tiene el color del tipo de fuerza presente.
COLOR DE VELAS:
Para ayudar al trader más inexperto, hemos activado una función que pintará las velas del color del ADX, proporcionando una ayuda visual al trader que usa este indicador.
EL ADX TIENE 5 COLORES:
• ADX: Verde oscuro (fuerza alcista).
• ADX: Verde Claro (Pérdida de fuerza alcista).
• ADX: rojo oscuro (fuerza bajista).
• ADX: Light Red (Pérdida de fuerza bajista).
• ADX: Naranja (Pérdida de fuerza, Desinterés y bajo volumen).
NOTA:
Es posible activar las líneas (+ DI y -DI) en el indicador si desea utilizar el indicador de forma independiente, sin embargo, se recomienda combinar este indicador con un oscilador direccional, como el Squeeze Momentum Indicator.

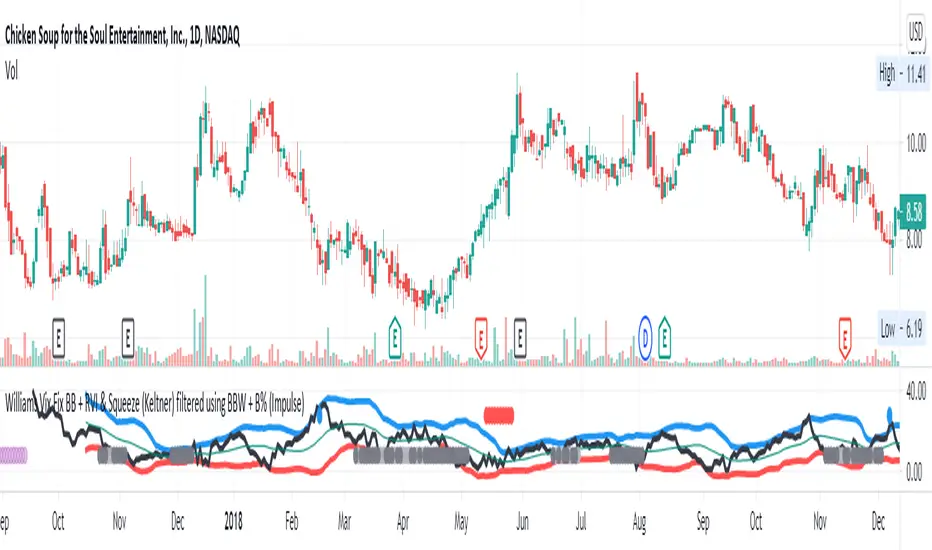
Williams Vix Fix BB + RVI & Squeeze (Keltner) filtered BBW + %BLegend:
- When line touches or crosses red band it is Top signal (Williams Vix Fix)
- When line touches or crosses blue band it is Bottom signal (Williams Vix Fix)
- Red dot at the top of indicator is a Top signal (Relative Volatility Index)
- Blue dot at the top of indicator is a Bottom signal (Relative Volatility Index)
- Gray dot at the bottom of indicator is a Keltner Squeeze signal (filtered by either BBW or %B)
- Silver dot at the bottom of indicator is a weaker Keltner Squeeze signal (Doesn't meet either BBW or %B filter)
- Purple is a 'Half Squeeze' only 1 Bollinger Band crossed the Keltner Channel
This is an attempt to make use of the main features of all 6 of these Volatility tools :
- Williams Vix Fix + Bollinger Bands
- Relative Volatility Index (RVI)
- The crossing of Keltner Channel by the Bollinger Bands (Squeeze)
Conditions to Help Filter Keltner Squeeze:
- When the Bollinger Bands Width (BBW) value is lower than the lowest value within a period plus a margin of error (percentage)
- When the %B value reaches the alert level detailed in LazyBears indicator. ()
If it meets one of these 2 filters and there is a Keltner Channel Squeeze than gray color or else if the squeeze doesn’t meet one of the 2 filters than silver color (weaker Squeeze).
The goal is to find the best tool to find bottoms and top relative to volatility and filter the squeeze.
The idea is that both Williams Vix Fix + Bollinger Bands and Relative Volatility Index both already give the main volatility bottom and top so combining them to compare and validate the signals makes sense. (Note: Bottom signal is more accurate than top). In addition, I added the squeeze to show the potential breakout pressure and to compliment bottom and top signals.
For ideas on how to continue this work :
I encourage ideas to combine the Williams Vix Fix and Relative Volatility Index for volatility top and bottom (with probability would be awesome)
And I encourage ideas to filter Keltner Channel Volatility Squeeze using both the BBW or %B or other volatility squeeze indicators or a combination of all of them.
Also, I encourage people to post their top parameters for the BBW and %B to filter the Keltner Squeeze in the comments or to send me them by chat relative to this indicator.
Half the battle is making the indicator, while the other half is tuning the parameters.
The current parameters are one of the least aggressive, and act as a mild filter.
Note: You can also change the threshold for RVI top and bottom.
And this work builds on my last indicator:
If you have ideas on this work or have ideas on potential combinations please message me, I always want to learn or get perspective on how it can be improved.
Sharing is how we get better (Parameter tuning, ideas, discussion)
I don’t reinvent the wheel, just trying to make the wheel better.
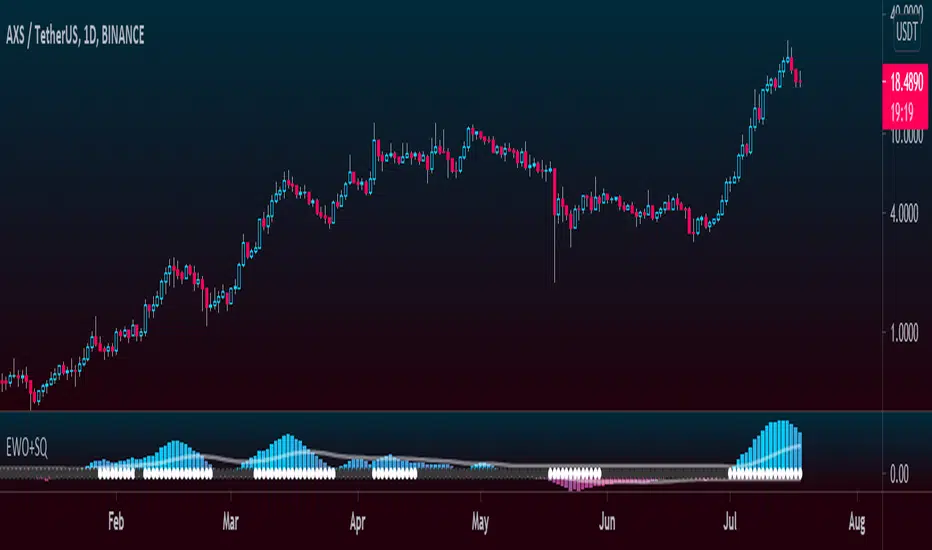
Elliott Wave Oscillator + TTM SqueezeThe Elliott Wave Oscillator enables traders to track Elliott Wave counts and divergences. It allows traders to observe when an existing wave ends and when a new one begins. It works on the basis of a simple calculation: The difference between a 5-period simple moving average and a 34-period simple moving average.
Included with the EWO are the breakout bands that help identify strong impulses.
To further aid in the detection of explosive movements I've included the TTM Squeeze indicator which shows the relationship between Keltner Channels & Bollinger Bands, wich highlight situations of compression/low volatility, and expansion/high volatility. The dark dots indicate a squeeze, and white dots indicates the end of such squeeze and therefore the start of an expansion.
Enjoy!
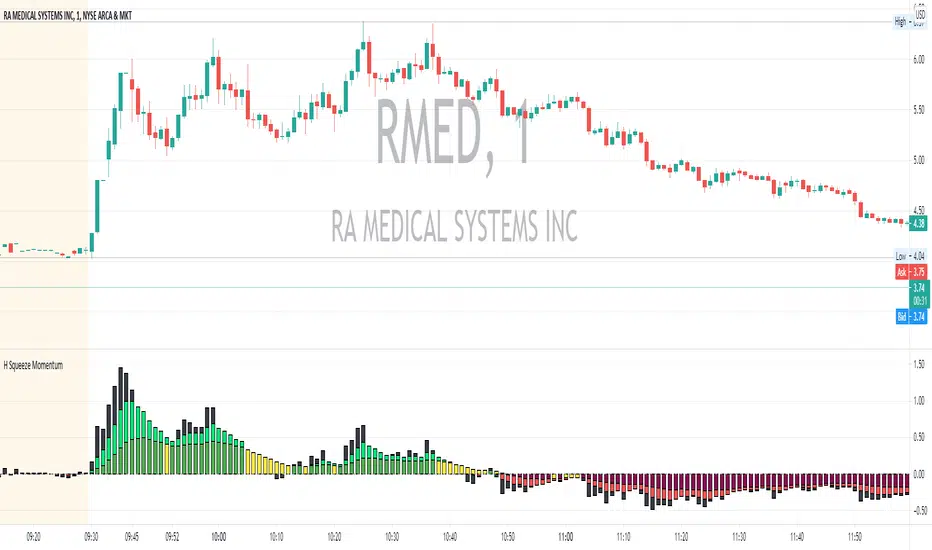
Hamdan Squeeze MomentumHamdan Squeeze Momentum
The script of is show Squeeze bar.
█ FEATURES
Study Is Based In Momentum Indicator :
Green : Uptrend in general
Lime : Spots the current uptrend leg
Black : The maximum profitability of the leg in a long trade
The Squeeze happens when Green+Lime+Black are aligned (the larger the values the better)
Maroon : Downtrend in general
Red : Spots the current downtrend leg
Black: The maximum profitability of the leg in a short trade
The Squeeze happens when Maroon+Red+Black are aligned (the larger the values the better)
Yellow : The trend has come to a pause and it is either a reversal warning or a continuation. These are the entry, re-entry or closing position points.
█ Access To Script Add It To Your Chart For Free.
█ For Script Source Code Contact me
Squeeze Momentum [Plus]The "Momentum" in this indicator is smoothed out using linear regression. The Momentum is what is displayed on the indicator as a histogram, its purpose is obvious (to show momentum).
What is a Squeeze? A squeeze occurs when Bollinger Bands tighten up enough to slip inside of Keltner Channels .
This is interpreted as price is compressing and building up energy before releasing it and making a big move.
Traditionally, John Carter's version uses 20 period SMAs as the basis lines on both the BB and the KC.
In this version, I've given the freedom to change this and try out different types of moving averages.
The original squeeze indicator had only one Squeeze setting, though this new one has three.
The gray dot Squeeze, call it a "low squeeze" or an "early squeeze" - this is the easiest Squeeze to form based on its settings.
The orange dot Squeeze is the original from the first Squeeze indicator.
And finally, the yellow dot squeeze, call it a "high squeeze" or "power squeeze" - is the most difficult to form and suggests price is under extreme levels of compression.
Now to explain the parameters:
Squeeze Input - This is just the source for the Squeeze to use, default value is closing price.
Length - This is the length of time used to calculate the Bollinger Bands and Keltner Channels .
Bollinger Bands Calculation Type - Selects the type of moving average used to create the Bollinger Bands .
Keltner Channel Calculation Type - Selects the type of moving average used to create the Keltner Channel.
Color Format - you to choose one of 5 different color schemes.
Draw Divergence - Self explanatory here, this will auto-draw divergence on the indicator.
Gray Background for Dark Mode - to make them more visually appealing.
Added ADX (Average Directional Index) that measure a trend’s strength. The higher the ADX value, the stronger the trend. The ADX line is white when it has a positive slope, otherwise it is gray. When the ADX has a very large dispersion with respect to the momentum histogram, increase the scale number.
Added "H (Hull Moving Average) Signal". Hull is a extremely responsive and smooth moving average created by Alan Hull in 2005. Have option to chose between 3 Hull variations.
Added "Williams Vix Fix" signal. The Vix is one of the most reliable indicators in history for finding market bottoms. The Williams Vix Fix is simply a code from Larry Williams creating almost identical results for creating the same ability the Vix has to all assets.
The VIX has always been much better at signaling bottoms than tops. Simple reason is when market falls retail traders panic and increase volatility, and professionals come in and capitalize on the situation. At market tops there is no one panicking... just liquidity drying up.
The FE green triangles are "Filtered Entries"
The AE green triangles are "Aggressive Filtered Entries"

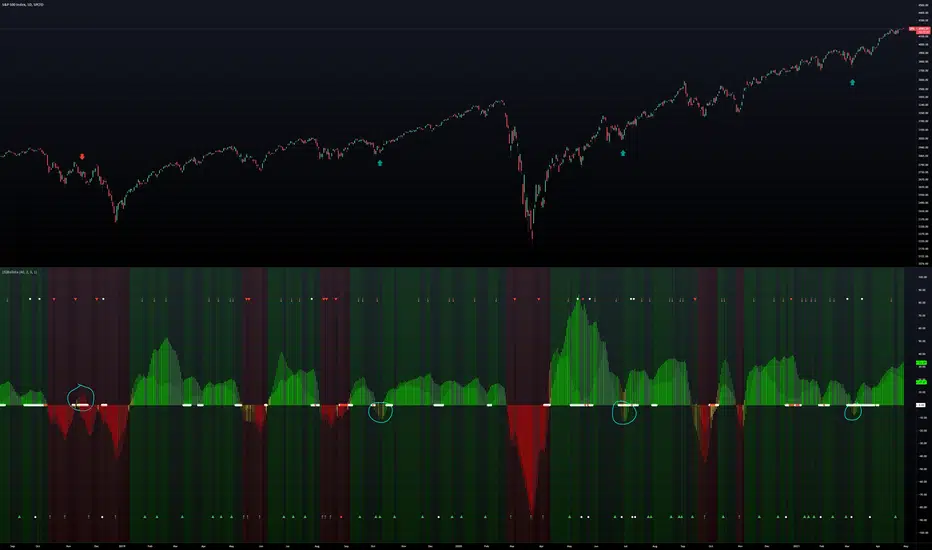
(JS) BallistaAlright so this is a script I made by combining two existing ones and making a really cool discovery that has proven very useful.
You'll notice that there are two separate oscillators that are laid on top of each other. The background oscillator is my "Tip-and-Dip" oscillator which you can see here (will refer to this as TnD from here), and the foreground oscillator from the Squeeze , which can be viewed here .
Initially I just wanted to see how they interacted with one another and compare them, but this led to some pretty interesting observations.
First let me go through the options real quick to get that out of the way, though it is mostly self-explanatory.
Lookback Period defines the amount of bars used for the TnD oscillator.
Smoothing Value smooths out the TnD output.
Standard Deviations is used to calculate the TnD formula.
Color Scheme is preset BG colors.
Using Dark Mode changes colors based on dark mode or not.
Squeeze Momentum On turns the Squeeze in the foreground off and on.
Arrows Off turns the arrows on the indicator off and on.
Now to explain the indicator a bit more. I have the default lookback period as 40 due to the Squeeze being 20, which makes the TnD oscillator the "slow" output with the Squeeze being the "fast" output.
Some initial observations were that when both the Squeeze and the TnD are moving in the direction, when the Squeeze is higher (uptrend) or lower (downtrend) it seems to indicate strength in the move. As the move loses steam you'll notice the Squeeze diverge from the TnD.
However, the most useful thing I discovered about the interaction between these two indicators is where the name for it came from. So if you aren't familiar with what a Ballista is, per Wikipedia, "The ballista... sometimes called bolt thrower, was an ancient missile weapon that launched either bolts or stones at a distant target." There are instances where the Squeeze seems to get ahead of itself and gets too far away from the TnD (which is the long term trend between the two). The key thing to look for is an "inverted squeeze" - this is when the squeeze oscillator ends up flipping against the TnD. When this occurs there is an extremely high probability that you'll see price shoot back the opposite way of the Squeeze.
I've been using this setup myself for about a year now and have been very satisfied with the results thusfar. I circled some examples on the SPX daily chart here to show you what I mean with the inverted Squeeze shooting back.
(JS) Triple StochasticSo I ended up adding a ton of stuff to my prior Double Stochastic script which you can see here .
The concept of the Double was to smooth out the existing Stochastic by applying a Stochastic to the existing Stochastic (hence the Double). My concept for the Triple Stochastic is much different. It combines a regular stochastic, stochastic RSI, and the double stochastic to get a smoothed output based on all 3.
Also - since I love being able to see a Squeeze (see my Squeeze Pro indicators - Squeeze Pro 2 & Squeeze Pro Overlays ) I added the Squeeze to the Stochastic (the dots). If you're unfamiliar with how a Squeeze works, or what it is, check out my links for explanation. A quick explanation however is that the Squeeze is an indicator that was invented by John Carter that detects price compression before a big move out of a range. This is done by using Bollinger Bands and Keltner Channels, the BB shrink inside the KC. The color of the dots represent the depth of the BB in the KC, white (or black) being the lightest squeeze, red being the standard squeeze, and yellow being the strongest squeeze. Now on to the indicator:
The first thing you'll notice is the options available for the type of Stochastic you'd like to use:
Standard : This is a regular Stochastic
Stochastic RSI : This is the standard Stochastic RSI
Double : This is the Stochastic on top of a Stochastic from the prior version
Triple : This is simply an average of all 3 of the above combined together
(Top indicator shows the Triple Stochastic)
The options "K", "D", and "Smooth" are the settings from a regular Stochastic used to set up the type of Stochastic you choose to use.
Now let's say you're not sure how one type performs compared to another, or you like the quickest momentum change but also like to see the smoothest trend, or you want to use the same types of Stochastic and watch for them to cross like moving averages - for these reasons I added the ability to add a second Stochastic for comparison.
(2nd indicator shows a fast and slow Triple Stochastic together)
Quite obviously, the "K 2", "D 2", and "Smooth 2" are what is used in order to set the parameters for the second Stochastic.
Now another thing I added was the option to replace the regular Stochastic and instead look at the distance between the K and D. By turning off "Use K% and D%" you get to see this in action. To put it simply, a cross above zero would indicate a positive Stochastic crossover, and a cross below zero would represent the opposite. There's also an option titled "SMA Length using Difference" which, to smooth this out a bit, allows you to apply a moving average to the distance. By setting it at 1 you'd see the actual distance between K and D.
(3rd indicator shows the K and D distance used as a plot)
Another thing I wanted to do was add a different type of background that wasn't based on the indicator itself. I decided to use ADX & DMI which is a great way to determine the trend. When you select "ADX/DMI BG" the BG colors will change from being based on the indicator to being based on ADX and DMI.
(The 3rd indicator also shows the ADX/DMI BG being used).
And now finally the last feature I decided to add takes us back to the Squeeze. Essentially it is just the Stochastic shown through the lens of Squeeze momentum, as I ended up plugging the Stochastic output into the Squeeze momentum formula to create an oscillator. By selecting "Use Oscillator" you will see this in action as well.
(Bottom indicator shows the oscillator addition)

Matrix Series and Vix Fix with VWAP CCI and QQE SignalsBased on @ChrisMoody Williams_VIX_Fix and @glaz Matrix Series .
This indicator identify potential zone of reversal according to momentum and volatility.
Includes VWAP CCI and QQE Signals.

Price Action IndexI've created a simple oscillator which I think does a good job of easily showing you when price is worth watching or not. I think all too often you get stuck looking at something like an RSI and end up trading noise.
From my observations and experiences, I've found that there are 2 major catalysts for price movement--
Price is either trending and reaches a top or bottom, or
Price is consolidating and ready to make a move in some direction
These movements can be seen quite well from a Bollinger Band, which is what mostly gave me the inspiration. When I watch a chart with a BB on it I see that either you're looking to trade price moving out of a squeeze or riding price up/down the band until it crosses over and makes a move to the moving average.
My solution was to multiply the direction of price by the strength of its deviation.
Price gets converted into a signal between -1.0 (bottom of the range) and 1.0 (top of the range)
Standard Deviation gets converted into a stochastic signal between 0 (next to no deviation from mean) and 100 (highest deviation in lookback)
These 2 get multiplied by each other
The result tells you if price action is trending bullish and if its approaching max strength (perhaps Overbought), example: Price is hitting highs (1.0) and deviation is also at its highest (100) = 100, opposite for bearish
Result can also tell you if price is at the top of the range but the deviation is so tiny and we're mostly pinned to the mean (1.0 * 5 = only 5)
How to Trade this Indicator--
If the indicator is stuck near the middle and purple:
- Don't make directional trades or you'll be eaten alive by the chop
- Good idea to sell options, Iron Condors/Butterflies, etc
- Wait for a move to breakout --> the purple will fade away and give way to a direction
--- As in all trading scenarios, be mindful of fakeouts/short moves to one direction that very quickly get reversed
If the indicator is heading higher:
- This would indicate there is a bull trend going on, get long
- If we are reaching the overbought area, this is an ideal place to take profits or look at spreads like Bearish Call Spreads (sell calls)
- I think you can make your own determination of when to sell by either selling when we're in the overbought area (if it reaches there) or staying bullish so long as it is above the zone
If the indicator is heading lower:
- Bear trend, shorting is possible
- Can use this as a contrarian signal to buy lows
A couple of charts with the indicator and a purple squeeze box I've drawn (can sometimes get noisy in real-time, but hindsight is 20/20)--
Bitcoin on Daily with default 20 length
Gamestop on 30 minute time frame with 100 length
Please feel free to use this indicator for your trading or your own indicators. This particular script is very stripped down/bare bones from what I have been working on as an ongoing project. If TradingView ever returns scripts you can sell, I would probably open that up for a small premium.

Percent changeThis indicator shows WMA ribbons of the percentage of price movements.
Strong peaks show unusual price movement and might indicate a good time to close your position.
A narrow band shows stable price movement and could indicate a good time to get into a position. (Squeeze)

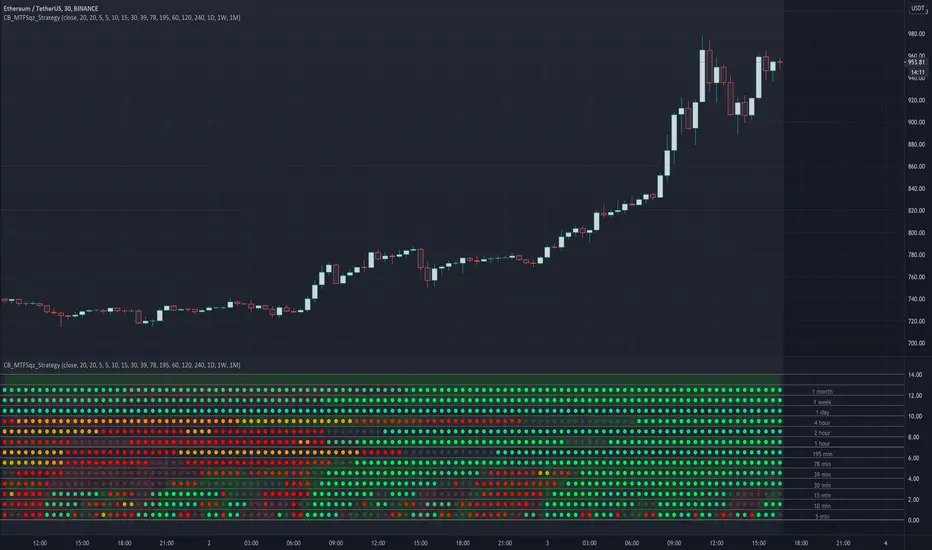
CryptoBreakers MTF Sqz StrategyThis is a Multi Time Frame squeeze strategy that has been consistently catching large BTC and ETH moves.
It's building up on the basic squeeze play of both the upper and lower Bollinger Bands going inside the Keltner Channel
and in one indicator quickly seeing when both Bollinger Bands start to come out of the Keltner channel and positioning us
for the large move that is about to take place.
Before I explain the rules for the winning strategy, let's cover the basics on the indicator.
1. When both the upper and lower Bollinger Bands go inside the Keltner Channel, a compression is in place, and the squeeze is on. This is reflected on the indicator as colored dots.
2. The indicator covers 5min, 10min, 15min, 30min, 39min, 78min, 195min, 1hr, 2hr, 4hr, 1 day, 1 week, and 1 month timeframes for squeezes.
Your chart needs to be set to the lowest time frame resolution of 5min in order for the indicator to show squeezes in all higher timeframe resolutions.
So whatever your chart resolution is, the indicator will show the squeezes in that timeframe and above correctly.
3. ORANGE dots indicate high level of compression. RED dots indicate medium level of compression. BLACK dots indicate low level of compression and the GREEN dots indicate no compression.
4. Generally, higher the level of compression and the longer duration of the squeeze, the more explosive the move expected. With this one indicator I was able to consistently catch 500 plus
point moves in BTC and 30-50 point moves in ETH.
Let's review the rules of the strategy:
1. For the ideal set up, we look for two lower timeframe resolutions (preferably 30 and 39 minutes OR 39 minutes and 78 minutes) to be in squeeze for at least 6 dots and at the sametime we
need to see one or two higher timeframe resolutions in squeeze (195 minutes and 1 day OR 1 day and 1 week resolutions)
2. Determine the direction of the trend in the higher time frames (bullish and bearish). We look for stacked up or down EMAs of 8, 21, 34, 55 and 84 on a daily and/or weekly chart.
3. For entry, wait for the lower timeframe squeeze to fire meaning look for the first green dot after the black, red, or orange dots (minimum six in total).
For example the 30 min row shows the first green dot after the sequence of squeeze dots and the direction of the price movement (up or down) at that green dot bar aligns with the direction of the price movement in the higher timeframe chart.
4. Once the lower timeframe squeezes fire, we follow the move to continuation of the firing of the higher timeframe squeezes.
5. Our exit will be at the price point of 6-9 green dots after the higher timeframe squeeze fired in the same direction as the lower timeframe.
I created this to make it easier to see the set up on any stock and crypto chart. It has been working consistently on BTC and ETH price action. I have not seen anything on TV that cover multi time frame squeeze play in a very simple and clean way.
This makes it very easy to see the set up with one indicator. I'm using this with my trading group.
If you would like to get access, please feel free to DM me at @CryptoBreakers
[Zekis]Squeeze Momentum + IchimokuHi,
This is a strategy developed by @zsone, a strategy suitable mostly for altcoins (but not necessary).
The strategy is using the following indicators: Squeeze Momentum (LazyBear), two Ichimoku Clouds (one is MTF), daily EMA21 and EMA golden cross (optionally).
Setting should be used as default.
Rules for entries (scalping):
Go Long (green line on the histogram):
- use low time frames (3m, 5m, 15m)
- candle closes above the ichimoku cloud
- squeeze momentum, first grey cross on green histogram (2 ways):
1. histogram is green and have a black cross and later it turns to grey cross
2. the histogram is red with grey cross and it goes to green with grey cross without having a black cross, just directly goes green histogram with grey cross
- price is above the daily EMA21
- price is above or inside de ichimoku cloud MTF (1h TF)
- optionally! EMA golden/death cross
Go Short (red line on the histogram):
- vice versa
Rules for exits:
- DI+ crosses down on DI- on longs
- DI- crosses up on DI+ on shorts
- or any fixed, dynamic, trailing... TP/SL (according to the market conditions)
This strategy can be used also for high time frames (12h, 1D) with a golden/death cross confirmation.
Soon I will publish a screener that scan multiple altcoins at once to find setups easier.
P.S.1 The strategy should be used with it's default settings/values (you can change them if you want), but there are 2 versions of Squeeze Momentum from Lazy Bear that you can choose from.
P.S.2 This is not a magic strategy, please do your research before using real money!
P.S.3 The strategy is free to use, just add it to the favorites and then to the chart.
Enjoy!

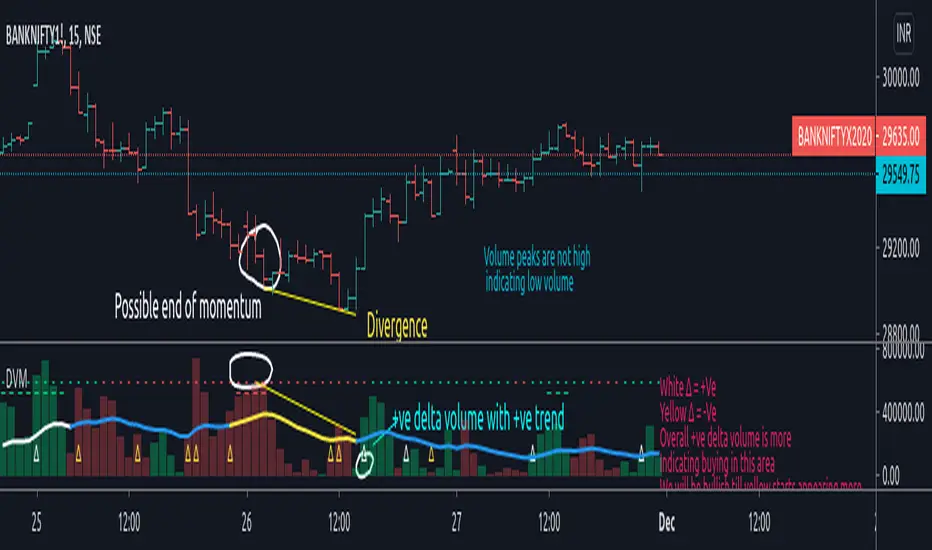
Delta Volume Moves Today I propose an indicator to measure volume trend and change in buying and selling pressure (Delta). This is a synthetic mechanism to derive delta volume and then formulate rest so its not like typical delta volume indicator either.
So what is it exactly?
Indicator first calculates the cumulative delta volume , then filters it through filters applied in the calculation to identify major volume changes/pressure change, it also keeps track of overall trend based on 20 SMA filter as basis and 2 stdv movement from it applied on cumulative delta volume . This is plotted on top side of the indicator with "-" and "_" plots. Color lime indicates bullish trend and color red indicates bearish trend .
Delta filter is dependent on the factor input which is user defined, here by default it is 1.5, which will indicate overall significant change in pressure in volume in that particular direction, please note that higher the number lower the delta plots you will have to count it, and number below 1 would be useless as it would not be measuring "increase" in delta volume but decrease. So it is advised to keep it around 1.5 to be reasonably useful measure. This is plotted with "∆" character on the volume bars.
How can we use this to our advantage?
As you can see on chart, its able to identify possible reversal or tops/bottoms of the price action, while this is the primary use it is also worth noting that in comparison to the regular volume indicator which is dependent on the candle price close with respect to its open, this is much better visual representation of the sell or buy volume .
When you apply delta filters and trend filters to an already easy to read volume indicator, it is making significant impact on indicators ability to identify major volume changes and trend changes with respect to cumulative delta volume .
Authors note:
Please note that this study is experimental and published for the educational purpose, if you decide to use it to monitor market it is advised that you put in some time to observe correlations between this and price action before you start trading it.
Also, while on chart this is showing impressive tendency to identify tops and bottoms, its a very limited view. Please keep in mind to check this across different scripts which have good qty of volume .
Author takes no responsibility of your loss or profit from this.
Past performance is no assurance of future performance.
Regards.
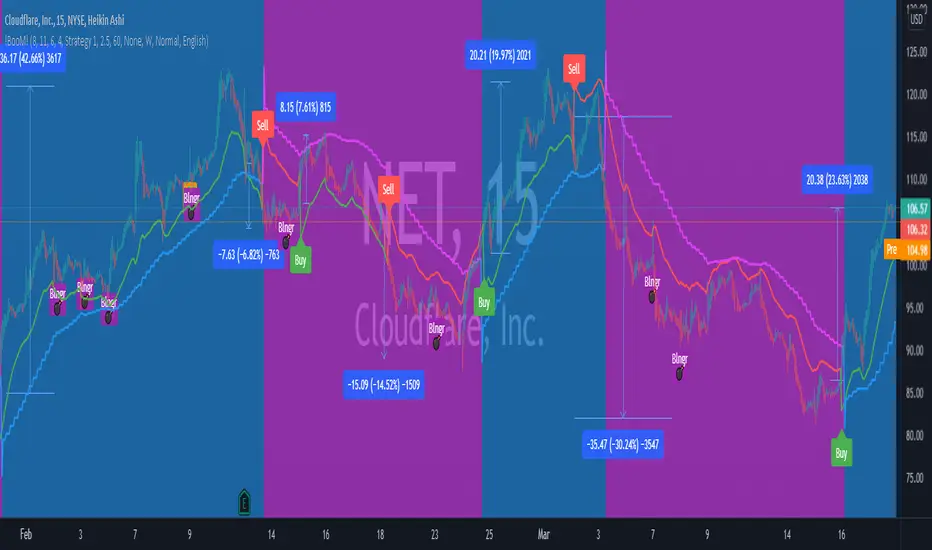
!BooM!Hello
The indicator measures the relationship between Average True Range (ATR) that shows how much an asset moves, on average, during a given time frame and Standard Deviation that measuring how widely asset prices are dispersed from the average price. If prices trade in a narrow trading range, the relationship between the ATR and SD will return a low value that indicates low volatility that will lead to potential price quick movement.
To increase the accuracy of the indicator and reduce false signals, it generates three circles, each indicate protentional price quick movement coming. For circle to print, following criteria must meet:
• Green Circle is based on low volatility and both ATR and SD are at minimum value for a short pre-defined time frame.
• Magenta Circle is based on low volatility and SD are at minimum value for a long pre-defined time frame.
• Yellow Circle is based on low volatility and SD are at minimum value for a short pre-defined time frame and Average Directional Movement Index reaching to pre-defined level.
The indicator focuses mainly on identifying potential price quick movement. However, it is equipped with two signal that is generated upon crossing the keltner channel upper or lower bands to help identifying the direction of the price movements but the user shall study the chart on big time frame to confirm the direction of the price movement.
If you would like to use it, please drop a message or find other contact under my signature.
After purchase, open the TradingView indicator library. Under the Invite-Only Scripts section, you will see it. Add it to your chart and save your chart layout.