Square of Nine Price & Time Forecasting Grid📐 Square of Nine Price and Time Forecasting Grid
Adapted and Interpreted by Javonnii | Inspired by Patrick Mikula
The So9 Price and Time Forecasting Grid is a self-contained forecasting grid that allows traders to visually forecast levels in both price and time, using only Square of Nine calculations.
This indicator dynamically generates an expandable grid of angles, levels, and timeline based on the placement of a single anchor point, typically from a significant high or low. It requires no manual drawing or external tools.
🔍 How It Works:
The So9 Price and Time Forecasting Grid uses Square of Nine calculation and rotational logic to project price levels, time intervals, and internal angular structure from a single anchor point.
Once applied to the chart, the grid self-generates:
• Price levels using 360° degree Square of Nine intervals
• Timeline projections using Square of Nine progression intervals
• Diagonal and cardinal cross angles that dynamically propagate from the anchor
• Granular diagonal angle control, letting you refine internal grid resolution for tighter price structural analysis in relation to the forecasting grid.
⚙️ Setup Instructions
1. Select a Significant Pivot:
After loading the indicator, you’ll be prompted to select a significant high or low on your chart. This serves as the anchor point for the entire grid.
2. Price Grid Auto-Population:
Once anchored, Square of Nine price levels will automatically populate on the chart. These levels reflect Dynamic Square of Nine intervals from the anchor using rotational math.
3. Scale to Fit Your Instrument:
Use the provided UI settings to scale the grid to fit your instrument’s price structure. This ensures the levels align with actual historical price.
4. Engage Timelines:
Activate the timeline progression feature to generate forward-projected time intervals using Square of Nine-based timing logic. The entire grid can be extended up to 500 bars ahead on any timeframe.
5. Add Diagonal Angles:
Select which Square of Nine angle resolution you’d like to overlay from either the cardinal cross or diagonal cross based on Square of Nine geometry. This will populate diagonal levels within the grid, creating a full structural grid.
6. Customize Visuals:
You can toggle or hide price levels, timelines, or diagonal angles independently.
The entire grid can also be color-coded and customized to match your charting preferences.
All elements are plotted automatically. There is no manual drawing or calculation required. You can toggle the components on or off based on your workflow:
• Hide price levels if you just want time lines.
• Focus on angles without price levels.
• Use timeline progression independently.
📘 Attribution and Permission
This tool is inspired by concepts from "The Definitive Guide to Forecasting Using W.D. Gann’s Square of Nine" by Patrick Mikula.
The indicator reflects my personal adaptation and implementation of these forecasting principles within TradingView.
I have asked for and received permission from Patrick Mikula to share and publish tools derived from his work.
This applies to this script and to any other indicators I’ve developed that incorporate or build upon his material.
Documentation of this permission is available upon request.
Credit and respect to Patrick Mikula for his contributions to Gann-based research and for granting me the opportunity to share these tools with others.
Squareof9
Doubled Numbered Square of Nine Progression | RegressionThe Doubled Number Square of Nine Progression | Regression Indicator enables forecasting of support and resistance levels using the SQ9 progression or regression from a user-selected pivot price. The indicator also plots adjustable pivots on both the chart and the Square of Nine.
How to use to forecast support and resistance levels:
1. Select a Pivot Point: Choose a top or bottom pivot to use as the starting point. Select High or Low in the indicator to set the correct price to the pivot.
2. Set Price Increment or Decrement: Select a price increment to advance the starting price on the Square of Nine (for example 1 or -0.01).
3. Rotate to add or decrease the number of rungs on the Square on Nine: Rotate the Square of Nine and adjust the dimensions. The horizontal levels correlate to the rotation of the Square of Nine.
4. Plot Levels: Select a Square of Nine angle to plot the support and resistance levels based on the selected increments. These levels auto expand and decrease depending on the number of rotations in step 3. The price values from each of the selected diagonal or cardinal cross are applied to the chart with labels on both left and right. Left labels represent the cell the time variable and the right label is price.
5. Review Levels: Conduct a simple review of the plotted support and resistance levels in relation to recent market pivots.
6. Identify Correlations: Identify the Square of Nine cardinal cross or diagonal cross angle that correlates with the most market pivots.
7. The indicator plots user-adjustable pivots on both candles/bars and displays their placement on the Square of Nine in both Progression and Regression. The close price is plotted on the Square of Nine in real-time with a white background. This helps users identify which angles the highs and lows favor from the selected pivot. The pivot levels' colors can be adjusted.
Each market has its tendencies, favoring specific angles from the cardinal or diagonal cross. The basic idea is to choose between the diagonal cross and cardinal cross angles to forecast support and resistance levels.
Settings:
Overview:
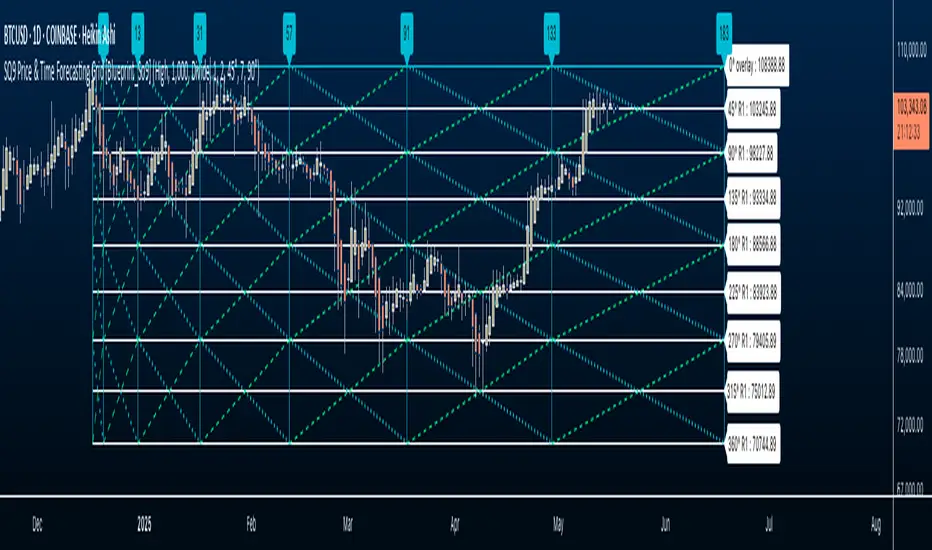
Example on Forecasting Support and resistance level using this indicator:
In the image above, I'm progressing from the significant low at a rate of $200 per cell. Based on the plotted pivots, I've selected the 315-degree angle on the diagonal cross as it aligns with a few recent pivots. Now, I've drawn a vertical line to show that as we add rungs to the Square of Nine, we introduce support and resistance levels based on the identified angle that aligns with these early pivots from the low.
In the image below, I've moved forward in time to show how the initial angle selected based on the early pivot forecasted support and resistance levels around the high in BTC. Do not expect the price to turn sharply at the levels the indicator generates, but use it to help identify SQ9 levels that may form market turns. As P. Mikula mentions in his work, "The Square of Nine successfully defines market price swings but it does not make the market form pivots."
This indicator includes enhancements made to the Gann Square of Nine indicator originally created by @ThiagoSchmitz.
This indicator is inspired by the methodologies detailed by Patrick Mikula in his book " The Definitive Guide to Forecasting using W.D Gann's Square of Nine ." I recommend checking it out. He also mentions another use case as a Price and Time chart in his " Gann Scientific Method Unveiled, Volume 2 ." FYI, I am not affiliated with Patrick Mikula in any way.
Known Issues:
Close price plotted on the Square of Nine in Regression "from a high pivot" takes a current candle to close in order to be plotted. Progression works as expected.

PRESTANA SQ9PRESTANA SQ9 - Advanced Analysis with Revised Square of 9 and Custom Gann Scale
Description:
PRST SQ9 is an innovative technical analysis tool that revolutionizes the use of the Square of 9 by integrating it with a custom Gann scale and the application of solar degrees. This unique script stands out for its ability to generate more precise levels of analysis compared to traditional market indicators.
Key Features:
Customizable Price Scale (Price Unit): By adjusting the 'price unit' and 'factor', our script allows for extremely precise levels of analysis. This approach provides greater flexibility and adaptability to various market conditions.
Application of Solar Degrees: A distinct feature of our script is the use of solar degrees, offering an alternative perspective to the traditional Square of 9 scale. This allows for a broader range of analysis and the identification of key market turning points.
Customizable Configuration: Users can set the desired time frame (TF) and adjust the 'price unit' and 'factor' to suit their specific needs. For instance, settings like 1, 4, 16, 64, 256, or 2, 8, 32, 128 can be used to calibrate the indicator.
Usage Guide:
Setting the Time Frame and Price Unit: Select the TF you wish to analyze and set the 'price unit' to values like 1 or 2, and their multiples (e.g., 4, 16, 64, 256 for 'price unit' 1).
Adjusting the Factor: Modify the 'factor' to correspond to the degrees you want to explore on the Square of 9. For example, a 'factor' of 1 corresponds to 180°, 2 to 360°, 0.5 to 90°, etc.
Time Analysis: For time analysis, set the degrees for the cycle you wish to observe and the reference TF.
Uniqueness and Added Value:
PRST SQ9 stands out for its ability to merge the Square of 9 with a dynamic price scale and the application of solar degrees, offering users a richer and more varied technical analysis. This unique approach provides traders with a powerful tool to navigate the markets with greater precision and confidence.

Gann Square of 9Here it is, the Gann Square of 9. An easy-to-use tool to determine possible support and resistance levels. Input a starting value to be the starting point of the square. Then the increasing value will be used to get the value of each cell on the table.
It's possible to show the diagonals and a spot number to see what cell value the current price is close to. The diagonals are known to be the key support and resistance levels in Gann's analysis. That way, it's possible to show those diagonals in the chart for easy reading of those levels.

Gann Spiral / Square of 9The Gann Spiral, more commonly known as the Square of 9 is one of the most well known tools that Gann used. Today, it is most commonly used to find possible support and resistance levels, and possible reversals in time.
This indicator is a more flexible version of the traditional Gann Spiral / Square. This is achieved by allowing you to change:
Price and Time direction
The timeframe
How often to draw lines based on degrees
Toggles for Price and Time
Price and Time line customization
How to use:
1 - Select your desired starting value of Price and Time.
2 - Choose the direction of Price and Time.
3 - Choose the amount of lines to display.
4 - Choose how often for lines to be drawn (Rotation Degree Value).
==================================================================
Side Note:
This uses a more proper and more accurate formula to "navigate the square". (Sqr x + 2)^2 is not the formula used, but rather (Sqr x + 1)^2.
If you wish to use the formula you're used to, change Full Revolution Value to 180.
The reasoning behind this formula change is because I re-created the square in the form of an actual spiral. The issue with such a conversion is that the formula used to construct it uses one Pi. If you understand circles, you should know that we're off by 180 degrees. A full rotation is 360, not 180.
Correcting for this error requires a slight but important change in the formula, that being +1 instead of +2. This not only corrects it to fit for a proper spiral, but also makes it easier to use fractions. 1/360 results in 1 degree. This slight formula change makes it incompatible when used on the actual Square of 9, however it is technically the more accurate formula.

Gann ToolsThis is basically an updated version of my scripts with additional features, all in one instead of 3 separated scripts,
The script includes the following but not limited to:
1- Price Angles (Angles of Square of 9) with the ability to add extra primary angles or whole cycles, and the customization of every line color and style and more
2- Gann Star with the customization of every line color and style and more
3- Gann Grid with the customization of every line color and style and more
4- Gann Fan/s, that can be drawn from the all 4 directions/points, with the customization of every line color and style and more
5- Gann Square (Sq of 52/90/144) with the ability to extend boxes in all directions, and of course with the customization of every line color and style
The only reason that made me create 3 separated scripts, is that there was a limit of 55 line per script, and I had to draw a lot of lines, specially in the Grid, now that limit is 500 (crazy right?).
You can now select the starting point with a click instead of having to type the price by yourself, input whatever color you want for every single line that will be drawn on your screen.
I hope everyone enjoys using my indicator/s to plot their creativity on the chart.

Gann Circle Intraday LevelsThis indicator is an intraday version of Gann Circle Swing Levels indicator. It further divides the Gann Circle into the Eighths in order to generate intraday Levels.
Introduction
This indicator is based on W. D. Gann's Square of 9 Chart and can be interpreted as the Gann Circle / Gann Wheel / 360 Degree Circle Chart or Square of the Circle Chart for intraday usage.
Spiral arrangement of numbers on the Square of 9 chart creates a very unique square root relationship amongst the numbers on the chart. If you take any number on the Square of 9 chart, take the square root of the number, then add 2 to the root and re-square it, resulting in one full 360 degree cycle (i.e. a 360 degree Circle) out from the center of the chart.
For example,
the square root of 121 = 11,
11 + 2 = 13,
and the square of 13 = 169
The number 169 is one full 360 degree cycle out (with reference to 121) from the center of the Square of 9 chart. If we further divide the circle in eight equal parts of 45 degree each, following intermediate resistance levels (ascending) would be generated:
127 (45 degree)
133 (90 degree)
139 (135 degree)
145 (180 degree)
151 (225 degree)
157 (270 degree)
163 (315 degree)
Similarly, if you take any number on the Square of 9 chart, take the square root of the number, then subtract 2 from the root and re-square it, resulting in one full 360 degree inward rotation towards the center of the chart.
For example,
the square root of 565 = 23.77,
23.77 - 2 = 21.77,
and the square of 21.77 = 473.93 (approximately equal to 474, which is directly below 565 on the Square of 9 chart)
The number 474 is one full 360 degree inward rotation (with reference to 565) towards the center of the chart. If we further divide the circle in eight equal parts of 45 degree each, following intermediate support levels (descending) would be generated:
553 (45 degree)
541 (90 degree)
529 (135 degree)
518 (180 degree)
507 (225 degree)
496 (270 degree)
485 (315 degree)
How to Use this Indicator ?
This indicator is designed to generate Gann Circle Intraday Levels based on HIGH and LOW of the opening bar for the day. You may use the bar interval (1 minute, 3 minutes, 5 minutes, 15 minutes etc.) which is suitable for the underlying instrument. Support and resistance lines for the day would be generated only after confirmation of the opening bar of the day.
Input :
Number of Gann Levels (Number of Gann Levels to be projected)
Color codes for the Support and Resistance Levels
Output :
Gann Support or Resistance Levels:
HIGH and LOW of the Opening bar for the day (dashed BLUE lines)
Support levels calculated with reference to the HIGH of the opening bar
Resistance levels calculated with reference to the LOW of the opening bar
Gann Circle Swing LevelsThis indicator is based on W. D. Gann's Square of 9 Chart and can be interpreted as the Gann Circle / Gann Wheel / 360 Degree Circle Chart or Square of the Circle Chart.
Spiral arrangement of numbers on the Square of 9 chart creates a very unique square root relationship amongst the numbers on the chart. If you take any number on the Square of 9 chart, take the square root of the number, then add 2 to the root and re-square it, resulting in one full 360 degree cycle (i.e. a 360 degree Circle) out from the center of the chart.
For example,
the square root of 121 = 11,
11 + 2 = 13,
and the square of 13 = 169
The number 169 is one full 360 degree cycle out (with reference to 121) from the center of the Square of 9 chart.
Similarly, if you take any number on the Square of 9 chart, take the square root of the number, then subtract 2 from the root and re-square it, resulting in one full 360 degree inward rotation towards the center of the chart.
For example,
the square root of 565 = 23.77,
23.77 - 2 = 21.77,
and the square of 21.77 = 473.93 (approximately equal to 474, which is directly below 565 on the Square of 9 chart)
The number 474 is one full 360 degree inward rotation (with reference to 565) towards the center of the chart.
How to Use this Indicator ?
This indicator is useful for finding coordinate squares on the Gann Circle that are making hard aspects to a previous position (such as a significant top or bottom) on the circle.
Input :
Swing Point (Significant price point, such as a top or a bottom)
Low / High ? (Is it a bottom or a top)
Number of Gann Levels (Number of Gann Cycles to be projected)
Output :
Gann Support or Resistance Levels (color coded as follows) :
Swing High or Swing Low (BLUE)
Support levels calculated with reference to the Swing High (RED)
Resistance levels calculated with reference to the Swing Low (LIME)

Gann Dynamic Square of 9Gann Dynamic Square of 9
// ========================================================================//
This script uses the same number series in the square of nine chart. Taking into considerations a high/low pivotal level of your choosing at $1/degree. It includes these degrees : ( 360, 315, 270, 225, 180, 135, 90, and 45 )
This dynamic square of 9 is different than the static one. The values always start at your low/high rather than one. All that you need to do is select and anchor your low/high and it will plot everything for you.
You will also be able to adjust the color of each line to differentiate between them.
This script also complements the Gann ToolBox that I have on my tradingview page giving you good measurement of the market and some of its volatility dates and locations in price.
// ========================================================================//
To get access to this add-on or for the full package including the toolbox you can see my information below.
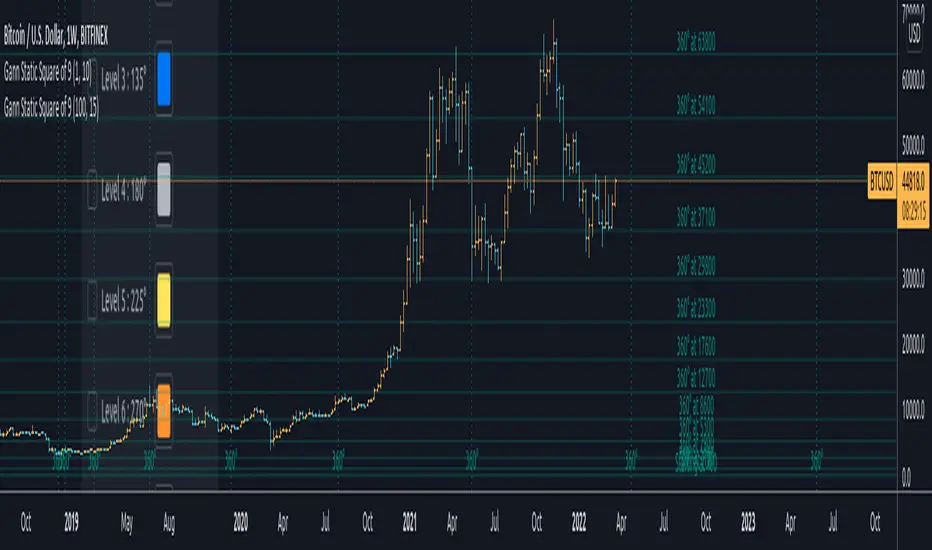
Gann Static Square of 9Gann Static Square of 9
// ========================================================================//
This script uses the same number series in the square of nine chart. It plots them according to the degree of your choosing. It includes ( 360, 315, 270, 225, 180, 135, 90, and 45 )
This static square of 9 is different than the dynamic one. The values always start at one rather than a low or a high of your choosing. All that you have to do is adjust the Price Unit and select your desired number of revolutions.
You will also be able to adjust the color of each line to differentiate between them.
This script also complements the Gann ToolBox that I have on my tradingview page giving you good measurement of the market and some of its volatility dates and locations in price.
// ========================================================================//
To get access to this add-on or for the full package including the toolbox you can see my information below.
Price Angles & Gann Star By Se7s - V2the 2nd version of the (Price Angles & Gann Star By Se7s )
An indicator to draw :-
1-price angles given the cycle start point, cycle type ( bullish / bearish ) , spacing
and shape (Circle,StrightLine,Triangle,Square,Pentagon )
shapes (Hexagon, Heptagon, Octagon, Nonagon, Decagon ) will be added later .
2-time levels .
3-Draw Price Channel .
4-Draw Gann Star .
5-Multi-time frame feature Added .
6-Fan .
you can customize all colors and text positions.
you can offset the time-levels starting point .
--------------------------
What's new in V2
- You can Calculate Angles By Averages or by the formula .
- You can draw more than one cycle (360°)
- You can type the starting date manually ( use it if the indicator is unable to find your starting point )
-You can type your first angle manually (Custom Angle)
- You can draw Gann Star on 360° or 720°
--------------------------
The script is free !!
just add it to your favorite and start using it .
your suggestions and feedback are very appreciated .

Gann Square of 9 Pivots By Dr. PWho loves Gann Square of 9? Lots of people.
Who likes calculating square of 9 and then manually putting lines on the chart? No one.
Here's a nifty little add-in that you can have draw your Gann Square of 9 pivot lines with just a little bit of configuration based on what is being traded.
Adjust the modifier value to match the price range being traded. I recommend 1 for prices 1-999, 10 for prices above 1000 (like BTC or AMZN), and .001 for Forex.
The base price from which the levels are calculated can be the high, low, hl2, etc. from the Month, Week, Day, Hour previous.
Adjust the rotation to move the levels up or down 360 degrees if the previous period's price was too high or low to put the levels on the current price.
Have fun with it, play with the settings, drop a like, or shoot me a comment for improvements/problems/questions.
Cheers!
Dr. P

Gann Square Of 9 LevelsThis script uses the last hlc3 value of 1H, 4H, D and/or W and rotates it 360º up/down with four increments of 90º to find out potential support and resistance areas. Can be used as a dynamic support & resistance tool or just to gauge how overbought/oversold the market is. Special thanks to @Nv56 for his assistance in writing this script.