BTC - AXIS: Coppock + Williams %R CompositeTitle: BTC - AXIS: Coppock + Williams %R Composite | RM
Overview & Philosophy
AXIS (Advanced X-Momentum Intensity Score) is a specialized momentum composite designed to identify market structural shifts. In physics, an axis is the central line around which a body rotates; in this indicator, the Zero-Baseline acts as the AXIS for capital flow.
By fusing a slow-moving momentum engine ( Coppock Curve ) with a high-sensitivity tactical oscillator ( Williams %R ), this tool filters out the "market noise" that leads to overtrading and focuses on the high-conviction "Trend-Aligned Dips."
Methodology
Most indicators either suffer from too much lag (Moving Averages) or too much noise (Standard RSI). AXIS solves this through "Speed-Balanced Normalization."
1. Macro Engine (Coppock Curve): Named after Edwin Coppock, this component identifies major market bottoms by smoothing two separate Rates of Change (RoC). It is your structural compass.
2. Tactical Trigger (Williams %R): Created by Larry Williams, this measures the current close relative to the High-Low range.
• Re-centered Logic: Standard Williams %R oscillates between 0 and -100. Here, this is re-centered to oscillate around zero, ensuring it interacts mathematically correctly with the Coppock baseline.
3. The AXIS Score: The Composite line (Orange) is the weighted sum of these two engines. It provides a singular view of the market's "Net Momentum Intensity."
How to Read the Chart
🟧 The AXIS Composite (Orange Line): The primary signal line. It tracks the speed and exhaustion of the price by fusing macro and tactical data.
• Red Zone (> 150): Overheated. Short and long-term momentum are at extreme highs. Risk of a blow-off top or local reversal is high.
• Green Zone (< -150): Capitulation. The market is statistically exhausted. Historically, these zones represent high-conviction accumulation areas.
• Bullish Momentum (> 0): The market is rotating above the central Axis. Buyers are in control of the trend.
• Bearish Momentum (< 0): The market is rotating below the central Axis. Sellers are in control of the trend.
🟦 The Coppock Line (Blue): The macro filter. When Blue is above 0, the long-term trend is up.
🟥 The Williams %R Line (Red): The short-term cycles. Watch for divergences here to spot early trend fatigue.
Strategy: The "AXIS Alignment" Signal
The highest-conviction entry point—and the primary "Alpha" of this tool—occurs when:
The macro trend is Bullish ( Blue Line > 0 ).
The market experiences a correction, pushing the Orange (AXIS) Line into the Green Capitulation Zone.
The AXIS Score turns back upward.
This indicates that a short-term panic has been absorbed by a long-term bull trend—the ideal "Buy the Dip" scenario.
Settings
• Long/Short RoC: Standardized to 14/11 for cycle accuracy.
• Weighting: Allows you to prioritize trend (Coppock) or cycle sensitivity (%R).
• Visibility Toggles: Fully customizable display switches for each line.
Credits
• Edwin Coppock: For the foundation of long-term recovery momentum.
• Larry Williams: For the Percent Range methodology.
⚠️ Note: This indicator is optimized for the Daily (1D) Timeframe. Please switch your chart to 1D for accurate signal reading.
Disclaimer
This script is for research and educational purposes only. Past performance does not guarantee future results.
Tags
bitcoin, btc, axis, momentum, oscillator, coppock, williams r, on-chain, valuation, cycle, Rob Maths
Pring Özel K

Kernel Regression Trend LineKTrend – Non-Repainting Kernel Regression Trend (2025 Clean Version)
Ultra-clean, powerful, and completely non-repainting trend-following tool based on advanced Kernel regression (Rational Quadratic + Gaussian blend).
How it works:
• Uses two different kernel estimates with smart lag to detect genuine trend reversals
• Plots a thick, beautifully colored trend line (teal when rising, deep red when falling)
• Places precise, locked-in Bullish Flip (green triangle below bar) and Bearish Flip (red triangle above bar) signals only on confirmed bar close – zero repaint, ever
• Optional smoothing mode for even cleaner visuals
Features
✓ 100% non-repainting signals and line
✓ Minimal lag while staying extremely responsive
✓ Clean aesthetic – perfect for BTC, ETH, stocks, forex, any timeframe
✓ Built-in alerts for Bullish & Bearish flips
✓ Fully open source (MPL 2.0)
Default settings are already battle-tested and loved by thousands:
- Lookback Window: 11
- Relative Weighting: 8.0
- Regression Level: 25
- Lag: 2
Great on 1H–Daily charts, especially crypto and indices.
Credits: Original kernel library by jdehorty, cleaned & enhanced flip logic by HighlanderOne.
Enjoy the smoothest, most reliable kernel trend tool on TradingView – completely free!

Pring Special K|a2m# 📈 Pring Special K | a2m
The **Pring Special K (PSK)** is a momentum indicator developed by **Martin Pring**, designed to capture both short-term and long-term market cycles in one oscillator.
This version includes **customizable smoothing** and **Bollinger Bands** for enhanced visualization of momentum shifts.
---
## 🏷️ Tagline
**“Multi-cycle momentum oscillator with smoothing & Bollinger Bands for trend confirmation and early reversals.”**
---
## 📄 Short Description
The Pring Special K blends **short-term and long-term ROC cycles** into one powerful momentum oscillator.
This version adds **SMA, EMA, WMA, RMA, VWMA smoothing options** and optional **Bollinger Bands**.
Use it to:
- Confirm **long-term trends**
- Spot **early reversals**
- Identify **divergences around the zero line**
---
## ⚙️ Features
✅ **Core PSK Calculation** (Martin Pring’s weighted ROC methodology)
✅ **Momentum Color-Coding** → Green (bullish) / Red (bearish)
✅ **Smoothing Options** → SMA, EMA, WMA, SMMA (RMA), VWMA
✅ **Optional Bollinger Bands** (with adjustable length & StdDev multiplier)
✅ **Zero Line Reference** for trend confirmation
---
## 🎛️ User Inputs
- **Source** → Default: `close`
- **Type** → `"None"`, `"SMA"`, `"SMA + Bollinger Bands"`, `"EMA"`, `"SMMA (RMA)"`, `"WMA"`, `"VWMA"`
- **Length** → Default: `20`
- **BB StdDev** → Default: `2.0` (active only with SMA + Bollinger Bands)
---
## 📊 How to Use
1. **Trend Identification**
- PSK rising above 0 → Long-term uptrend
- PSK falling below 0 → Long-term downtrend
2. **Momentum Shifts**
- Watch PSK crossing its **smoothing MA** for entry/exit signals.
- Bollinger Bands help spot **momentum extensions** or **contractions**.
3. **Divergences**
- Compare PSK vs. price swings to catch early **trend reversals**.
---
## 🖼️ Visual Guide
- **Green PSK Line** → Bullish momentum
- **Red PSK Line** → Bearish momentum
- **Blue Line** → Smoothing MA
- **Shaded Green Bands** → Bollinger Bands (if enabled)
- **Gray Dotted Line** → Zero momentum baseline
---


Martin Pring's Special K Backtest Pring's Special K is a cyclical indicator created by Martin Pring.
His method combines short-term, intermediate and long-term velocity
into one complete series. Useful tool for Long Term Investors
Modified for any source.
You can change long to short in the Input Settings
Please, use it only for learning or paper trading. Do not for real trading.
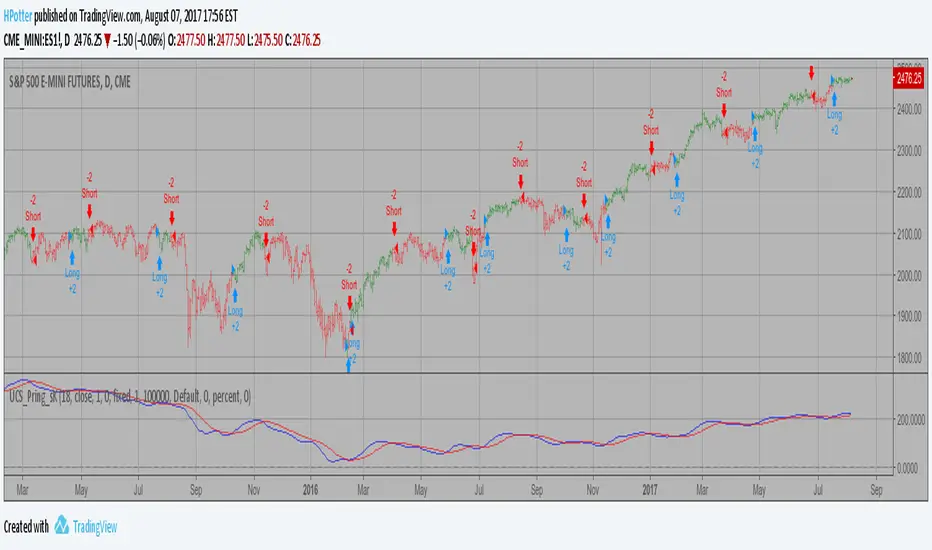
Martin Pring's Special K Strategy Pring's Special K is a cyclical indicator created by Martin Pring.
His method combines short-term, intermediate and long-term velocity
into one complete series. Useful tool for Long Term Investors
Modified for any source.

Martin Pring's Special K Pring's Special K is a cyclical indicator created by Martin Pring.
His method combines short-term, intermediate and long-term velocity
into one complete series. Useful tool for Long Term Investors
Source from:
Modified for any source.

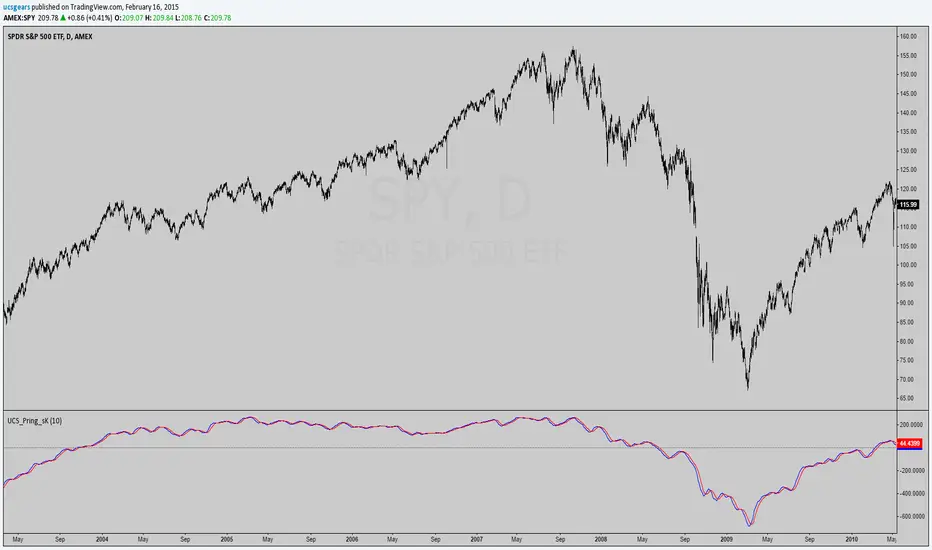
UCS_I_Martin Pring's Special KPring's Special K is a cyclical indicator created by Martin Pring. His method combines short-term, intermediate and long-term velocity into one complete series. Useful tool for Long Term Investors
Function -
1) Primary Trend Reversals at a Relatively Early Stage.
2) Timing Short term Price Moves.
This indicator is always part of my analysis indicator set on stockcharts.com, Wanted to share it here.
Primary Use is to find TOPs and BOTTOMS in a Market - Not 100% but the most reliable warning sign when the market is TIRED.
Drawback - Need at least 725 Bars to calculate this - Originally Developed by Martin Pring.
MORE INFO --------------------->>>
stockcharts.com
My Personal Goal for this Indicator is to convert this into an Overlay, with All the components (Short/Mid/Long) meaningfully plotted out. This would make this indicator far more useful in predicting the future longer term trend.