Liquidity Price Depth Chart [LuxAlgo]The Liquidity Price Depth Chart is a unique indicator inspired by the visual representation of order book depth charts, highlighting sorted prices from bullish and bearish candles located on the chart's visible range, as well as their degree of liquidity.
Note that changing the chart's visible range will recalculate the indicator.
🔶 USAGE
The indicator can be used to visualize sorted bullish/bearish prices (in descending order), with bullish prices being highlighted on the left side of the chart, and bearish prices on the right. Prices are highlighted by dots, and connected by a line.
The displacement of a line relative to the x-axis is an indicator of liquidity, with a higher displacement highlighting prices with more volume.
These can also be easily identified by only keeping the dots, visible voids can be indicative of a price associated with significant volume or of a large price movement if the displacement is more visible for the price axis. These areas could play a key role in future trends.
Additionally, the location of the bullish/bearish prices with the highest volume is highlighted with dotted lines, with the returned horizontal lines being useful as potential support/resistances.
🔹 Liquidity Clusters
Clusters of liquidity can be spotted when the Liquidity Price Depth Chart exhibits more rectangular shapes rather than "V" shapes.
The steepest segments of the shape represent periods of non-stationarity/high volatility, while zones with clustered prices highlight zones of potential liquidity clusters, that is zones where traders accumulate positions.
🔹 Liquidity Sentiment
At the bottom of each area, a percentage can be visible. This percentage aims to indicate if the traded volume is more often associated with bullish or bearish price variations.
In the chart above we can see that bullish price variations make 63.89% of the total volume in the range visible range.
🔶 SETTINGS
🔹 Bullish Elements
Bullish Price Highest Volume Location: Shows the location of the bullish price variation with the highest associated volume using one horizontal and one vertical line.
Bullish Volume %: Displays the bullish volume percentage at the bottom of the depth chart.
🔹 Bearish Elements
Bearish Price Highest Volume Location: Shows the location of the bearish price variation with the highest associated volume using one horizontal and one vertical line.
Bearish Volume %: Displays the bearish volume percentage at the bottom of the depth chart.
🔹 Misc
Volume % Box Padding: Width of the volume % boxes at the bottom of the Liquidity Price Depth Chart as a percentage of the chart visible range
SORT

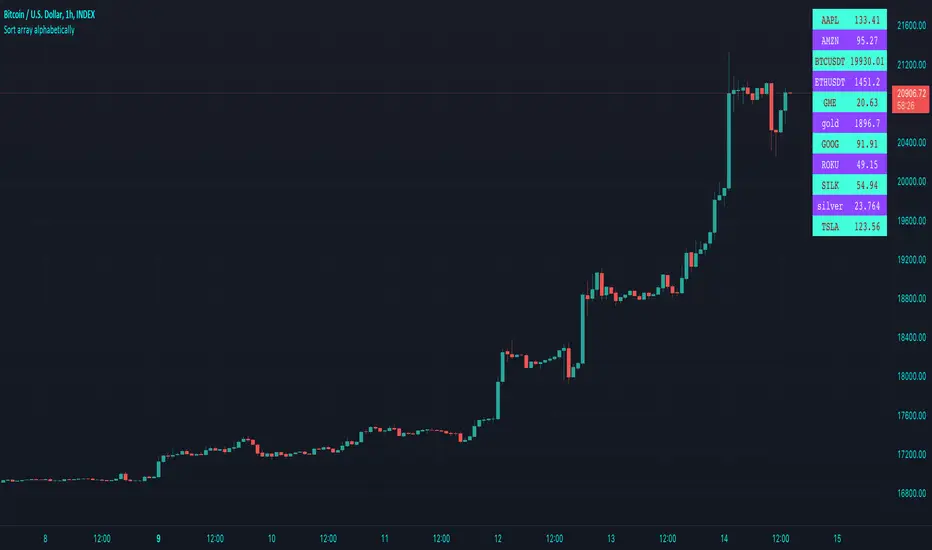
Sort array alphabetically - educational🔶 OVERVIEW
• This educational script will sort an array of tickers alphabetically and place these values in an table , together with the according current price value next to each ticker .
🔶 SORT ALPHABETICALLY
🔹 I. We make a User Defined Type (UDT) obj , with:
· ticker - the string name of the ticker
· price - the current price (close)
• From this UDT we make an object obj.new() for each ticker
🔹 II. 2 array's are made:
• array of objects aObj , containing obj type obj.new() for every ticker
• array of strings sort , the ticker part of each object obj.new()
🔹 III. Now we make an object of each ticker with the createObject(sym ) function
object_1 = createObject("TICKER")
• the object object_1 consists off:
· ticker -> "TICKER"
· price -> current Daily close through request.security("TICKER") (non-repainting)
• object_1 will be added to the aObj array
• "TICKER" ( string ticker part of object ) will be added to the sort array
🔹 IV. The latter array is sorted alphabetically by using array.sort_indices()
EXAMPLE
originalArray = array.from("B", "A", "C")
indicesArray = // sorted indices
array.get(originalArray, 1) -> "A"
array.get(originalArray, 0) -> "B"
array.get(originalArray, 2) -> "C"
IMPORTANT
Alphabetically sorting is case sensitive , just like Java compareTo(String anotherString) !
• The comparison is based on the Unicode value of each character in the string, the lowest "Dec" values are sorted first in line.
• Comparing the "Dec" values at unicodelookup explains why default CAPITAL lettres will be sorted first,
• Default you would get this (A= 65, B= 66, a= 97, b= 98)
Aa
Ba
ab
bb
• Adding str.lower(string) in the toLowerCase() function will result to the following:
Aa
ab
Ba
bb
• (A= 65 is transformed to a= 97, ...)
• As a side note, should you write "AMZN" as "ÀMZN" this would be placed at the end, even after transforming to lower case the "Dec" values are higher (À= 192, à= 224).
• You can toggle "To Lower Case" to verify.
🔹 V. Values are placed in a table , using these sorted indices.
• With the usage of UDTs and objects , the current price has the same index in the aObj as their ticker ,
giving the advantage it is fairly easy to place every value correctly next to each other.
• The same can be done by make 2 separate arrays , 1 for the current price , the other for "TICKER" .
🔶 OTHER TECHNIQUES USED
• Alternative technique for adding comment
Instead of
// this is a comment
You can also do this:
_=" this is a comment "
• Alternate colour
· During a loop , alternate colour when i is even or odd , using the modulo operation (%) .
· This is the remainder when dividing.
EXAMPLE
· 3 % 2 = 1 -> 3 / 2 -> 1 * 2, 1 left (remainder)
· 4 % 2 = 0 -> 4 / 2 -> 2 * 2, 0 left (remainder)
· 5 % 2 = 1 -> 5 / 2 -> 2 * 2, 1 left (remainder)
for i = 0 to 10
even = i % 2 == 0
col = even ? thisColor : otherColor
• Adjust colour in script by using colour picker
Cheers!
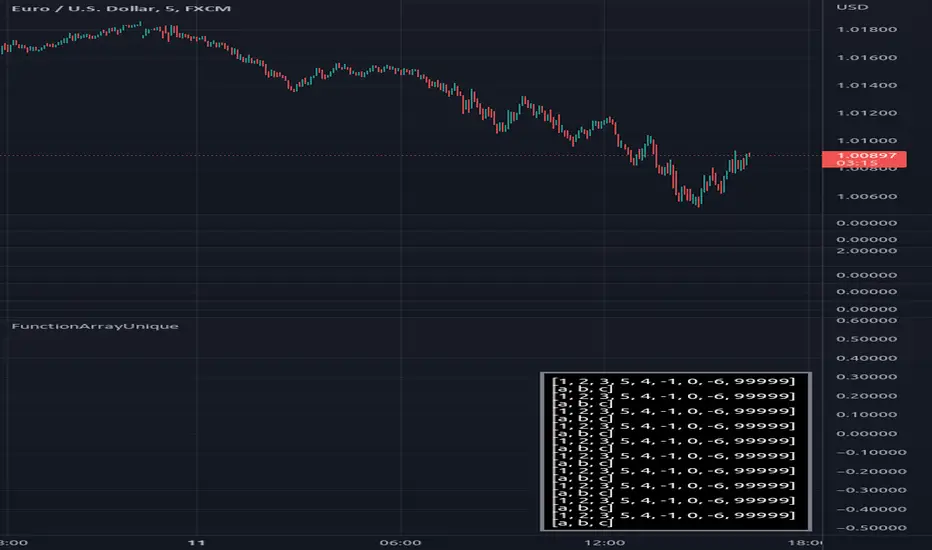
FunctionArrayUniqueLibrary "FunctionArrayUnique"
Method for retrieving the unique elements in a array.
for example would retrieve a array with ,
the elements retrieved will be sorted by its first seen index in
parent array.
note: float values have no precision option.
unique(source)
method for retrieving the unique elements in a array.
Parameters:
source : array source array to extract elements.
Returns: array unique elements in the source array.
unique(source)
method for retrieving the unique elements in a array.
Parameters:
source : array source array to extract elements.
Returns: array unique elements in the source array.
unique(source)
method for retrieving the unique elements in a array.
Parameters:
source : array source array to extract elements.
Returns: array unique elements in the source array.
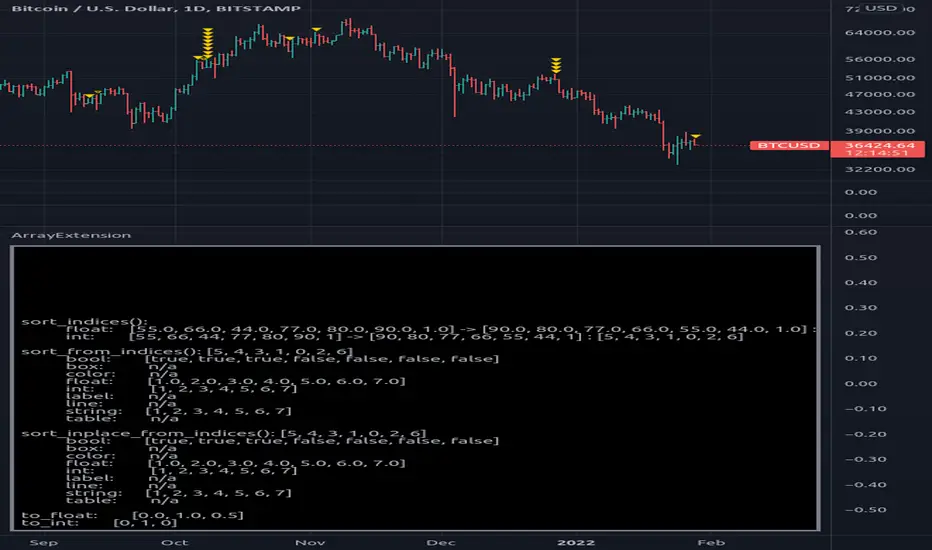
ArrayExtensionLibrary "ArrayExtension"
Functions to extend Arrays.
index_2d_to_1d(dimension_x, dimension_y, index_x, index_y) returns the flatened one dimension index of a two dimension array.
Parameters:
dimension_x : int, dimension of X.
dimension_y : int, dimension of Y.
index_x : int, index of X.
index_y : int, index of Y.
Returns: int, index in 1 dimension
index_3d_to_1d(dimension_x, dimension_y, dimension_z, index_x, index_y, index_z) returns the flatened one dimension index of a three dimension array.
Parameters:
dimension_x : int, dimension of X.
dimension_y : int, dimension of Y.
dimension_z : int, dimension of Z.
index_x : int, index of X.
index_y : int, index of Y.
index_z : int, index of Z.
Returns: int, index in 1 dimension
down_sample(sample, new_size) Down samples a array to a specified size.
Parameters:
sample : float array, array with source data.
new_size : new size of down sampled array.
Returns: float array with down sampled data.
sort_indices_float(sample, order) Sorts array and returns a extra array with sorting indices.
Parameters:
sample : float array with values to be sorted.
order : string, default='forward', options='forward', 'backward'.
Returns: _indices int array with indices.
_ordered float array with ordered values.
sort_indices_int(sample, order) Sorts array and returns a extra array with sorting indices.
Parameters:
sample : int array with values to be sorted.
order : string, default='forward', options='forward', 'backward'.
Returns: _indices int array with indices.
_ordered float array with ordered values.
sort_bool_from_indices(indices, sample) Sorts sample array using a array with indices.
Parameters:
indices : int array with positional indices.
sample : bool array with data sample to be sorted.
Returns: bool array
sort_box_from_indices(indices, sample) Sorts sample array using a array with indices.
Parameters:
indices : int array with positional indices.
sample : box array with data sample to be sorted.
Returns: box array
sort_color_from_indices(indices, sample) Sorts sample array using a array with indices.
Parameters:
indices : int array with positional indices.
sample : color array with data sample to be sorted.
Returns: color array
sort_float_from_indices(indices, sample) Sorts sample array using a array with indices.
Parameters:
indices : int array with positional indices.
sample : float array with data sample to be sorted.
Returns: float array
sort_int_from_indices(indices, sample) Sorts sample array using a array with indices.
Parameters:
indices : int array with positional indices.
sample : int array with data sample to be sorted.
Returns: int array
sort_label_from_indices(indices, sample) Sorts sample array using a array with indices.
Parameters:
indices : int array with positional indices.
sample : label array with data sample to be sorted.
Returns: label array
sort_line_from_indices(indices, sample) Sorts sample array using a array with indices.
Parameters:
indices : int array with positional indices.
sample : line array with data sample to be sorted.
Returns: line array
sort_string_from_indices(indices, sample) Sorts sample array using a array with indices.
Parameters:
indices : int array with positional indices.
sample : string array with data sample to be sorted.
Returns: string array
sort_table_from_indices(indices, sample) Sorts sample array using a array with indices.
Parameters:
indices : int array with positional indices.
sample : table array with data sample to be sorted.
Returns: table array
sort_bool_inplace_from_indices(indices, sample) Sorts sample array inplace using a array with indices.
Parameters:
indices : int array with positional indices.
sample : bool array with data sample to be sorted.
Returns: void updates sample array.
sort_box_inplace_from_indices(indices, sample) Sorts sample array inplace using a array with indices.
Parameters:
indices : int array with positional indices.
sample : box array with data sample to be sorted.
Returns: void updates sample
sort_color_inplace_from_indices(indices, sample) Sorts sample array inplace using a array with indices.
Parameters:
indices : int array with positional indices.
sample : color array with data sample to be sorted.
Returns: void updates sample
sort_float_inplace_from_indices(indices, sample) Sorts sample array inplace using a array with indices.
Parameters:
indices : int array with positional indices.
sample : float array with data sample to be sorted.
Returns: void updates sample
sort_int_inplace_from_indices(indices, sample) Sorts sample array inplace using a array with indices.
Parameters:
indices : int array with positional indices.
sample : int array with data sample to be sorted.
Returns: void updates sample
sort_label_inplace_from_indices(indices, sample) Sorts sample array inplace using a array with indices.
Parameters:
indices : int array with positional indices.
sample : label array with data sample to be sorted.
Returns: void updates sample
sort_line_inplace_from_indices(indices, sample) Sorts sample array inplace using a array with indices.
Parameters:
indices : int array with positional indices.
sample : line array with data sample to be sorted.
Returns: void updates sample
sort_string_inplace_from_indices(indices, sample) Sorts sample inplace array using a array with indices.
Parameters:
indices : int array with positional indices.
sample : string array with data sample to be sorted.
Returns: void updates sample
sort_table_inplace_from_indices(indices, sample) Sorts sample array inplace using a array with indices.
Parameters:
indices : int array with positional indices.
sample : table array with data sample to be sorted.
Returns: void updates sample
to_float(sample) Transform a integer array into a float array
Parameters:
sample : int array, sample data to transform.
Returns: float array
to_int(sample, method) Transform a float array into a int array
Parameters:
sample : float array, sample data to transform.
method : string, default="round", options= , aproximation method.
Returns: int array
Hx MTF Sorted MAs Panel with Freeze WarningThis script displays the close price and 4 sorted moving averages of your choice in a small repositionable panel and, when used on a higher timeframe, warns you when values may be different from actual values in the higher timeframe, inciting you to double check the actual values of the moving averages in the higher timeframe the panel is supposed to reflect.
The 4 moving averages and close are sorted together, providing you with a bird’s-eye view of their relative positions, the same way moving averages and last price values are displayed on the right scale.
The black header reminds of:
(1) the timeframe (resolution) used in the panel
(2) the remaining time before a new bar is created in the panel timeframe. Note that this remaining time is different from the one on the right scale, since it is only updated when a new transaction occurs.
Below, price and moving averages are sorted, color coded and followed by:
(1) a trend indicator ↗ or ↘ meaning that last change is up or down
(2) the number of bars since the moving average is above or below close (0 means current bar). This is obviously not displayed after the close price line (white background color).
Use
This panel was basically developed to display higher timeframe data but it can also be used with the same timeframe as chart for example if you do not want to plot moving averages on your chart but are still interested in their trends and relative positions vs price.
If you see something strange (like header is not black and displays NaN), it just means you requested moving averages that are not available in the panel timeframe. This may happen with newly introduced cryptos and “long” MA timeframes.
Different Timeframe
If you choose to use the panel on a different timeframe than the current one, be aware that you should only use timeframes higher than the current one, as per Tradingview recommendations.
If you select a lower timeframe than the current one, the panel timeframe header cell will turn to the alert color you set (fuchsia by default).
After tinkering for a while with the security function, I noticed that sometimes indicator values “freeze” (i.e. stop udating) and I have found no workaround.
What I mean is that when you look at a sma on a 5 minutes timeframe (the reference) and look at this same sma on a 5 minutes timeframe but from a lower timeframe through the security function set with a timeframe of 5 minutes, values returned by the security function are not always up to date and “freeze”. That’s the bad news.
Freeze warning
The better news is that this unexpected behaviour seems to be predictable, at least on minutes timeframes and I implemented an indicator that endeavors to detecting such situations. When the panel believes data may be frozen, the ‘Remaining Time’ header cell will turn to the alert color.
This feature is only implemented on minutes timeframes and can be switched on or off.
Other points of interest in this script
If you code, this function may also interest you:
sortWithIndexes (arrayToSort) returns a tuple (sortedArray, sortedIndexes) and therefore allows multi-dimensional arrays sorting without actually implementing a sorting algorithm 😉.
Default Settings
The default settings provide an example of commonly used moving averages with associated colors ranked from Hot (more nervous) to Cold (less nervous).
These settings are just an example and are NOT meant to be used as a trading system! DYOR!
Hope it will be useful.
Does the Freeze warning work for you? What do you think of my pseudo sorting algorithm?
Enjoy and please let me know what you think in the comments.


Pinescript Selection Sort Using ArraysThe selection sort algorithm sorts an array by repeatedly finding the smallest element from unsorted array and pushing it to the beginning. Two subarrays are maintained during the execution of the script. One of the subarrays is in a sorted state while the other is in a sorted state. After each iteration of the for loop the sorted list is searched for the next correct element which is then pushed onto the sorted subarray.
Worst case performance : О(n^2) comparisons and O(n)swaps
Best case performance : O(n^2) comparisons and O(n) Swaps
Average performance: О(n^2) comparisons and O(n) Swaps
Worst-case space complexity:О(n) total, O(1) auxiliary
The Pseudocode is given below
procedure selection sort
list : array of items
n : size of list
for i = 1 to n - 1
/* set current element as minimum*/
min = i
/* check the element to be minimum */
for j = i+1 to n
if list < list then
min = j;
end if
end for
/* swap the minimum element with the current element*/
if indexMin != i then
swap list and list
end if
end for
end procedure

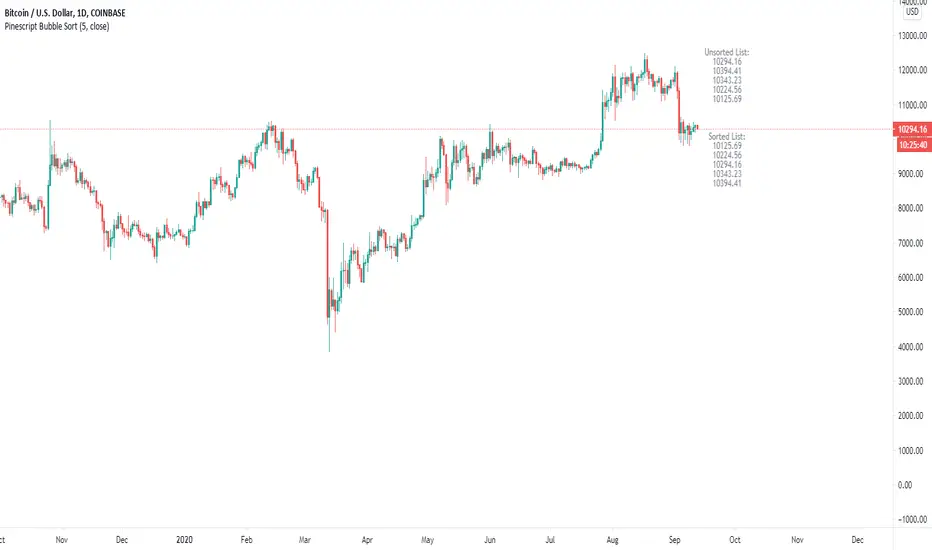
Pinescript Bubble Sort using ArraysThe new feature of arrays allows for a multitude of new possibilities within Pinescript. This script implements a bubble sort function with most probable efficiency of О(n^2) with a best-case being O(n). This sort does not require large amounts of memory to process and has advantages when sorting small lists of data.
The main advantages: Bubble sort is an in-place sorting algorithm. It does not require extra memory or even stack space like in the case of merge sort or quicksort.
The main disadvantages: In the worst case the time complexity is equal to O(n^2) which is not efficient in comparison to other sorts which can have a time complexity of O(n*logn).
The Pseudocode for a bubble sort is as follows:
begin BubbleSort(list)
for all elements of list
if list > list
swap(list , list )
end if
end for
return list
end BubbleSort
The results of the sort are plotted against the unsorted list and overlayed on the chart.
A big thanks to Alex Grover for the help.
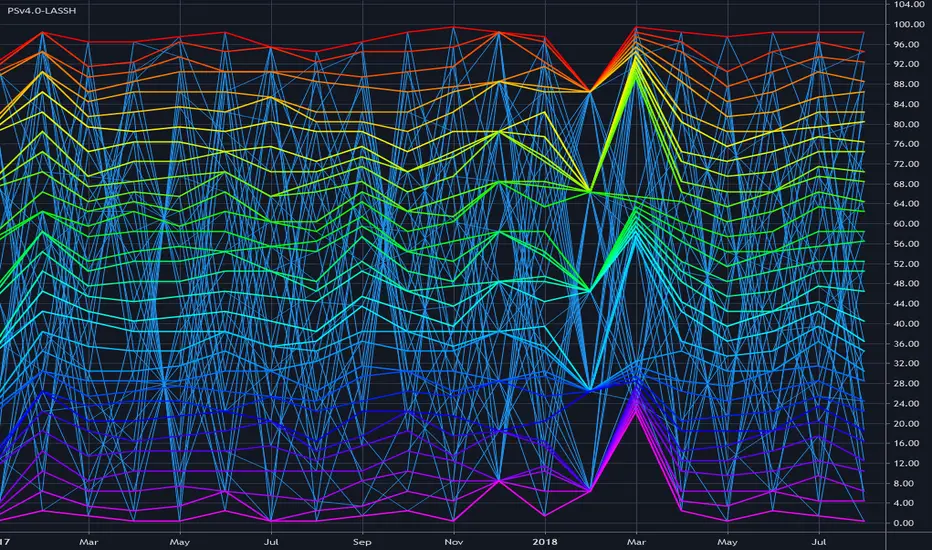
PSv4.0 Limited Array Support Super HackThis is my "PSv4.0 Limited Array Support Super Hack", derived from MichelT's Workaround for Arrays in pine and Bubble sort script, except this utilizes line.new() to obtain one array with up to 100 indices. I provided functions that may be syntactically comparable in operation to the array class we should get with PSv5.0 when that arrives. I have no clue when that ETA shall be either, so your guess is as good as mine. Due to the complexity of the script, I would ONLY recommend this script's functions for reuse by advanced Pine programmers, not newcomers to Pine Script.
Notice: FYI, support for these functions will be limited to only errata with the included functions. Honestly, I don't have an abundance of time on a daily basis to assist members with incorporation into their newly developed scripts. I hope you will understand.
The intention of this script is to provide Pine developers with one large array having up to 100 indices until we have full native array support in the future. Availability of full use of the array is only obtained when bar_index is indicesCount-1, so bear that in mind. This script is so computationally expensive, I would only advise using it "as is" on 5Y and All Charts at it's current initial release. On smaller sampling rates such as 1D, 5D and 1M... it has a tendency to encounter runtime errors such as this message: "Calculation timed out. Remove the indicator and reapply it to the chart". I just switch to a larger sampling interval - 5Y or All. I believe this is occurring due mostly to prng() generating thousands of random floating point numbers, PLUS the overhead of using line.new() for something it wasn't originally intended for. It does also use 64 plots in full color, maxing out the plotting capabilities of Pine as well. With usage of the array functions alone in your code, I anticipate those scripts to be more server friendly.
Basically this scripts functionality, as is, generates 32 pseudorandom numbers per bar in a sky blue birds nest of random numbers. It then sorts them numerically and plots them once again in a visually stunning rainbow spectrum. You will notice the plot()s colors will invert when the sorting order is changed in Settings. I commented out a lot of plot()s because we are limited to a maximum of 64 plot()s. By commenting and uncommenting with highlighted text blocks and + , you may alter the scripts appearance when done properly.
Overall, I hope you find it useful with incorporating expected array functionality that will perpetuate the novel development of next generation indicators in Pine Script version 4.0 . Once again, check out MichelT's brilliantly crafted script mentioned above. You may be able to use both scripts incorporated into an all-in-one to have dual array support, BUT I have not tested this yet, be forewarned. I hope the community contribution of this script in open source is of some benefit to those who can utilize it properly. As always, I have included advanced Pine programming techniques that conform to proper "Pine Etiquette", so this script is more than just a complex array provision...
The comments section below is solely just for commenting and other remarks, ideas, compliments, etc... regarding only this indicator, not others. When available time provides itself, I will consider your inquiries, thoughts, and concepts presented below in the comments section, should you have any questions or comments regarding this indicator. When my indicators achieve more prevalent use by TV members, I may implement more ideas when they present themselves as worthy additions. As always, "Like" it if you simply just like it with a proper thumbs up, and also return to my scripts list occasionally for additional postings. Have a profitable future everyone!
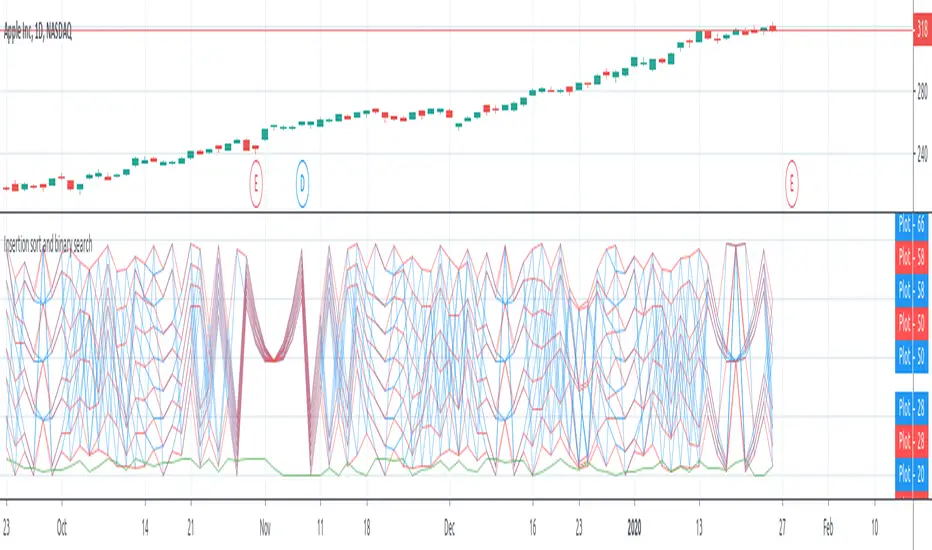
Insertion sort and binary searchThe script shows a workaround for arrays in pine-script via drawings.
There are few restrictions with them:
1. The length of the array cannot be more that amount of allowed drawings (about 40 by now)
2. Because the "array" shares the space of drawings throughout the whole script, using drawings with the "array" must be careful, with handly creating and removing of each drawing, because otherwise pine's garbage collector might break the "array"
3. Getter and Setter must be called on every bar, because of implementation of functions in pine there are inner serieses, which must be updated on every bar. So wherever you have a setter or getter in the code - it must be called on every bar. But if it's just an update, then you should pass 'false' as a param of the funtion.
The script also shows an example of implementation of Insertion sort of the array in pine: when the array have been created, it's filled with pseudo-random numbers and sorted on every bar. There are plotting of the array's numbers before/after soring to show the sorting result.
There's also an example of implementation of binary search: after generation elements of the array, the first element is kept in local variable and after sorting of the array, the scripts is looking for new element's position via binary search and then plot that new index in an array (last plotted value with the green color)
Workaround for Arrays in pine and Bubble sortThe script shows a workaround for arrays in pine-script via drawings.
There are few restrictions with them:
1. The length of the array cannot be more that amount of allowed drawings (about 40 by now)
2. Because the "array" shares the space of drawings throughout the whole script, using drawings with the "array" must be careful, with handly creating and removing of each drawing, because otherwise pine's garbage collector might break the "array"
3. Getter and Setter must be called on every bar, because of implementation of functions in pine there are inner serieses, which must be updated on every bar. So wherever you have a setter or getter in the code - it must be called on every bar. But if it's just an update, then you should pass 'false' as a param of the funtion.
The script also shows an example of implementation of bubble sort of the array in pine: when the array have been created, it's filled with pseudo-random numbers and sorted on every bar. There are plotting of the array's numbers before/after soring to show the sorting result.

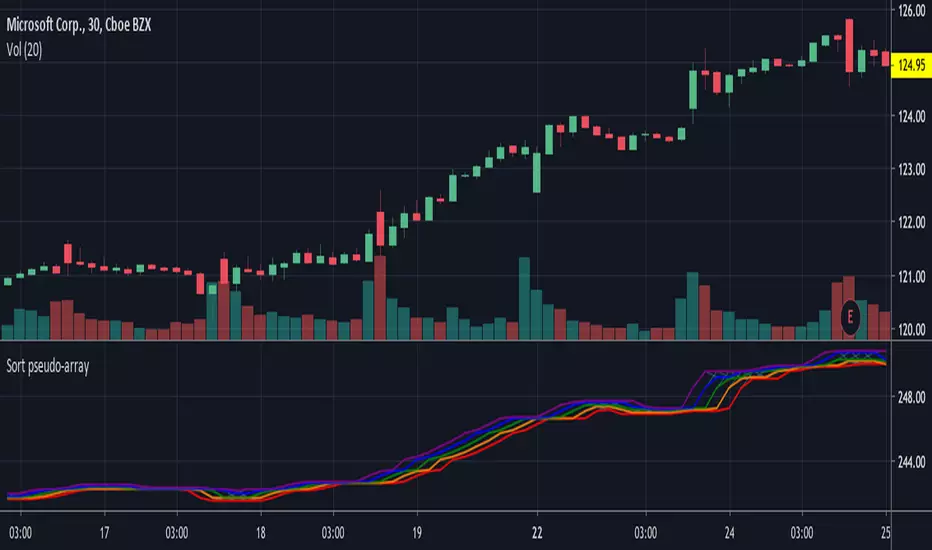
Sort pseudo-array v3Based on Sort pseudo-array v2 by apozdnyakov
- fixed issue where if the same number is repeated in the list it gets skipped
- replaced hardcoded 10000 and -10000 values with na in case those values are in the list
- added sort_all to demonstrate how to sort a list if the length is fixed