Overlay Mini Plot(s) of Correlated Asset(s)Overlay a small plot of a correlated asset of your choosing. Shrink/expand, Set vertical and horizontal position, plot multiple mini-plots via duplicate indicators with varied settings.
Plots the last X bars of any asset; including the live candle currently painting
Useful for low time frame trading when you want to see correlated asset price movement right alongside the price movement you're watching.
Useful for quick and simple comparisons; when you don't want the clutter of split screen or multi-pane view.
Useful for backtesting.
Price scale agnostic; just plots the shape of the recent price action, with several optional labels: Asset+timeframe | Live Price | Highest price over X bars | Lowest price over X bars.
Works fine with all the assets i've tested it on.
~~User inputs~~
-number of bars to paint.
-horizontal offset: plot to right X bars or to left X bars
-vertical offset: shift up or down, shrink or expand; by using 2 'spacer' inputs
-color/transparancy of candles and price labels.
-width (pixels) of candle bodies.
-choose to display price labels or not
-choose to display asset label or not
~~Tips~~
--Add several of these indicators; changing the vertical 'Shift/Shrink' settings on each to visually separate them.
--In the above chart or EurUsd, there are three indicators =>> three mini-plots overlaid: DXY, EurGbp and GbpUsd. Using the following settings for Space Above:Space Below: DXY- 0.1:4.5 | EurGbp- 1.8:1.8 | GbpUsd- 4.5:0.1
--the more you add, the more you'll have to vertically shrink the plots
© twingall
SMT

Fair Value Gap / FVG - HTF Orderflow bias / trendCalculates Fair Value Gap (FVG) as a counter and plots it below price.
FVG Counter value resets to +ve or -ve once the FVG counter reverses direction.
Use this script to find a bias to trade with.
Best used on HTF (like 1W, 1D), so the bias can be transferred to LTF (like 4H, 1H).
If you end up using this script, please leave a comment below on how you used it. I can try to incorporate those ideas in an update.
Cheers!

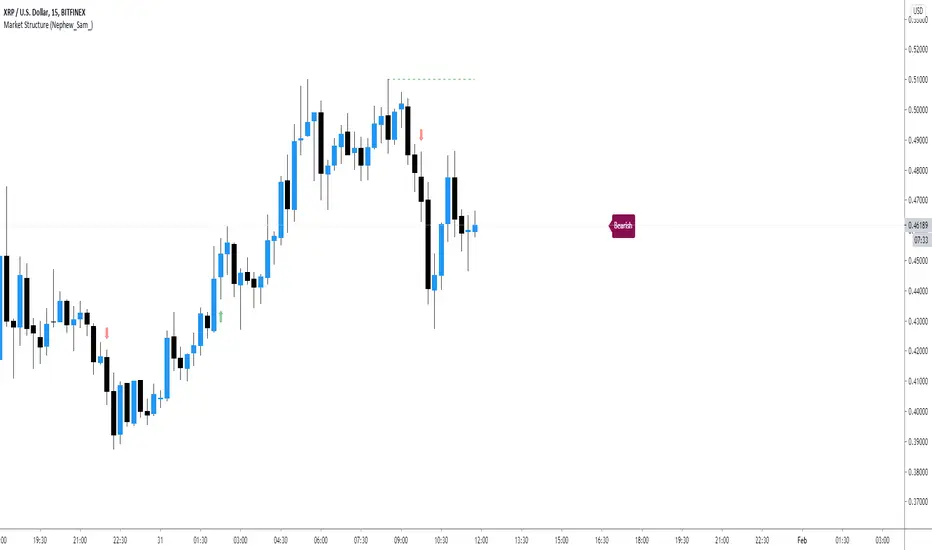
Market Structure (Nephew_Sam_)This indicator consists of 3 features:
1. Plots label to the right for current market structure
2. Plots dashed line to show where the next market structure would be
3. Draws arrows above/below historical market structure breaks
This might get a little to noisy in ranging markets or lower timeframes but it does the job.
Credits to @SimpleCryptoLife for the source code.
This script is take from the indicator "True Market Structure" which is created by the above mentioned user
Copyright rules for reusing the script:
// == COPYRIGHT ==
// Script by @SimpleCrpytoLife. This script is open-source.
// --> If you use ideas from it, you don't need to ask or give credit to me.
// --> If you copy code out of here to adapt for your own script, it must be open-source. You don't need to ask permission, just credit @SimpleCryptoLife.
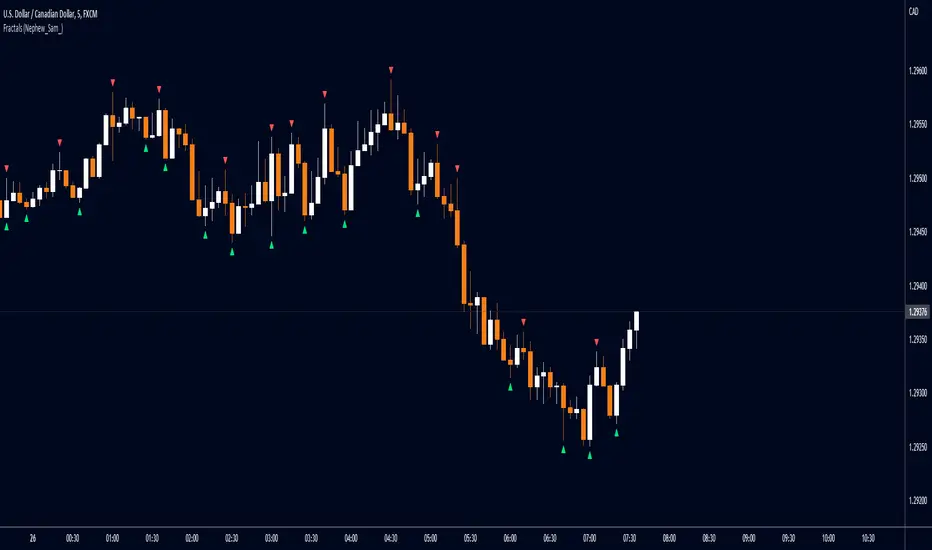
Fractals (Nephew_Sam_)Regular and Williams fractal
1. Plots 3 and 5 bar fractal point
2. Plots significant highs/lows lines
Credits to @RicardoSantos, Code taken from his open source script (V9).