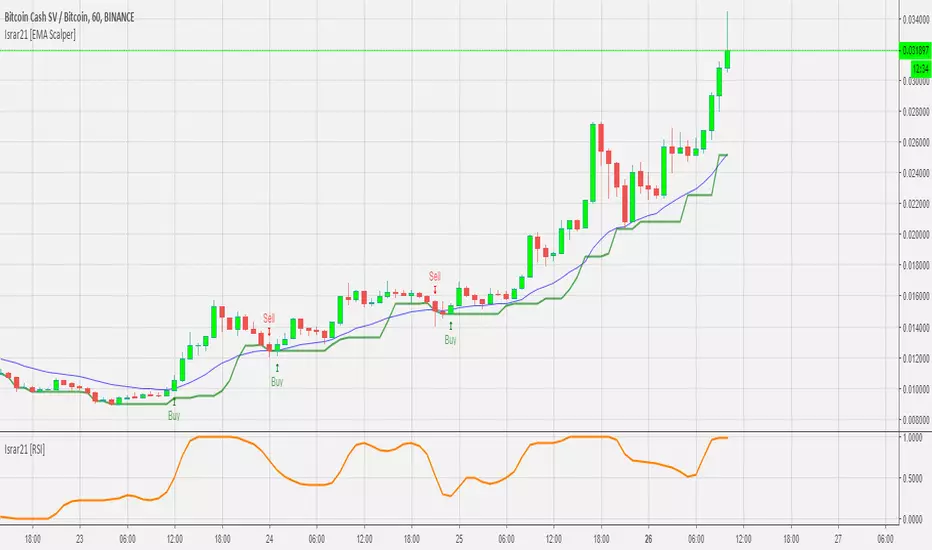
RSI EMA Alerts 15M+// Alerts based on Relative Strength Index ( RSI ) and Exponential Moving Average ( EMA ) Strategy
// Greatest effect on 15M+ time frame
// Created and based on Binance chart
// Working with comission
// No repaints
Signals

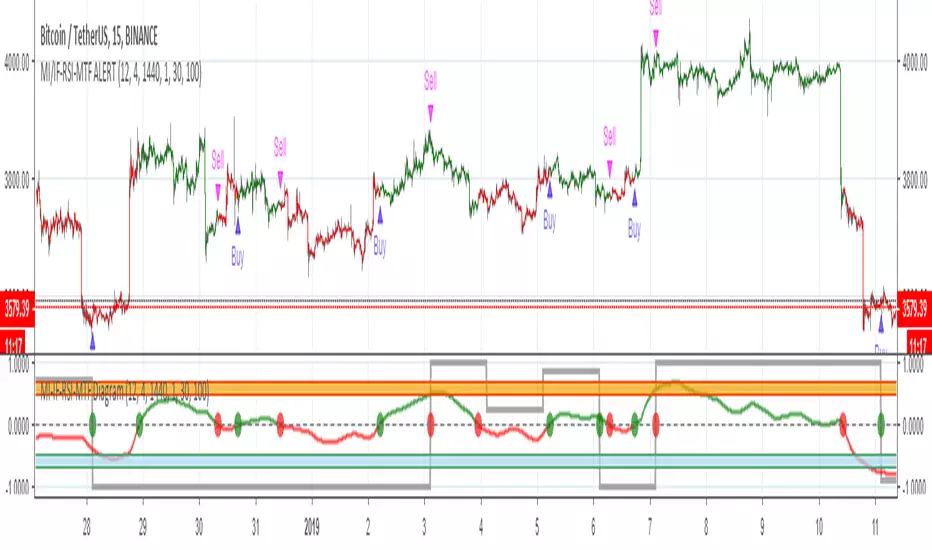
MOMENTUM INDICATOR / INVERS FISHER / RSI / MTF / ALERT// Alerts based on Momentum indicator and Inverse Fisher transform with Multi Time Frame function on Relative Strength Index (RSI)
// Greatest effect on 15M+ time frame
// Created and based on Binance chart
// Working with comission
// No repaints
Momentum Indicator Alerts 15m// Alerts based on Momentum Indicator Strategy
// Greatest effect on 15M time frame
// Created and based on Binance chart
// Working with comission
// No repaints

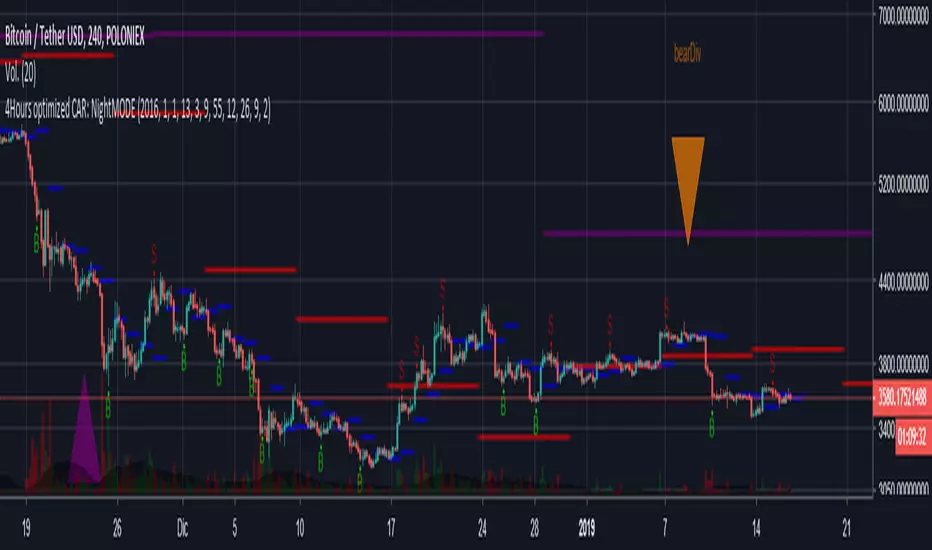
4Hours optimized CAR: NightMODEA night mode of my script.
Feel free to contact me with your suggestion, I'm working on the things people ask me more frequently.
Thanks and good profit!
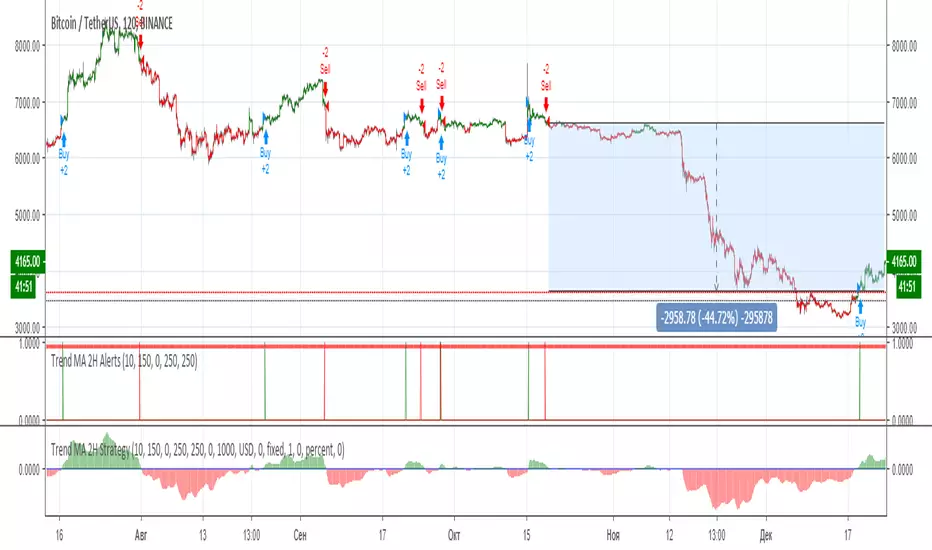
Trend MA 2H Alerts// Alerts based on the spread between the Slow and Fast Moving Average.
// Greatest effect on 2H time frame
// Created and based on Binance chart
// Working with comission
// No repaints
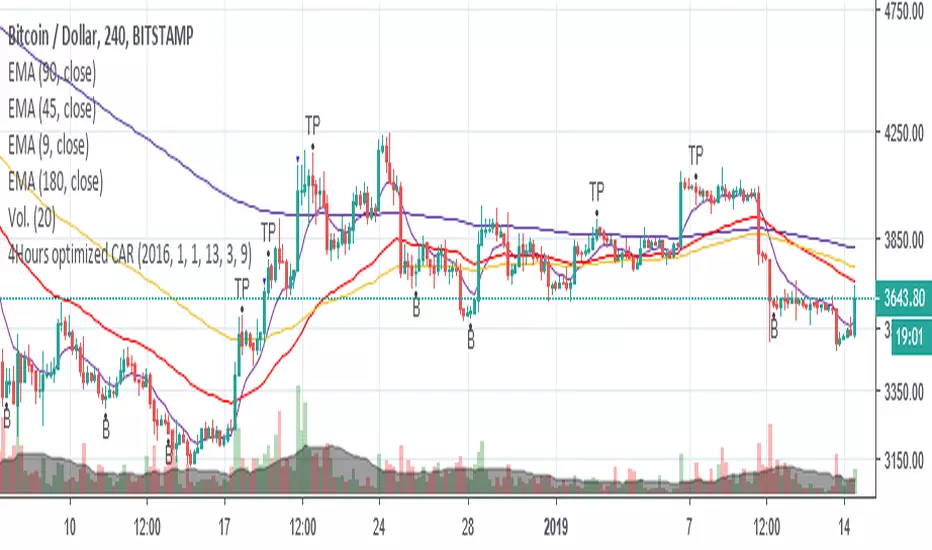
4Hours optimized CARHey!
I have been working on this script the lasts days, it's a collaboration with an uruguayan mate.
#####IMPORTANT#####
* It has been optimized for 4h charts, use it on other at your own risk.
* Always use Stop Loss, since it might give false signals after a long trend.
* I'm still working on it, I'm going to add candlestick pattern filtering.
Thanks for your support, greetings.
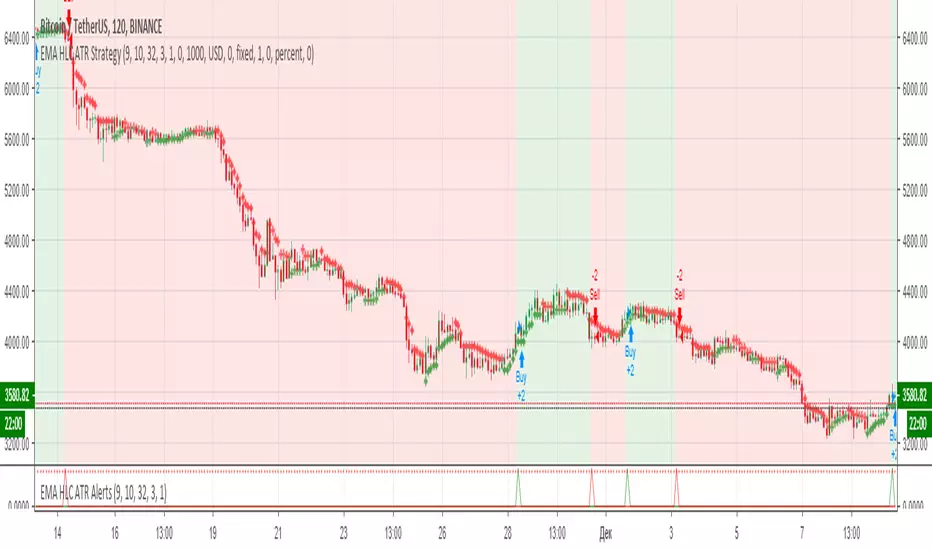
EMA HLC ATR Alerts// Alerts based on EMA HLC ATR Strategy
// Greatest effect on 2H time frame
// Created and based on Binance chart
// Working with comission
// No repaints
TrendBand NakedSame concept as Trendband Guide script, but now, we can choose any combination of moving average that suite with our own trading style.
Default setting :
Input (candle base on your timeframe)
Breakout Candle : 5 (highest)
Breakdown Candle : 10 (lowest)
Moving Average Line
EMA : default EMA, uncheck for MA
Fast Line : 10
Slow Line : 20
Direction : 50
Long Term : 200
Style
Breakout Line / Breakdown Line : Horizontal line base on breakout or breakdown setting above
Green Triangle : Potential pullback breakout
Red Triangle : Candle make new high but close lower (potential weakness)
Black Triangle : Candle make new low but close higher (potential strength)
Inside Candle : High and low current candle was smaller and within the high and low the previous candle
Background color : Red for positive / uptrend (fast line above slow line) and green for negative/downtrend (fast line below slow line)

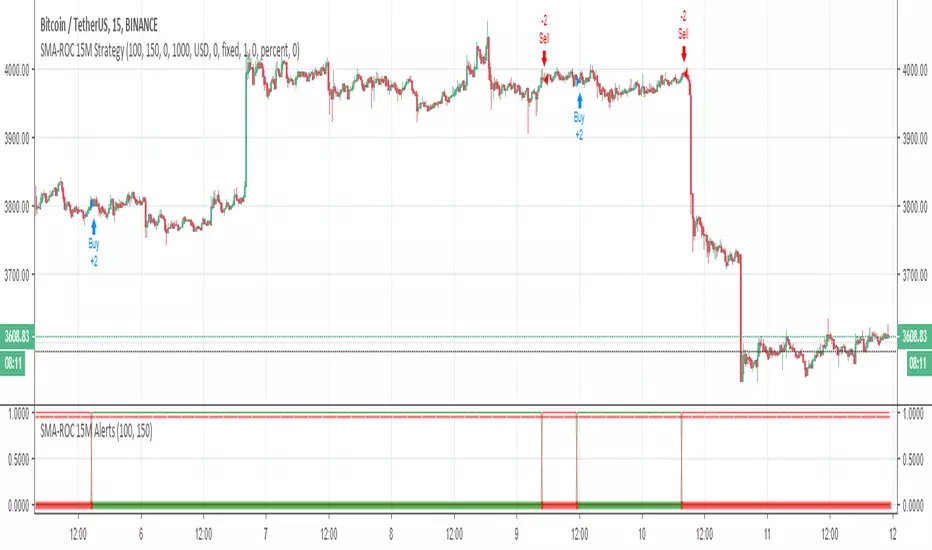
SMA-ROC 15M Alerts// Alerts based on Simple Moving Average (SMA) and Rate of Change (ROC) Strategy
// Greatest effect on 15M time frame
// Created and based on Binance chart
// Working with comission
// No repaints
2 EMA CROSSOVERS 2H ALERTS// Alerts based on 2 moving average Strategy
// Greatest effect on 2H time frame
// Created and based on Binance chart
// Working with comission
// No repaints

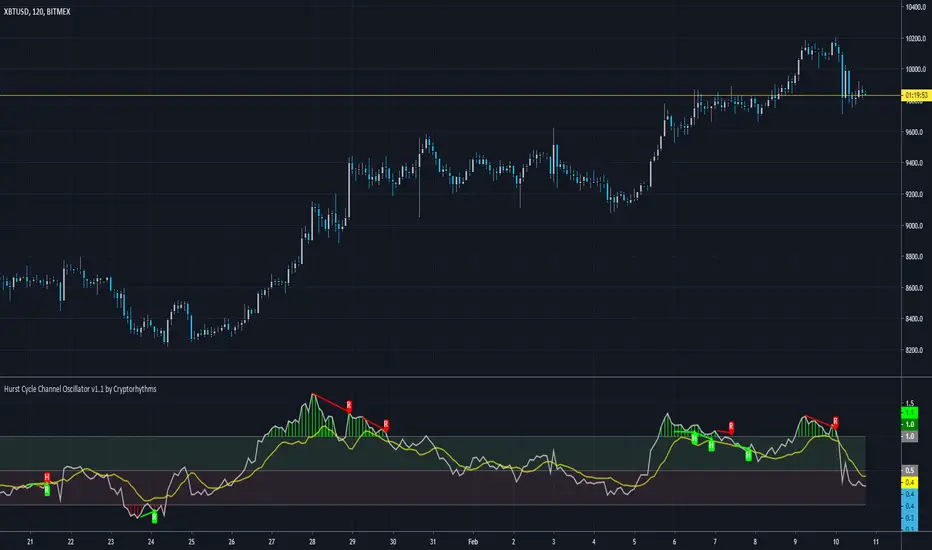
♒Hurst Cycle Channel Oscillator v1.0 by Cryptorhythms♒Hurst Cycle Channel Oscillator v1.0 by Cryptorhythms
👀 This one was not in the public library yet. Thanks to lazybear for the original Hurst Cycle Channel code, which was used to create this.
📜 Description
In the late 60's a NASA aerospace engineer J.M. Hurst published ‘The Profit Magic of Stock Transaction Timing’. Ironically, his book, by some considered the best book ever written about stock market cycles and swing trading, became available during the deepest and most extended Bear Market since the Great Depression. From 1972 on brokers couldn't give blue chip stock away in a Wall Street lunchroom. There was no market for a book by a stock market timer, and the book became a hidden treasure.
The Oscillator version of channel cycle was not on tradingview yet, so here you go, hope you all enjoy! The Hurst Channels and the Hurst Oscillator, be it combined or separate, can be implemented to uncover turning points in all time frames. Note that the Hurst Oscillator is basically just another presentation of the position of price in the Hurst Channel.
You can use it similar to an RSI looking for divergences. Also similar to a ema fast/short cross strategy when you use the signal line as entry/exit. You can also of course use the overbought/oversold zones as well.
Here is a screenshot with the example of bar coloration:
👍 Enjoying this indicator or find it useful? Please give me a like and follow! I post crypto analysis, price action strategies and free indicators regularly.
💬 Questions? Comments? Want to get access to an entire suite of proven trading indicators? Come visit us on telegram and chat, or just soak up some knowledge. We make timely posts about the market, news, and strategy everyday. Our community isn't open only to subscribers - everyone is welcome to join. t.me
Eds Bot Signaler on Basis of RSI Stoch StochRSIEDS AWESOME BOT SIGNALER
Specially for use with e.g. 3commas or autoview
But can also be used just in normal manual (visual) mode
This Script is very early Beta. Works for visual manual use....
and also for 3Commas Bot as "Signaler" (how to connect with Bot, see the docu on 3commas).
... but can use as Signaler for any Bot who is able to get Tradingview sms-mails. (e.g. autoview)
It combines RSI, Stoch and Stoch-RSI.
You can choose normal RSI, or " returning RSI " (signals when leaving the sell/buy-zone. much higher profits with this)
You can choose how many of the indicators are needed to "fire".
You can choose if one of the indicators is a "must"
For Stoch & Stoch-RSI you can Choose sma or ema calculations of the moving average.
All the Values speak for themselves, if you are used to technical analyses (stay away in the moment, if you dont know, what rsi, stoch etc is used.
The Signals are also shown in the chart, the single ones, but also the combined which fires the Bot-Signal (shown as green and red column-candle at bottom)
Enjoy !! Free use in the moment.
More detailled Explanation in the future. Just play around!
If you wanna give something back:
BTC: 15buigKjh4JYnuVwcEWiYMpYvP3Lbp4ypL

VMA Sig Cross 2H // Strategy based on Variable Moving Average. VMA automatically adjusts its smoothing constant on the basis of Market Volatility.
// Greatest profit index on 2H time frame
// Created and based on Binance chart
// Working with comission
// No repaint

NAVI'S PERFECT TSIThe NAVI'S PERFECT TSI Indicator is the same as the True Strength Index (TSI) developed by
NAVI, except the SMI includes a signal line. The SMI uses double moving averages
of price minus previous price over 2 time frames. The signal line, which is an EMA of the
SMI, is plotted to help trigger trading signals. Adjustable guides are also given to fine
tune these signals. The user may change the input (close), method (EMA), period lengths
and guide values.
You can use in the xPrice any series: Open, High, Low, Close, HL2, HLC3, OHLC4 and ect...

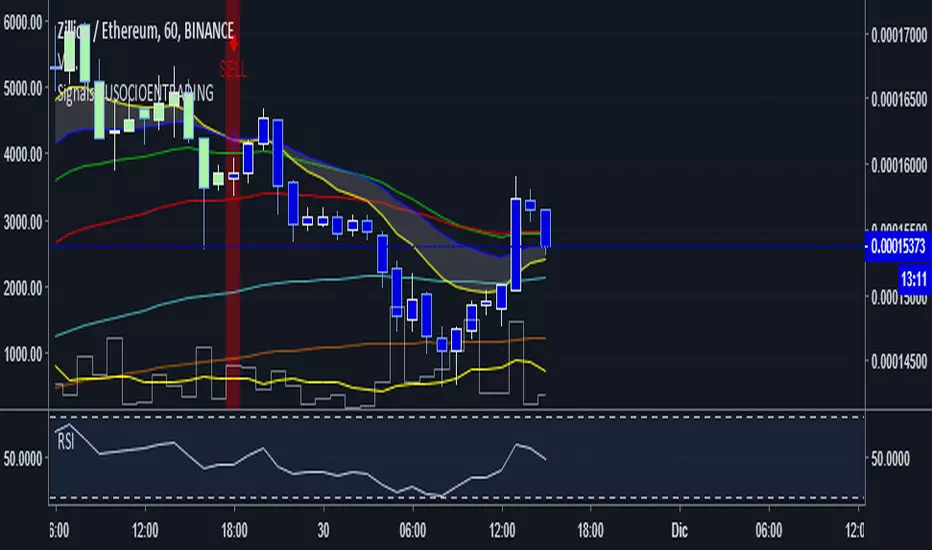
Signals-TUSOCIOENTRADINGSingnals Free Indicator, August 16, 2018.
Version 1.0
To enter Purchase (Long) When EMA10 (yellow) crosses to EMA20 from bottom to top enter LONG
To Enter Sale, (short) When the EMA10 (yellow) crosses the EMA20 from top to bottom enter SHORT
The EMA30 (Green) must be taken into account, it is the one that marks the trend If you are going to enter Largo, when the price is above If you are going to enter Short, when the price is below
Note: the other EMAS can close them this extrategía has given me greater results in 1H
The EMA50, EMA100, 200, It is to look at the long-term trend
Numeraire Market CapHello traders!
This is Market Cap chart of Numeraire cryptocurrency with some additional features.
What is included
Dynamic market capitalization chart
Customizable SMA of the market capitalization
Crossovers highlighting
Alerts for crossovers
Alert for the specified positive % change
Alert for the specified negative % change
How to get access
Buy for only 20$ to get lifetime access to this indicator
Like and follow for more cool indicators!
Happy Trading!

Waves Market CapHello traders!
This is Market Cap chart of Waves cryptocurrency with some additional features.
What is included
Dynamic market capitalization chart
Customizable SMA of the market capitalization
Crossovers highlighting
Alerts for crossovers
Alert for the specified positive % change
Alert for the specified negative % change
How to get access
Buy for only 20$ to get lifetime access to this indicator
Like and follow for more cool indicators!
Happy Trading!

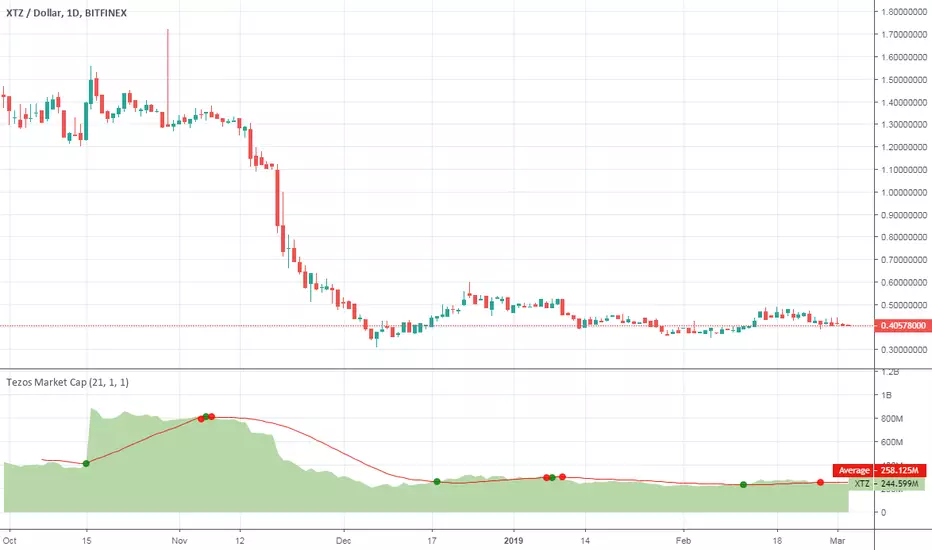
Tezos Market CapHello traders!
This is Market Cap chart of Tezos cryptocurrency with some features.
What is included
Dynamic market capitalization chart
Customizable SMA of the market capitalization
Crossovers highlighting
Alerts for crossovers
Alert for the specified positive % change
Alert for the specified negative % change
How to get access
Buy for only 20$ to get lifetime access to this indicator
Like and follow for more cool indicators!
Happy Trading!
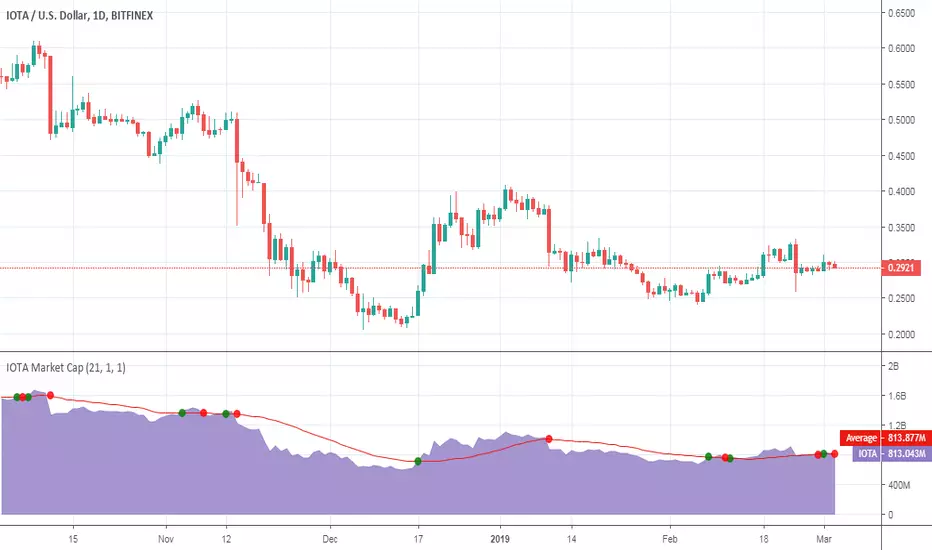
IOTA Market CapHello traders!
This is Market Cap chart of IOTA cryptocurrency with some features.
What is included
Dynamic market capitalization chart
Customizable SMA of the market capitalization
Crossovers highlighting
Alerts for crossovers
Alert for the specified positive % change
Alert for the specified negative % change
How to get access
Buy for only 20$ to get lifetime access to this indicator
Like and follow for more cool indicators!
Happy Trading!