Market Oracle Plus [ChartPrime]ChartPrime Oracle Plus combines actionable, elegant and functional indicators into a single toolkit. It builds upon previously laid out creations in order to create a more advanced experience. Combinations of both trend following and contrarian logic aim to provide traders with a deeper insight into market movements; aiming to assist in better entries and exits.
Designed and created by the ChartPrime team, this toolkit takes deeper level theory and expresses it in a usable format for traders. ChartPrime Oracle Plus is designed to satisfy and cover major trading theories allowing the user to pick and select the features that fit them.
Trend signals, Prime Ranges and Quantum Reactor
When using any indicator suite it is important to understand these tools are there to assist trading rather than to be a single source of truth. Functionality such as Auto Maximization of parameters is there to guide and enhance user experience, however it is important to be aware of overfitting results.
Plus features:
ChartPrime Market Oracle Plus has introduced some unique additions in order to enhance traders’ experiences.
Custom Signals: Toolkits and signals often limit traders to a single algorithm. This reduces flexibility and adaptability in the market. Traders will often want to develop their own systems without the constraints of an existing one. Market Oracle Plus introduces a custom signals builder; taking components in the toolkit and allowing them to be combined into a single signal/alert. Want a signal when the trend changes with bullish candlestick patterns? With a few clicks this can now be enabled. Traders can also set alerts on their custom signals making automating trades easier than ever.
Custom signals labelled with a cross
The Quantum tools. Looking at the tiny in the market and making it clearer.
Quantum Bands: The quantum bands provide areas of highly likely reversals to occur by analysing market momentum and noise. They can be used classically and are comparable in application to the commonly used bollinger bands. When price finds itself inside a zone it is more likely to reverse. This is excellent when used in confluence with other reversal indicators. The reason these bands are unique is their ability to adapt to trending markets allowing not only reversals to be identified in ranging markets but also trending ones leveraging volatility calculations. They also enable the user to use MTF functionality to load bands from higher timeframes. This allows users to have a broader perspective of support and resistance levels in the market.
The quantum bands are powerful for scalpers who want faster entries and exits. Entering a trade on a bands extremity can give earlier entries and exiting on the touch of the opposing band can serve as a great take profit.
Quantum Bands bounce
Quantum Reactor: The quantum reactor is a custom weighted moving average analyzing trends in the market. Unlike another moving averages; weighting has been considered to account for ranging markets. The Reactor will turn gray in a ranging market to avoid chop allowing for filtering of trades. This offers a unique insight into price action. Classical moving averages will constantly attempt to re-adapt to a trend whereas the Reactor will avoid adaptation where it sees fit.
Filtering a ranging market
Features included & Use cases:
Signal Mode: Select the type of assistive signals you are requiring. Provided are both trend following signals with self optimization using backtest results as well as reversal signals, aiming to provide real time tops and bottoms in markets. Both these signal modes can be fine tuned using the tuning input to refine signals to a trader's liking. The ChartPrime Auto Maximizer will automatically apply a backtested parameter and display the "best performing signals" on your chart. It is important to note this is not indicative of future results. ChartPrime Trend Signals leverage audio engineering inspired techniques and low-pass filters in order to achieve and attempt to produce lower lag response times and therefore is designed to have a uniqueness when compared to more classical trend following approaches.
Candle Highlighting: Choose between a clean gradient or more classical red/green coloring. These color the candles to assist with trend identification.
ChartPrime Dashboard: This redesigned dashboard provides 4 simple to interpret metrics. Firstly, the Optimal Tuning box provides a backtested result giving you the most accurate input. Again, it is important to note this is not indicative of future results. A Prime Score is also provided. This metric is a collection of ChartPrime trend following indicators bundled into a single item. It ranges from 0 (being a very bearish trend) to 10 (being a very bullish trend). 5 would indicate a ranging market. A consolidation score is also provided showing how "ranging" the market is. 10 being a low volatility and consolidating market and 0 being a more volatile and trending market which can assist the trader in avoiding ranges (if undesired). Finally the market prophecy gives simple forecasts in text form giving outlooks on potential activity.
The unique bar based visualization makes it clearer than ever to quantify key metrics on your chart.
Additional Features:
The Dynamic Reactor provides a simple band passing through the chart. This can provide assistance in support and resistance locations as well as identifying the trend direction expressed via green and red colors. Taking a moving average and applying unique low lag adaptivity calculations gives this plot a unique and fast behavior. This gives a unique edge to standard high length moving averages.
The Prime Ranges provide VWAP inspired real time actionable ranges on your chart. These ranges provide support and resistance levels as well as coloring, once again, there to aid trend identification. By generating a distribution and projecting it we produce real time levels for traders.
Candlestick structures analyze candlestick formation putting a spin on classical candlestick patterns and provide the most relevant formations on the chart. These are not classical and are filtered by further analyzing market activity. A trader's classic with a spin.
The Prime Trend Assistant provides a trend following dynamic support and resistance level. This makes it perfect to use in confluence or as a filter for other supporting indicators. This is an adaptive trend following system designed to handle volatility leveraging filter kernels as opposed to low pass filters.
Settings:
Signal Mode: Drop down to select the types of signals wanted
Tuning: Integer input to adjust signal's responsiveness. Lower inputs result in more frequent signals being produced.
Auto Maximizer Toggle: Automatically apply a backtested parameter to the signals
Dashboard Size: Drop down to select the size of the dashboard
Dashboard Position: Change the location of the dashboard on your chart
Additional Features: A set of toggles turning on/off these indicators.
Example Usecases:
Trend based confluences:
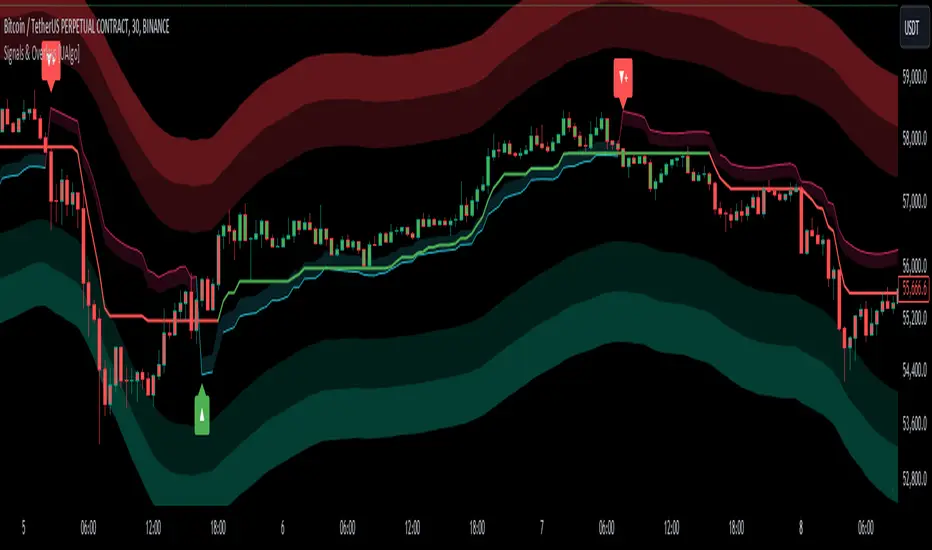
ChartPrime Oracle Plus provides classical (all be-it self optimizing) trend based signals. When trading, taking into consideration other forms of confluences are crucial. Take the image below:
Here we see the quantum reactor being green suggesting the market was in an upwards trend. We then see a sell signal appear. Knowing that we were in a macro uptrend allows us to filter out signals that go against this. Albeit basic; understanding multi-level confluence is key.
Features such as the Prime Ranges have duplicate usecases whereby a trend can be identified via the color of the bands as well as providing TP/SL levels. Considering these assisting features is vital before entering a trade.
Contrarian trading methodologies:
Commonly; trading with a trending market is most well known. However; markets are just as susceptible to ranging behaviors. ChartPrime has designed this toolkit to cater to most market conditions. For example, finding confluence between reversal indicators such as our contrarian signals and the Quantum Band can provide for some very strong confluence that can help a trader attempt to enter at bottoms of retracements and achieve the best possible entries or exits.
Developing confluences as shown above can be key to a trader's success. It is important to avoid biases when looking at indicators and view the market as objectively as possible.
ChartPrime believes that there is no magic indicator that is able to print money. Indicator toolkits provide value via their convenience, adaptability and uniqueness. Combining these items can help a trader make more educated; less messy, more planned trades and in turn hopefully help them succeed.
Risk Disclaimer
All content and developments created by ChartPrime are purely for informational & educational purposes only. Past performance does not guarantee future results. Suggested usecases are theoretical.
Ücretli komut dosyası