USS SMC Basic + MagicBoxThis is the indicator which carries 2 different functionality in 1 indicator, basic but important factor of "Smart Money Concept" and "Sideway Detection" with additional features, which is rare to find.
Let's talk about Smart Money Concept (SMC) first.
For SMC, I have enabled BoS & CHoCH detection not only for current chart timeframe but also for higher timeframe simultaneously. You can choose higher timeframe according to you taste. For e.g. if you are trading on 15m and also want to check BoS & CHoCH structure on 1H time frame, you can do it by selecting 1 Hour for HTF Timeframe in INPUTS section. If you want you can enable/disable HTF structure for BoS & CHoCH. You can even customise colors. So all parameters are fully customizable. So with the help of this indicator you don't have to put efforts to identify market structure.
Now let's discuss about MagicBox (Sideways Detection) .
It will draw a rectangle box whenever Sideway market appear. So you don't have to put hard efforts to identify sideway market. This indicator do it for you automatically. Up/Down both breakout from Box is displayed by different colored candle to notice easily. Whenever there will be a successful retest of the box, candle will get displayed with Yellow color. You can choose color of your choice for all three candles (Up Break, Down Break & Retest Candle). Candles will always take the reference of most recent rectangle box.
I hope you will enjoy it.
Sidewayconsolidation

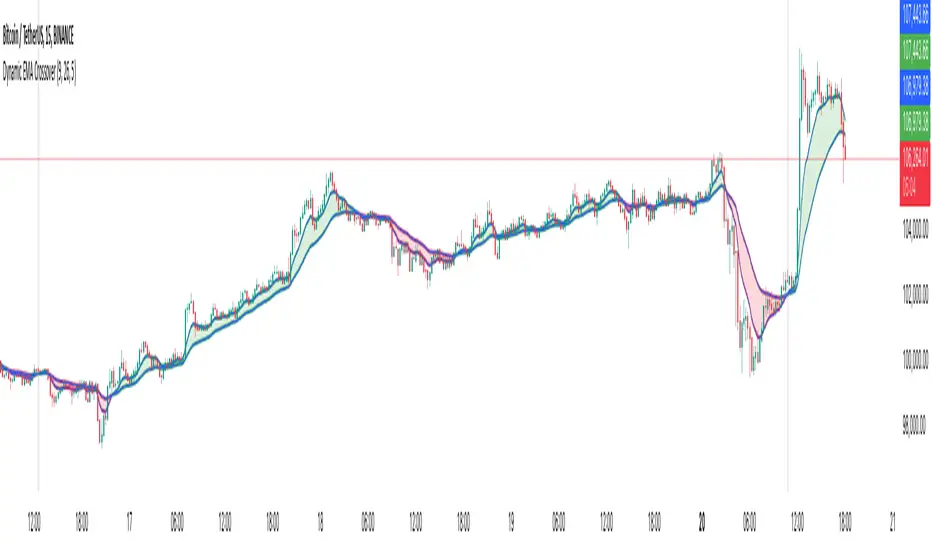
Dynamic EMA CrossoverThe Dynamic EMA Crossover indicator is designed to help traders identify trend transitions, visually understand market direction, and detect sideways consolidation zones. It simplifies decision-making by dynamically changing colors and highlighting areas of interest.
Key Features:
1. Dynamic EMA Crossovers:
• Uses two EMAs (default: 9 and 26 ) to identify bullish and bearish trends.
• EMAs and the area between them turn green during bullish trends and red during bearish trends for easy visualization.
2. Sideways Market Detection:
• Automatically detects periods of market consolidation when EMAs overlap for 10 consecutive candles and the price movement remains narrow.
• Sideways zones are highlighted with grey background, helping traders avoid false breakouts and trendless markets.
3. Customizable Inputs:
• Adjust the lengths of the two EMAs and the sensitivity of the overlap detection to match your trading style and market conditions.
How It Works:
• Trend Identification:
• When the shorter EMA crosses above the longer EMA, a bullish trend is indicated.
• When the shorter EMA crosses below the longer EMA, a bearish trend is indicated.
• The indicator dynamically adjusts the colors of the EMAs and fills the area between them for clear trend visibility.
• Sideways Market Detection:
• When the shorter EMA and longer EMA stay close (within a customizable sensitivity) for a fixed period (hardcoded to 10 candles), the indicator identifies a sideways market.
• This feature helps traders avoid entering trades during choppy or indecisive market conditions.
Who Is This For?
This indicator is ideal for:
• Trend traders looking for clear signals of trend direction.
• Swing traders who want to avoid trading in sideways markets.
• Scalpers who need quick and reliable visual cues for short-term market behavior.
Use Cases:
1. Bullish/Bearish Trends:
• Enter trades in the direction of the trend as the crossover occurs and colors change.
2. Sideways Zones:
• Avoid trades during periods of consolidation and wait for a clear breakout.
Mashup Logic:
This indicator combines:
1. EMA Crossovers:
• A tried-and-tested method for trend detection using two moving averages.
• Dynamic visual cues for bullish and bearish market phases.
2. Sideways Market Detection:
• Innovative logic to highlight sideways zones based on EMA overlap and price range analysis.
• Helps reduce noise and avoid trading during trendless periods.
3. Customization and Flexibility:
• Fully adjustable EMA lengths and overlap sensitivity to adapt to different markets and trading styles.
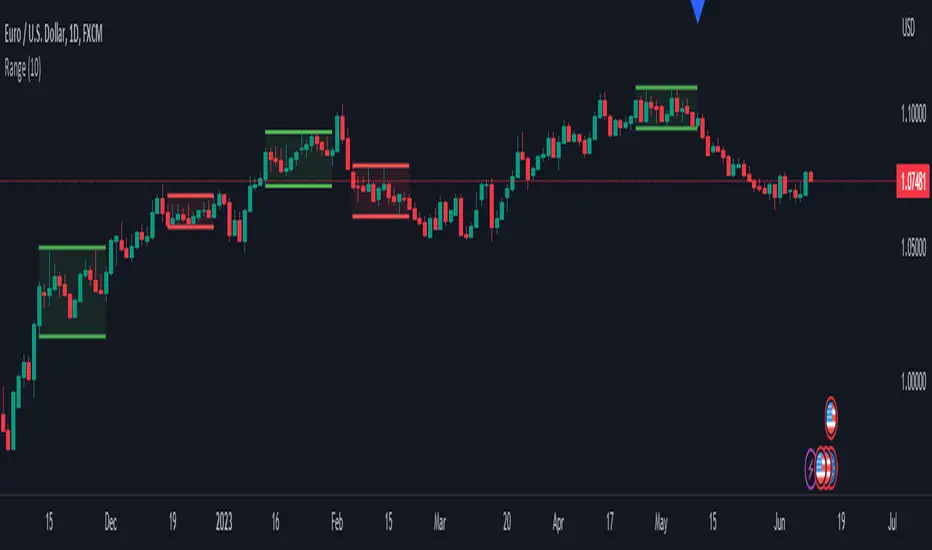
Range DetectionThis is a simple indicator to find the sideways market or ranging market.
It is mainly focused on BTCUSD as BTCUSD doesn’t make big moves each and every candle. It makes big breakouts with one candle and then goes sideways for a longer period of time.
So, this indicator identifies those big candles and plots high and lows of those big candles using lines. New range is created only when new candles close above or below previous major candles high or low.