Position Sizer (Share Qty)
This indicator enables fast & accurate position sizing for traders using (user defined) fixed dollar risk, eliminating the need for manual calculations and supporting disciplined risk management directly on the chart
Calculates precise share quantity for fixed-risk trades using the formula Shares = Risk Amount / (Current Price – Stop Price), rounded to the nearest whole share, updating in real time on every bar
Offers two dynamic stop-loss options: Low of Day (LoD) — tracked only during Regular Trading Hours (9:30 AM – 4:00 PM ET) with automatic daily reset — or Low of Week (LoW) via weekly timeframe data
Displays all critical trade data in a clean, customizable on-screen table showing: Risk Amount, Stop Loss type (LoD/LoW), Stop Price, and calculated Shares Qty
Allows full table placement control with four corner positions with optional Top Offset and Bottom Offset (0–20 blank rows each) to prevent overlap with price action or other indicators
Provides complete visual styling control for header text/background, value text/background, and share quantity text/background
Ensures efficient rendering by recreating the table only when position, row count, or layout changes, deleting the prior instance to avoid flicker or memory issues
Handles edge cases safely: shows 0 shares if stop is 'na' or above current price, and initializes LoD only on the first RTH bar of each session
For use on equities only (table will not display on futures instruments)
--
Future improvements:
Visual Stop Loss line for either LoD or LoW
Functionality and toggle to include Extended hours (PM /AH) for LoD stop pricing
Share

Volume Share
It represents the ratio of the trading volume of several major exchanges.
If abnormal transactions occur on a particular exchange, it can be intuitively detected.
The list of exchanges can be changed freely,
It is also possible to set whether to reflect it in the total amount as a reference.
It would be better to use it to reduce uncertain variables for healthy trading rather than unscientific signals.

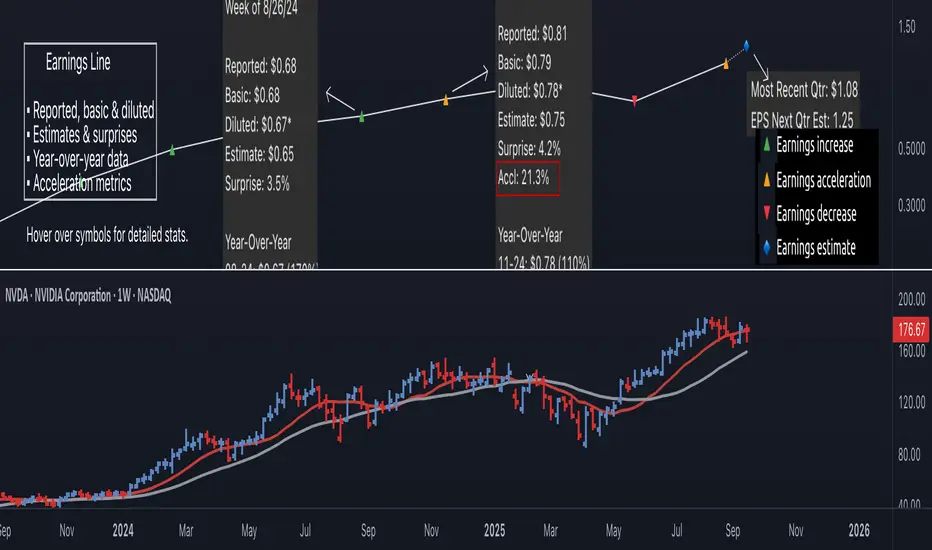
Earnings Line Pro - EPS Tracker [LevelUp]Earnings Line Pro plots quarterly earnings data, including earnings surprises and estimates, while also highlighting earnings acceleration. It allows you to track and visualize the trend of earnings across daily, weekly, and monthly timeframes.
🔹—— Key Features ——🔹
▪ Quarterly earnings per share, surprises and estimates.
▪ View earnings based on type: reported (non-GAAP), basic or diluted.
▪ Visualize the estimated trajectory of the next quarter earnings estimate.
▪ Year-Over-Year (YOY) data is included for each quarterly earnings summary.
▪ Visualize earnings acceleration, quarter over quarter.
▪ Plot on daily, weekly and monthly timeframes.
🔹—— Earnings Data ——🔹
Earnings are a foundational concept in stock analysis, often exerting a significant influence on a company's long-term performance. By visualizing earnings data as a plot rather than just a table of statistics, investors can more easily spot patterns of acceleration or deceleration. For instance, a steep upward slope between earnings releases — or a sequence of progressively higher earnings — signals a robust earnings trajectory. The sharper the acceleration, the greater the likelihood that the stock will outperform the broader market.
Historical studies show that top-performing companies consistently deliver steady earnings growth. Whether your focus is short-term trading or long-term investing, recognizing the direction and rate of earnings growth is essential for evaluating potential price movement.
While quarterly earnings data remains consistent across all timeframes, the perspective shifts depending on your goals. A monthly chart highlights multi-year growth and is ideal for investors with a buy-and-hold mindset. In contrast, weekly or daily charts have fewer data points, making them better suited for traders focused on positions lasting weeks or months.
🔹—— Choose Earnings Type ——🔹
With the Earnings Line indicator, you can view reported (non-GAAP), basic and/or diluted earnings.
▪ Reported (non-GAAP) earnings typically refer to a company’s net income as disclosed in its financial statements. This figure represents overall profitability after accounting for all expenses, taxes, and adjustments.
▪ Basic earnings per share (EPS) is calculated by dividing net income by the weighted average number of common shares outstanding during the reporting period. It provides a straightforward measure of earnings attributable to each existing share.
▪ Diluted earnings per share (EPS) goes a step further by incorporating the potential impact of additional shares from convertible securities, stock options, or warrants. This presents a more conservative, “what-if” scenario that assumes all possible dilution has occurred.
Reviewing these various types is important as they provide a bigger picture view of company performance: reported earnings show overall profitability, basic EPS reflects earnings per existing share, and diluted EPS highlights the potential impact of share dilution.
In the Settings dialog, select your preference on the earnings type. Check the box "Show Data For All Earnings Types" to view all types when hovering over an earnings data point.
🔹—— Year-Over-Year Data ——🔹
Viewing year-over-year (YOY) data for earnings is essential because it provides a clear picture of a company's growth trajectory by comparing current earnings to the same period in the prior year, helping to identify sustainable trends rather than short-term anomalies.
This metric helps eliminate seasonal fluctuations, offering a more accurate assessment of operational performance and efficiency improvements over time. Additionally, consistent YOY earnings growth can signal a company's competitive strength and potential for stock price appreciation, aiding in informed investment decisions.
🔹—— Earnings Acceleration ——🔹
Looking for earnings acceleration — where the rate of earnings growth is increasing — helps identify companies with strengthening momentum. This often reflects improving business operations, market expansion, or competitive advantages that can drive outsized returns. Viewing acceleration data can help you spot potential leaders early while avoiding stocks with flat or slowing earnings that may underperform the market.
🔹—— Visualize Earnings Estimate ——🔹
At a glance, view the next-quarter estimate to gauge the likely direction of the earnings trend. These forward-looking insights provide an early view of a company’s expected financial performance and can help anticipate potential stock price movements depending on whether actual results meet, exceed, or miss expectations.
The estimates — often based on analyst consensus — reflect market sentiment and can highlight both growth opportunities and risks.
🔹—— Plot Earnings Line On Main Chart ——🔹
By default, earnings data is plotted in a separate pane below the main chart. Follow the steps below to plot the earnings line on the main chart.
▪ Click on the indicator name on left side of the chart.
▪ Select the "..." option.
▪ Use the "Move-to" option to change the location of the earnings line.
▪ To hide the EPS scale on the left, select the "..." option.
▪ In "Pin to scale" select the "No scale (fullscreen)" option.
🔹—— Best Practices ——🔹
▪ Compare year-over-year, not just quarter-over-quarter as YOY changes help filter out seasonality.
▪ Positive surprises can spark strong price reactions, recurring surprises strengthen confidence.
▪ Look for divergence. If earnings accelerate but price lags, it may signal an early opportunity.
▪ Review daily, weekly, and quarterly charts to align short and long-term trends.
▪ Combine fundamentals with technicals, including volume analysis.
▪ Always define risk before entering a trade — know where you’ll exit.
▪ Size positions based on volatility and conviction, not emotion.
▪ Be patient — trends take time to develop.
Ücretli komut dosyası
The Z-score The Z-score, also known as the standard score, is a statistical measurement that describes a value's relationship to the mean of a group of values. It's measured in terms of standard deviations from the mean. If a Z-score is 0, it indicates that the data point's score is identical to the mean score. Z-scores may be positive or negative, with a positive value indicating the score is above the mean and a negative score indicating it is below the mean.
The concept of Z-score was introduced by statistician Carl Friedrich Gauss as part of his "method of the least squares," which was an important step in the development of the normal distribution and Z-score tables. It's a key concept in statistics and is used in various statistical tests.
In financial analysis, Z-scores are used to determine whether a data point is usual or unusual. You can think of it as a measure of how many standard deviations an element is from the mean. For instance, a Z-score of 1.0 would denote a value that is one standard deviation from the mean. Z-scores are also used to predict probabilities, with Z-scores having a distribution that is expected to be normal.
In trading, a Z-score is used to determine how often a trading system may produce a string of winners or losers. It can help a trader to understand whether the losses or profits they see are something that the system would most likely produce, or if it's a once in a blue moon situation. This helps traders make decisions about when to start or stop a system.
I just wanted to play a bit with the Z-score I guess.
Feel free to share your findings if you discover additional applications for this strategy or identify timeframes where it appears to perform more optimally.
How it works:
This strategy is based on a statistical concept called Z-score, which measures the number of standard deviations a data point is from the mean. In other words, it helps determine how unusual or usual a data point is.
In the context of this strategy, Z-score is applied to a 10-period EMA (Exponential Moving Average) of Heikin-Ashi candlestick close prices. The Z-score is calculated over a look-back period of 25 bars.
The EMA of the Z-score is then calculated over a 20-bar period, and the upper and lower thresholds (bounds for buy and sell signals) are defined using the 90th and 10th percentiles of this EMA score.
Long positions are taken when the Z-score crosses above the lower threshold or crosses above the mid-line (50th percentile). An additional long entry is made when the Z-score crosses above the highest value the EMA has been in the past 100 periods.
Short positions are initiated when the EMA crosses below the upper threshold, lower threshold or the highest value the EMA has been in the past 100 periods.
Positions are closed when opposing entry conditions are met, for example, a long position is closed when the short entry condition is true, and vice versa.
Set your desired start date for the strategy. This can be modified in the timestamp("YYYY MM DD") function at the top of the script.
