LucciThis indicator identifies trade setups based on session liquidity levels and price structure analysis during New York trading sessions.
Unlike basic support/resistance indicators, this system tracks untested session extremes and monitors their interaction with price. It combines break-and-retest mechanics with bounce detection at key liquidity zones, providing multiple entry methodologies within a single framework.
METHODOLOGY:
The system maps high/low points from each trading session (Asia: 6PM-3AM, London: 3AM-8AM, NY: 8AM-5PM EST) and monitors price behavior around these levels. It identifies two primary setup types: momentum continuation after level breaks and reversal bounces at untested extremes. Visual differentiation shows which levels remain untested (darker) versus swept levels (lighter).
SETUP IDENTIFICATION:
Break & Retest Signals:
- Detects breaks of NY Open range (15-minute candle at 8:00 AM EST)
- Waits minimum bars after break before validating retest
- Triggers when price returns to level within tolerance zone
Bounce Signals:
- Identifies approaches to untested session highs/lows
- Optional wick confirmation for reversal validation
- Signals when price rejects from liquidity zone
CONFIGURATION OPTIONS:
Entry Parameters:
- Min Bars After Break: 1-10 (delay before retest valid)
- Retest Tolerance: 0.1-10 points (precision of level test)
- Bounce Zone: 0.5-5 points (distance from level)
- Wick Confirmation: On/off reversal filter
Risk Management:
- Risk Reward Options: 1:3, 1:5, or Custom (1:1 to 1:10)
- Stop Loss: Configurable in points
- Max Daily Signals: 1-5 trade limiter
- Trading Hours: Customizable active window
Visual Elements:
- Session Levels: Orange (Asian), Yellow (London), Blue (NY)
- Signal Markers: Triangles (B&R), Diamonds (Bounce)
- TP/SL Lines: Automatic calculation and display
- Info Table: Shows bias, untested levels, daily signals
OPTIMAL USAGE:
Trading Windows:
- 9:30-11:00 AM EST: Primary trading window
- First touch of untested levels: Highest probability
- 15-minute timeframe: Recommended for futures
- Volume filter: Optional quality enhancement
Signal Prioritization:
- Untested levels provide stronger reactions
- Multiple confirmations increase probability
- Respect market structure and session context
- Combine with volume for filtering
TECHNICAL SPECIFICATIONS:
- Multi-timeframe: Uses 15-minute data for NY Open
- Session-based: Resets levels at session transitions
- Alert system: Detailed messages with levels
- Position tracking: Manages active trades visually
IMPORTANT NOTES:
This tool maps liquidity zones based on session extremes and price structure. No trading system guarantees profits. Combine with market context and proper risk management. Designed for active intraday trading on liquid instruments.
The indicator provides objective level identification while requiring trader discretion for optimal results.
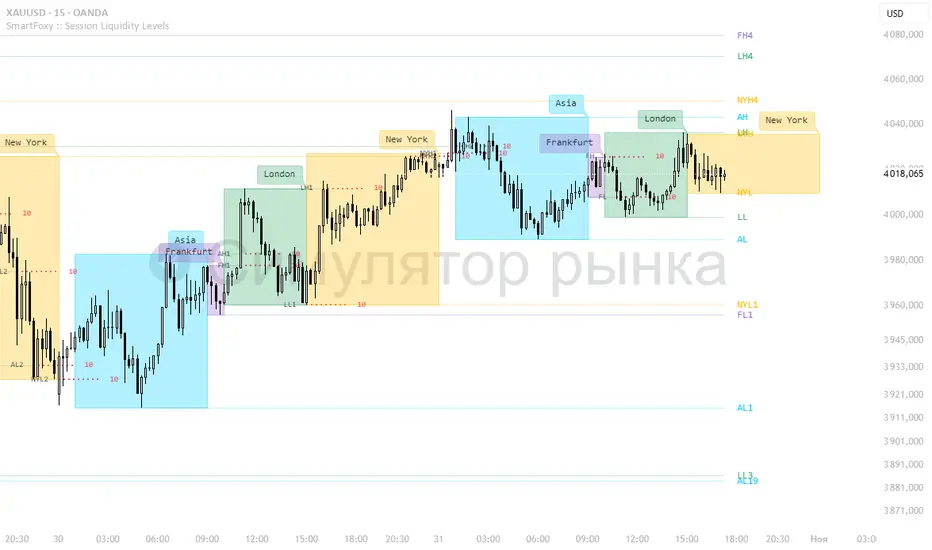
Sessions

Killzone Session High/Low Levels [SmartFoxy]Killzone Session High/Low Levels
The Killzone Session High/Low Levels indicator by SmartFoxy provides a complete intraday framework for understanding session-based liquidity, market structure rotation, and breakout behavior across global trading sessions.
It automatically plots the High/Low ranges for each selected session, highlights session killzones, and tracks breakout events with optional alerts.
This tool is designed for traders who rely on session dynamics (Asia, Frankfurt, London, New York) to identify liquidity targets, sweep zones, key ranges, and continuation/reversal opportunities.
________________________________________
How It Works
The indicator detects the active trading sessions for each day and builds structural High/Low ranges for them:
• Asia Session Range (High/Low);
• Frankfurt Session Range;
• London Session Range;
• New York Session Range;
• Optional custom session (NY Open, or any killzone).
For each session, the script can display:
• Session box or column;
• High/Low levels;
• Labels for every range (H/L);
• True session boundaries using user-defined timezone;
• Auto-extended levels up to the latest candle;
• Break levels after a breakout;
• Conditional removal or recoloring after a level is breached.
This gives traders a clean visual map of session liquidity and how price interacts with it throughout the day.
________________________________________
Key Features
1. Multiple Global Sessions •➤ Asia, Frankfurt, London, New York, plus one custom session for advanced killzone mapping.
2. Session High/Low Liquidity Levels •➤ Automatic plotting of every session’s High and Low, with optional labels and price markers.
3. Session Boxes or Columns •➤ Two display modes allow traders to visualize the session either as a filled box or a clear vertical column.
4. Breakout Logic & Temporary Levels .
When price breaks a session High/Low:
• Levels can be extended for a selected number of bars
• Or removed instantly after a breakout
• Or recolored to highlight the sweep event
This enables clean identification of liquidity grabs, breakouts, and continuation setups.
5. Alerts for Session Breakouts .
Set alerts when price breaks:
• Any session level
• Only levels formed on the current day
Perfect for traders who want real-time notifications of sweeps or key structure breaks.
6. Full Customization
You can configure:
• Session times;
• Timezone;
• Colors;
• Labels;
• Line styles and widths;
• Breakout behavior;
• Killzone range handling.
Everything is adjustable to match any trading style.
________________________________________
How to Use
1. Enable the sessions you want to track •➤ Asia, Frankfurt, London, New York, or custom.
2. Choose display mode
Box mode for visual range blocks;
Column mode for clean vertical alignment.
3. Enable High/Low Levels .
These act as liquidity magnets and key rejection zones.
4. Turn on Breakout Levels (optional)
Useful for spotting sweeps and continuation setups.
5. Turn on Alerts if you want notifications when price breaks levels.
6. Use session levels as liquidity reference points .
They work exceptionally well with smart money concepts (SMC), ICT, and intraday structure analysis.
________________________________________
Why This Indicator Is Useful
Shows exactly where liquidity is placed each session;
Highlights market structure transitions as sessions hand over control;
Helps identify stop hunts, sweeps, reversals, and continuation patterns;
Provides real-time alerts for structural breaks;
Organizes the chart and reduces noise;
Works with any intraday timeframe and any market.
This makes it valuable for scalpers, day traders, and SMC/ICT-style analysts.
________________________________________
Summary
Killzone Session High/Low Levels delivers a complete, highly customizable intraday mapping system based on global trading sessions.
It clarifies the session structure, reveals liquidity targets, and empowers traders to make confident trading decisions using clean, objective market data.
Market SessionsMarket Sessions (Asian, London, NY, Pacific)
Summary
This indicator plots the main global market sessions (Asian, European, American, Pacific) as boxes on your chart, complete with dynamic high/low tracking.
It's an essential tool for intraday traders to track session-based volatility patterns and visualize key support/resistance levels (like the Asian Range) that often define price action for the rest of the day.
Who it’s for
Intraday traders, scalpers, and day traders who need to visualize market hours and session-based ranges. If your strategy depends on the London open, the New York close, or the Asian range, this script will map it out for you.
What it shows
Customizable Session Boxes: Four fully configurable boxes for the Asian, European (London), American (New York), and Pacific (Sydney) sessions.
Session High & Low: The script tracks and boxes the highest high and lowest low of each session, dynamically updating as the session progresses.
Session Labels: Clear labels (e.g., "AS", "EU") mark each session, anchored to the start time.
Key Features
Powerful Timezone Control: This is the core feature.
Use Exchange Timezone (Default): Simply enter session times (e.g., 8:00 for London) relative to the exchange's timezone (e.g., "NASDAQ" or "BINANCE").
Use UTC Offset: Uncheck the box and enter a UTC offset (e.g., +3 or -5). Now, all session times you enter are relative to that specific UTC offset. This gives you full control regardless of the chart you're on.
Fully Customizable: Toggle any session on/off.
Style Control: Change the fill color, border color, transparency, border width, and line style (Solid, Dashed, Dotted) for each session individually.
Smart Labels: Labels stay anchored to the start of the session (no "sliding") and float just above the session high.
Why this helps
Track Volatility & Market Behavior: Visually identify the "personality" of each session. Some sessions might consistently produce powerful pumps or dumps, while others are prone to sideways "chop" or accumulation. This indicator helps you see these repeating patterns.
Find Key Support/Resistance Levels: The High and Low of a session (e.g., the Asian Range) often become critical support and resistance levels for the next session (e.g., London). This script makes it easy to spot these "session-to-session" S/R flips and reactions.
Aid Statistical Analysis: The script provides the core visual data for your statistical research. You can easily track how often the London session breaks the Asian high, or which session is most likely to reverse the trend, helping you build a robust trading plan.
Context is King: Instantly see which market is active, which are overlapping (like the high-volume London-NY overlap), and which have closed.
Quick setup
Go to Timezone Settings.
Decide how you want to enter times:
Easy (Default): Leave Use Exchange Timezone checked. Enter session times based on the chart's native exchange (e.g., for BTC/USDT on Binance, use UTC+0 times).
Manual (Pro): Uncheck Use Exchange Timezone. Enter your UTC Offset (e.g., +2 for Berlin). Now, enter all session times as they appear on the clock in Berlin.
Go to each session tab (Asian, European...) to enable/disable it and set the correct start/end hours and minutes.
Style the colors to match your chart theme.
Disclaimer
For educational/informational purposes only; not financial advice. Trading involves risk—manage it responsibly.

Session Streaks [LuxAlgo]The Session Streaks tool allows traders to identify whether a session is bullish or bearish on the chart. It also shows the current session streak, or the number of consecutive bullish or bearish sessions.
The tool features a dashboard with information about the session streaks of the underlying product on the chart.
🔶 USAGE
Analyzing session streaks is commonly used for market timing by studying the number of consecutive sessions over time and how long they last before the market changes direction.
We identify a bullish session as one in which the closing price is equal to or greater than the opening price, and a bearish session as one in which the closing price is below the opening price.
Each session is labeled according to its bias (bullish or bearish) and the number of consecutive sessions of the same type that conform the current streak.
🔹 Dashboard
The dashboard at the top shows information about the current session.
Under the "Streaks" header, historical information about session streaks is displayed, divided into bullish and bearish categories.
Number: Total number of streaks.
Median: The average duration of those streaks. We chose the median over the mean to avoid misrepresentation due to outliers.
Mode: The most common streak duration.
As the image shows, for this particular market, there are more bullish streaks than bearish ones. Bullish streaks have an average duration that is longer than that of bearish streaks, and both have the same most common streak duration.
If the current session is bullish and the median streak duration for bullish sessions is three, then we could consider scenarios in which the next two sessions are bullish.
🔶 DETAILS
🔹 Streaks On Larger Timeframes
On timeframes lower than or equal to Daily, the tool identifies each consecutive session, but this behavior changes on larger timeframes.
On timeframes larger than daily, the tool identifies the last session of each bar. Let's use the chart in the image as a reference.
At the top of the image, there is a daily chart where each session corresponds to each candle. One candle equals one day.
In the middle, we have a weekly chart where each session is the last session of each week, which is usually Friday for the Nasdaq 100 futures contract. The levels and labels displayed correspond to the last session within each candle, which is the last day of each week.
The levels and labels on the monthly chart correspond to the last session of each month, which is the last day of each month.
🔹 Gradient Style
Traders can choose between two different color gradients for the session background. Each gradient provides different information about price behavior within each session.
Horizontal: Green indicates prices at the top of the session range and red indicates prices at the bottom.
Vertical: Green indicates prices that are equal to or greater than the open price and red indicates prices that are below the open price of the session.
🔶 SETTINGS
🔹 Dashboard
Dashboard: Enable or disable the dashboard.
Position: Select the location of the dashboard.
Size: Select the dashboard size.
🔹 Style
Bullish: Select a color for bullish sessions.
Bearish: Select a color for bearish sessions.
Transparency: Select a transparency level from 100 to 0.
Gradient: Select a horizontal or vertical gradient.

IB SessionsMarks the initial balance of each session (first hour).
Also the weekly IB is marked (first asian session)
Breakout lines for each session to determine possible breakouts on the session.

Aude - Minimal Session IndicatorMinimal Session Indicator
- The indicator allows users to highlight specific sessions (time range) on the chart.
- There are options to change the visual settings of the session box (BG color, Border color, Border style).
- Max 500 sessions drawn

Dual Session VWAPSeparate VWAP with 1 standard deviation band for the regular session as well as electronic session

BRIMSTONE SESSION INDICATOR🧭 Brimstone Session Indicator
Brimstone Session Indicator highlights global trading sessions (Asia, London/Frankfurt, New York) and key Kill Zones, showing when real liquidity and volatility enter the market.
⸻
🔍 Why It’s Useful
Markets move in time cycles, not just price.
This tool makes institutional timing visible — so you instantly see:
• Session ranges & volatility shifts
• Liquidity grabs and reversals in Kill Zones
• Perfect timing for precision entries (ICT / SMC style)
⸻
⚔️ Kill Zones
Fully customizable timing windows for liquidity hunts, stop raids, and engineered moves — where the market is most likely to attack highs/lows.
⸻
🎯 Built For
• ICT / Smart Money Traders
• Intraday scalpers & bias traders
• Anyone who trades price + time, not price alone

ICT Killzones & MacrosICT Killzones & Macros (v1.1.5) — configurable ICT session windows + refined “macro” windows with live High/Low levels, optional extensions, next-window previews, and lightweight opening-price lines. Built to be clock-robust, timezone-aware, and performant on intraday charts.
Tip: All times are interpreted in your chosen IANA timezone (default: America/New_York) and auto-handle DST. You can rename, recolor, enable/disable, and retime every window.
What it plots
- Killzones (5) : Asia (19:00–02:00), London (02:00–05:00), NY AM (07:00–09:30), London Close (10:00–12:00), NY PM (13:30–16:00) — full-height boxes with optional header.
- Macros (8) (defaults tailored for common ICT “refined” windows): Asia-1 (18:00–21:00), Asia-2 (21:00–00:00), London-1 (01:00–04:00), AM-1 (09:45–10:15), AM-2 (10:45–11:15), Lunch (12:00–13:00), PM-1 (13:30–14:30), Power Hour (15:10–16:00).
- Live High/Low lines for the current Macro/Killzone window.
- Optional HL extension to the right until price crosses or the trading day rolls (style selectable).
- “Next” previews : earliest upcoming Macro and Killzone header; optional next-window background band.
- Opening Prices (3 lightweight time lines) : defaults 00:00, 08:30, 09:30 with right-edge labels, scoped to a session you choose (auto-cleans at session end).
- Key inputs & styling
- General : Timezone (IANA), “Sessions to show” (per window) to keep only the last N completed windows.
- Header : height (ticks), gap (ticks), fill opacity, border width/style, text size/color, toggle “Next Macro/Killzone” headers.
- Boxes : global fill opacity, global border width/style (used by both Macros & Killzones).
- High/Low : show HL, HL line style, extend on/off + extension style, optional extension labels.
- Opening Prices : enable Time 1/2/3, set HH:MM for each, session window, per-line colors, style (dotted/dashed/solid), width.
- Per-window controls : each Macro/Killzone has Enable, Session (HHMM-HHMM), Label, Fill color.
How to use (quick start)
- Set Timezone to your preference (default America/New_York).
- Toggle on the Macros and Killzones you trade. Adjust session times if needed.
- (Optional) Turn on Extend High/Low to project levels until crossed/day-roll.
- (Optional) Enable Next… headers to see the next upcoming window at a glance.
- (Optional) Configure Opening Prices (00:00 / 08:30 / 09:30 by default) and the session over which they appear.
Behavior & notes
- Time windows are computed by clock, not by guessing bar timestamps, making them robust across brokers and timeframes.
- With HL extension on, the current window’s levels extend until crossed or the end of the trading day (in your timezone). With it off, completed windows keep static HL markers (limited by “Sessions to show”).
- “Sessions to show” applies per Macro/Killzone to automatically prune older windows and keep charts snappy.
- Opening-price lines exist only within the chosen “Opening Prices Session” and are removed when it ends (keeps charts clean).
Defaults (color cues)
Killzones: Asia (blue), London (purple), NY AM (green), London Close (yellow), NY PM (orange).
Macros: neutral greys with Lunch and PM accents out of the box (all customizable).
Performance tips
- Reduce “Sessions to show” if you scroll far back in history.
- Disable “Next…” previews and/or extension labels on very slow machines.
- Narrow the “Opening Prices Session” window to exactly when you need those lines.
Changelog highlights
- v1.1.5 : Internal refinements and stability.
- v1.1.3 : Live High/Low lines for current windows + optional extension.
- v1.1.2 : Added “next Killzone” preview (to match “next Macro”).
- v1.1.0 : Defaults updated (5 KZ, 8 Macros). Removed “snap-to-killzone” behavior.
- v1.0.0 : Independent Macro vs. Killzone rendering; cleaner header logic.
- Known limitations
If your chart warns about drawings, trim “Sessions to show”.
If your broker session times differ from NY hours, adjust the sessions or change the indicator timezone.
Credits & intent
Inspired by ICT timing concepts; provided for education/mark-up, not financial advice.
Built to be flexible so you can mirror your personal playbook and journaling workflow.

ICT Sessions With BOS [TradeWithRon]
WITH BOS
This version includes BOS with filter for each session.
NONE,FVG,CISD Filter preset
you can choose how many BOS per session, style etc.
ICT Sessions and killzones maps three intraday sessions on your chart (Asia, London, NY), tracks each session’s live high/low, draws optional session range boxes, and projects ICT OTE zones in real time—with granular styling, touch/mitigation logic, and alerting.
What it does
*Live Session high/low tracking.
Historical session lines:
When a session ends, its final High/Low are preserved as tracked lines (with optional labels) for a configurable number of recent sessions.
Session boxes (ranges):
Draws a shaded box from session start to end that expands with new highs/lows. Limit how many recent boxes remain on chart.
ICT OTE zones (live):
For the currently active session, projects user-defined Fibonacci OTE levels (e.g., 61.8%, 70.5%, 78.6) between the session’s running high and low. Zones update tick-by-tick and can show labels. You can retain a history of recent sessions’ OTE levels.
snapshot
Break visualization (mitigation):
Optionally color the bar when price breaks a stored session High/Low. You can:
Require a body close through the level (vs. any touch)
Auto-remove the line and/or label on touch/close
Use custom break colors per session and side (high/low)
Timestamps:
Add up to two recurring vertical timestamp markers (e.g., 08:00, 09:30), plus an opening horizontal marker (e.g., 09:30) with label that extends until the next occurrence.
Alerts:
Built-in alerts for:
Touch of Session 1/2/3 High/Low (Asia/London/NY)
Touch of OTE levels (per session)
Key inputs:
Time & Limits
Timezone (e.g., GMT-4)
Timeframe limit: hide all drawings on and above a specified TF
Sessions
Session windows (default):
Session 1 (Asia): 18:00–00:00
Session 2 (London): 00:00–06:00
Session 3 (NY): 08:00–12:00
How many to keep (lines/boxes)
Line width, colors, and label suffixes (“High”/“Low”)
Labels: toggle, text (“Asia”, “London”, “NY”), size, and colors
Boxes: toggle per session and background colors
ICT OTE Zones
Toggle per session (Asia/London/NY)
Levels (comma-separated %s, e.g., 61.8,70.5,78.6)
History: number of past sessions to retain
Opacity, line width/style, and label size
Custom label text per session (e.g., “Asia OTE”)
Break/Mitigation Behavior:
Enable Mitigated Candles (bar color on break)
Remove line on touch and/or remove label on touch
Require body close (vs. wick touch)
Custom break colors by session and side
Timestamps
Opening horizontal line (time, style, width, color, label text/size, drawing limit)
Two vertical timestamps (times, style, width, color, drawing limit)
Alerts
Master Enable Alerts
Per-session toggles for High/Low touches
OTE touch alerts
How it works (under the hood)
Detects session state via input.session() windows in the chosen timezone.
Live session High/Low lines and labels update in real time; on session end, final levels are stored with optional labels and tracked length.
OTE zones are live-computed from current session High↔Low and refreshed every bar; a compact rolling history is enforced.
Bar coloring reacts to break events (touch or body-close, per your setting) and uses session-specific colors when enabled.
Timestamp lines/labels are created on each occurrence and trimmed to a drawing limit for performance.
Tips:
To hide session lines but keep boxes, set line color opacity to 0.
Use Timeframe Limit to keep higher-TF charts clean.
Fine-tune OTE Levels and History to balance clarity and performance.
For stricter break logic, enable Require Body Close.
Note: The script reserves high limits for lines/labels/boxes to keep recent context visible while managing cleanup automatically. Adjust “Session Number” and “Number Of Boxes” to suit your workflow.
— © TradeWithRon
ICT Sessions [TradeWithRon]
ICT Sessions and killzones maps three intraday sessions on your chart (Asia, London, NY), tracks each session’s live high/low, draws optional session range boxes, and projects ICT OTE zones in real time—with granular styling, touch/mitigation logic, and alerting.
What it does
Live Session high/low tracking.
Historical session lines:
When a session ends, its final High/Low are preserved as tracked lines (with optional labels) for a configurable number of recent sessions.
Session boxes (ranges):
Draws a shaded box from session start to end that expands with new highs/lows. Limit how many recent boxes remain on chart.
ICT OTE zones (live):
For the currently active session, projects user-defined Fibonacci OTE levels (e.g., 61.8%, 70.5%, 78.6) between the session’s running high and low. Zones update tick-by-tick and can show labels. You can retain a history of recent sessions’ OTE levels.
Break visualization (mitigation):
Optionally color the bar when price breaks a stored session High/Low. You can:
Require a body close through the level (vs. any touch)
Auto-remove the line and/or label on touch/close
Use custom break colors per session and side (high/low)
Timestamps:
Add up to two recurring vertical timestamp markers (e.g., 08:00, 09:30), plus an opening horizontal marker (e.g., 09:30) with label that extends until the next occurrence.
Alerts:
Built-in alerts for:
Touch of Session 1/2/3 High/Low (Asia/London/NY)
Touch of OTE levels (per session)
Key inputs:
Time & Limits
Timezone (e.g., GMT-4)
Timeframe limit: hide all drawings on and above a specified TF
Sessions
Session windows (default):
Session 1 (Asia): 18:00–00:00
Session 2 (London): 00:00–06:00
Session 3 (NY): 08:00–12:00
How many to keep (lines/boxes)
Line width, colors, and label suffixes (“High”/“Low”)
Labels: toggle, text (“Asia”, “London”, “NY”), size, and colors
Boxes: toggle per session and background colors
ICT OTE Zones
Toggle per session (Asia/London/NY)
Levels (comma-separated %s, e.g., 61.8,70.5,78.6)
History: number of past sessions to retain
Opacity, line width/style, and label size
Custom label text per session (e.g., “Asia OTE”)
Break/Mitigation Behavior:
Enable Mitigated Candles (bar color on break)
Remove line on touch and/or remove label on touch
Require body close (vs. wick touch)
Custom break colors by session and side
Timestamps
Opening horizontal line (time, style, width, color, label text/size, drawing limit)
Two vertical timestamps (times, style, width, color, drawing limit)
Alerts
Master Enable Alerts
Per-session toggles for High/Low touches
OTE touch alerts
How it works (under the hood)
Detects session state via input.session() windows in the chosen timezone.
Live session High/Low lines and labels update in real time; on session end, final levels are stored with optional labels and tracked length.
OTE zones are live-computed from current session High↔Low and refreshed every bar; a compact rolling history is enforced.
Bar coloring reacts to break events (touch or body-close, per your setting) and uses session-specific colors when enabled.
Timestamp lines/labels are created on each occurrence and trimmed to a drawing limit for performance.
Tips:
To hide session lines but keep boxes, set line color opacity to 0.
Use Timeframe Limit to keep higher-TF charts clean.
Fine-tune OTE Levels and History to balance clarity and performance.
For stricter break logic, enable Require Body Close.
Note: The script reserves high limits for lines/labels/boxes to keep recent context visible while managing cleanup automatically. Adjust “Session Number” and “Number Of Boxes” to suit your workflow.
— © TradeWithRon
FOREXSOM Session Boxes (Local Time) — Asian, London & New YorkFOREXSOM Session Boxes (Local Time) highlights the three major Forex sessions — Asian, London, and New York — using your chart’s local timezone automatically.
This indicator helps traders visualize market structure, liquidity zones, and timing across global trading hours with accuracy and clarity.
Key Features
Automatically adjusts to your chart’s local timezone
Highlights Asian, London, and New York sessions with clean color zones
Works on all timeframes and asset classes
Ideal for Smart Money Concepts (SMC), ICT, and price action strategies
Helps identify range breakouts, session highs/lows, and liquidity grabs
How It Works
Each session box updates in real time to show the current range as the market develops.
The boxes reset at the end of each session, making it easy to compare volatility and liquidity shifts between regions.
Sessions (default times):
Asian: 17:00 – 03:00
London: 02:00 – 11:00
New York: 07:00 – 16:00
How to Use
Add the indicator to your chart.
Ensure your chart timezone matches your local time in chart settings.
Watch session ranges form and look for liquidity sweeps or breakouts between overlaps (London/New York).
Created by FOREXSOM
Empowering traders worldwide with precision-built tools for Smart Money and institutional trading education.

Sessions [Trade Tribe HQ]Color-coded session ranges with ADR% labels to help you trade smarter, not harder.
This tool marks New York, London, Tokyo, and Sydney sessions, showing their ranges, highs/lows, VWAPs, and ADR%.
🔹 Key Features
Colored session boxes (NY, London, Tokyo, Sydney)
Session highs & lows, VWAP, and trendlines
Dashboard showing active sessions, volume, and %ADR
ADR% labels at session close
🔹 How It Helps
Spot session traps, moves, and reversals faster
Manage expectations using ADR% (no chasing over-extended moves)
Identify overlap zones (London → NY) for volatility spikes
Simplify cycle tracking across global markets
Market Sessions Marker—making it easy to see where the energy has been spent and where opportunity is building next.
Created with ❤️ by TraderChick – part of the Trade Tribe HQ community.
If you found this tool useful, check out my profile for more strategies, classes, and resources.

3CRGANG - SESSIONSOverview
The "3CRGANG - SESSIONS" indicator is a comprehensive tool for visualizing and monitoring major global trading sessions on TradingView charts. It highlights sessions for key exchanges—New York (NYSE), London (LSE), Frankfurt (FSE), Sydney (ASX), Tokyo (TSE), and Hong Kong (HKSE)—with customizable alerts, background coloring on low timeframes, and an interactive dashboard table. Designed for traders who operate across timezones or need session-based context, it accounts for holidays, half-days, and daylight saving time (DST) adjustments to provide accurate, real-time session status. On charts of 1-minute or lower, it overlays semi-transparent background colors to mark active sessions visually. Across all timeframes, a compact table at the bottom center displays session cells with dynamic coloring, and hovering over each reveals a tooltip with the weekly schedule, time until open/close, and holiday notes.
Built on Pine Script v6, this overlay indicator enhances situational awareness for forex, stocks, futures, and other assets by syncing with exchange-specific calendars. Its invite-only status ensures access to refined features that go beyond standard session tools, making it ideal for multi-market strategies.
How It's Built: Core Concepts and Calculations
The indicator leverages a modular approach to session detection, drawing from time-based logic for precision. Sessions are defined by fixed start/end times in their native timezones (e.g., NYSE: 0930-1600 America/New_York), adjusted dynamically for DST via timezone-aware functions. Key components include:
Session Activation Checks: Using helper functions like f_isSessionActive, it evaluates if the current bar or real-time timestamp falls within session hours, excluding weekends. Time is broken into minutes since midnight for comparisons, with special handling for overnight sessions (though none here cross midnight significantly).
Holiday and Half-Day Integration: Pre-loaded holiday maps for each exchange detect full closures or early closes (e.g., NYSE half-days end at custom times like 1300). If a half-day is identified, session end times are overridden, and pre-close periods recalculated (e.g., 30/5 minutes before adjusted close).
Pre-Open/Pre-Close Detection: Sub-sessions (e.g., 30 minutes before open) use similar logic to flag impending events, triggering only on the first bar of these windows via f_SessionOpen and f_SessionClose for efficiency.
Timestamp Calculations: Functions like f_SessionTimes and f_SessionTimesForTooltip compute open/close timestamps from timenow, adjusting for next trading day if after close or on weekends/holidays. This ensures forward-looking accuracy in tooltips.
Alert System: Configurable per-session, it fires notifications for pre-open (30/5 min), open, pre-close (30/5 min), close, and holidays. Alerts use alert.freq_once_per_bar to avoid spam, gated by market open status.
Visual Dashboard: A 6-column table is drawn with table.new, positioned via input (default bottom-center). Cells update colors based on state: active (session color at 75% opacity), pre-active (yellow), or inactive (gray). Tooltips via f_getSessionTooltip compile weekly schedules using f_formatScheduleEntry, which converts session times to user timezone, formats dates (DD/MM), weekdays (padded for alignment), and notes holidays/early closes. Time remaining uses f_formatTimeRemainingtooltip for human-readable countdowns (e.g., "1h:30m").
Background Coloring: On ≤1m timeframes, bgcolor applies session-specific hues (e.g., green for NYSE) at 90-95% transparency, configurable via light/dark themes.
User Customization: Inputs handle timezone (90+ options with DST), time format (standard/military, though not fully implemented in script), device (adjusts text padding/sizes), and theme (swaps colors for readability).
This setup combines timestamp arithmetic, conditional mapping, and array-based date iteration to create a robust, adaptive system that respects global market nuances without relying on simplistic built-in session strings.
Why It's Useful
Trading sessions drive liquidity, volatility, and price action—e.g., London open often sparks trends in forex, while NYSE influences equities. This indicator demystifies these by providing at-a-glance visuals and alerts, reducing the need for manual timezone conversions or external calendars. Background colors on low TFs help spot session overlaps (e.g., London/NY for high volume), while the table's tooltips offer quick weekly overviews, ideal for planning around holidays like Lunar New Year (HKSE-specific additions). Alerts prevent missing key events, and holiday detection avoids false expectations during closures.
For global traders, it minimizes errors in multi-asset setups; scalpers benefit from pre-open warnings, while swing traders use schedules for longer-term context. Its non-intrusive design (transparent on higher TFs) keeps charts clean, enhancing overall workflow efficiency.
How to Use It
Add to Chart: Access via invite-only on TradingView; apply to any timeframe, best on intraday for backgrounds or any for the dashboard.
Configure Inputs:
Time Settings: Select your timezone (e.g., UTC+3 Jerusalem) for accurate tooltip conversions; choose time format (standard preferred for readability).
Visualization Setup: Pick device (Desktop/Tablet/Mobile) for optimized text sizing/padding; select Light/Dark theme to match your chart.
Sessions Dashboard: Adjust table position if needed (default bottom-center).
Notifications Settings: Toggle alerts per exchange (e.g., enable NYSE for US focus).
Trading Application:
Visual Cues: On ≤1m charts, watch for color changes to enter/exit during active sessions. Hover table cells for schedules—current day highlighted, future/past separated, holidays marked (*).
Alerts: Set up in TradingView's alert manager for "alert() function calls only" to get notifications like "New York Session is about to Open in less than 5 minutes!"
Strategies: Use pre-open for setups (e.g., range breaks), closes for profit-taking. Combine with volume indicators during overlaps.
Best Practices: Test on demo; adjust alerts to avoid overload. For non-realtime, tooltips use current date for projections.
Why It's Unique and Worth Invite-Only Access
Unlike basic session highlighters that use rigid time strings or ignore holidays, this indicator integrates a custom holiday library with half-day adjustments and additional events (e.g., Buddha's Birthday for HKSE), ensuring precision across exchanges. Its tooltip system—generating timezone-converted weekly schedules with day adjustments, countdowns, and holiday notes—provides unmatched planning utility, while adaptive visuals (device/theme-aware) and granular alerts (pre-events included) elevate it beyond public tools. The logic for timestamp forward-projection, weekend skipping, and formatted entries builds on but significantly enhances built-in functions and educational examples.
This originality—protecting the proprietary blend of global calendar handling, alert gating, and interactive dashboards—justifies closed-source status. As invite-only, it delivers premium value through reliable, low-maintenance features that free traders from external apps, warranting access for those seeking an edge in session-based trading. Contact via TradingView for support.
Disclaimer
This indicator is a tool for analyzing market sessions and does not guarantee success. Trading involves risk, and past performance is not indicative of future results. Always use proper risk management.

Watermark with Session Boxes (by Rufi)Watermark & Session Boxes - Chart Branding Tool
What it does: Combines professional chart watermarking with automated trading session visualization for clean, branded analysis.
Key Features:
Smart Session Boxes: Auto-draws boxes around Asia (8PM-11:59PM), London (2AM-5AM), and NY (7AM-10AM) sessions using high/low detection
Custom Watermark: Professional text overlay with your brand/tagline
Full Customization: Adjustable colors, transparency (0-100%), and display limits (1-30 days)
How it works: Uses Pine Script's time() function to detect session periods, tracks price extremes during each session, then draws filled rectangles from session high to low. Perfect for identifying key support/resistance levels from major trading periods.
Best for: Intraday traders who want branded charts with clear session-based S/R levels. Ideal for forex, indices, and crypto on lower timeframes.

SW's Asia/London H/L'sAccurate Asia and London (with other session) High's and Low's. As well as NY Pre-market and opening bell, and end of day vertical lines. Also created 4 slots in UI to be able to set specific vertical lines with custom label options.
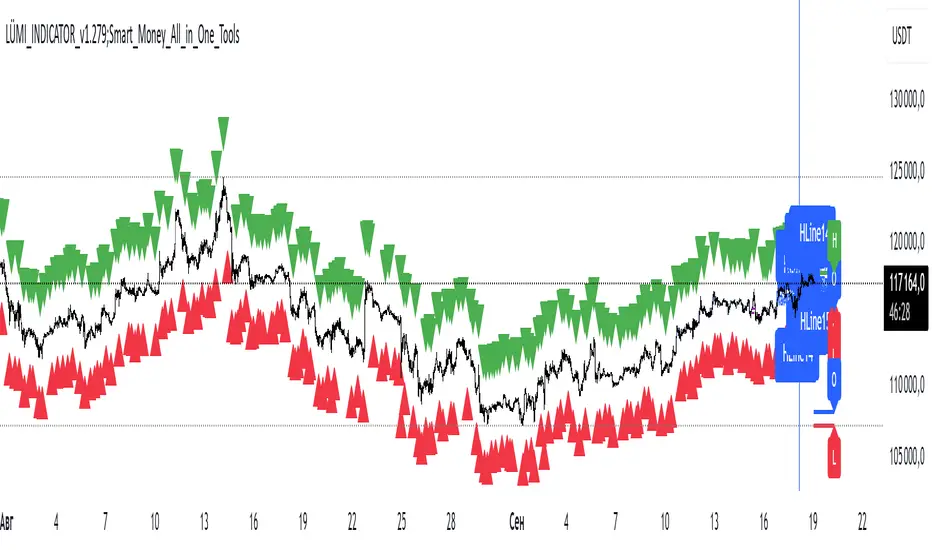
LÜMI_INDICATOR_v1.279_Smart_Money_All_in_One_Tools!!!Русский перевод внизу!!!!
Before using it, go to the settings and uncheck all the boxes!!!
And only then after that deal with this indicator, what you need from there, then add.
In the future, I will release a COMPLETE guide to this indicator with screenshots, so throw it to your favorites, don't waste it.
This version is still raw, but WORKING. There will be improvements in the structure of the indicator so that you can intuitively understand what each of the 100+(!) indicator settings is responsible for.
What's inside:
1. Session indicator. 15 Fully customizable time boxes, for any needs, and sessions. Enter your time zone, the time of your session, and that's it. There are also a couple of unexpected bonuses in this part of the indicator))
2. A set of horizontal lines of lines that come out at the right time for you. It is convenient to designate NYM, NYSE OPEN RANge, and other events on the chart that occur strictly on time. It can be widely used if you know what to look for.
3. Like the 2nd item, only vertical.
4. Fractal indicator.
5. OHL levels for
5.1. Current day
5.2. Current week
5.3. Current month.
6. Vertical chart dividers by opening levels
6.1 Days
6.2. Weeks
6.3. Months.
This feature is ideal for those who trade forex price delivery profiles or indices.
!!! Перед использованием зайдите в настройки и поснимайте все галочки!!!
И только потом после этого разбирайтесь с этим индюком, что вам оттуда нужно, то и добавляйте.
В дальнейшем выпущу ПОЛНЕЙШИЙ гайд на этот индюк со скриншотами, так что кидайте в избранное, не теряйте
Версия пока сырая, но РАБОЧАЯ. Будут доработки в структуре индикатора, чтобы можно было интуитивно понять, за что отвечает каждая из 100+(!) настроек индикатора
Что внутри:
1. Индикатор сессий. 15полностью настраиваемых боксов по времени, под любые нужды, и сессии. Вводите свой часовой пояс, время вашей сессии и всё. В этой части индикатора также есть пара неожиданных бонусов))
2. Набор горизонтальных линий линий, выходят в нужное для вас время. Удобно обозначать NYM, NYSE OPEN RANge, и другие события на графике, которые происходят строго по времени. Применение можно найти широкое, если знать, что искать
3. Как 2 пункт, только вертикальные.
4. Индикатор фракталов.
5. Уровни OHL для
5.1. Текущего дня
5.2. Текущей недели
5.3. Текущего месяца.
6. Вертикальные разделители графика по уровням открытия
6.1 Дня
6.2. Недели
6.3. Месяца.
Эта функция идеальна для тех, кто торгует профили доставки цены форекс или индексов.
Session AnchorsDescription
This indicator highlights the four main global trading sessions — London, New York AM, New York PM, and Asia — as color-coded boxes on the chart. Each session is defined by fixed start/end times (New York time) and dynamically updates with the evolving high and low during that interval. This provides a clear view of how volatility and structure shift as trading activity passes from one region to another.
How to use
• Works on any timeframe.
• Toggle sessions on/off based on your trading hours.
• Observe price behavior as one session closes and another opens.
• Use session boxes as context for liquidity, volatility, and structure analysis.
Originality
This script delivers a clean, customizable visualization of global market hours and session ranges, avoiding extra overlays so traders can isolate session-based behavior without distraction.
⚠️ Disclaimer
This indicator does not generate signals. It provides a structural mapping of global sessions for contextual analysis only.

Weekly Session BreakThis indicator plots a vertical line at the end of the trading week (Friday) to mark the weekly session break. It is designed to be used on intraday charts (sub-1 hour timeframes).
The line's appearance is fully customizable via the Inputs tab, allowing you to change its color, style (solid, dotted, or dashed), and thickness.
Key Features:
End-of-Week Marker: Accurately draws a vertical line on the last bar of the trading week.
Timeframe Specific: Lines are only visible on intraday charts (1-minute to 59-minute timeframes) to prevent clutter on higher timeframes.
Customizable: Adjust the line's color, style, and thickness from the Inputs menu.

Simple Trading SessionsThis indicator highlights the major global trading sessions (Tokyo, London, and New York) directly on your chart with clean background shading.
Tokyo Session (default 00:00–09:00 exchange time)
London Session (default 07:00–16:00 exchange time)
New York Session (default 12:30–21:00 exchange time)
Each session is displayed as a different shaded block, making it easy to:
Spot when the market is most active.
Identify overlapping periods (e.g., London–New York overlap).
Backtest strategies that depend on session timing.
⚙️ How to Use
Add the indicator to any intraday chart.
Adjust session times in the settings panel to match your broker or preferred timezone.
Use the shading to guide your trading around regional liquidity zones.
✅ Notes
By default, session times follow the chart’s exchange timezone.
You can change the inputs to match your own session definitions.
Very lightweight and designed for traders who want a simple, uncluttered session map without extra calculations.

Universal Key Level IndicatorCustomizable indicator which provide key levels for:
NY Session
Asia Session
London Session
Globex Session
Previous Day OCHL
Previous Week OCHL
Previous Day VAH VAL POC
Previous Week VAH VAL POC

Cumulative Returns by Session [BackQuant]Cumulative Returns by Session
What this is
This tool breaks the trading day into three user-defined sessions and tracks how much each session contributes to return, volatility, and volume. It then aggregates results over a rolling window so you can see which session has been pulling its weight, how streaky each session has been, and how sessions relate to one another through a compact correlation heatmap.
We’ve also given the functionality for the user to use a simplified table, just by switching off all settings they are not interested in.
How it works
1) Session segmentation
You define APAC, EU, and US sessions with explicit hours and time zones. The script detects when each session starts and ends on every intraday bar and records its open, intraday high and low, close, and summed volume.
2) Per-session math
At each session end the script computes:
Return — either Percent: (Close−Open)÷Open×100(Close − Open) ÷ Open × 100(Close−Open)÷Open×100 or Points: (Close−Open)(Close − Open)(Close−Open), based on your selection.
Volatility — either Range: (High−Low)÷Open×100(High − Low) ÷ Open × 100(High−Low)÷Open×100 or ATR scaled by price: ATR÷Open×100ATR ÷ Open × 100ATR÷Open×100.
Volume — total volume transacted during that session.
3) Storage and lookback
Each day’s three session stats are stored as a row. You choose how many recent sessions to keep in memory. The script then:
Builds cumulative returns for APAC, EU, US across the lookback.
Computes averages, win rates, and a Sharpe-like ratio avgreturn÷avgvolatilityavg return ÷ avg volatilityavgreturn÷avgvolatility per session.
Tracks streaks of positive or negative sessions to show momentum.
Tracks drawdowns on cumulative returns to show worst runs from peak.
Computes rolling means over a short window for short-term drift.
4) Correlation heatmap
Using the stored arrays of session returns, the script calculates Pearson correlations between APAC–EU, APAC–US, and EU–US, and colors the matrix by strength and sign so you can spot coupling or decoupling at a glance.
What it plots
Three lines: cumulative return for APAC, EU, US over the chosen lookback.
Zero reference line for orientation.
A statistics table with cumulative %, average %, positive session rate, and optional columns for volatility, average volume, max drawdown, current streak, return-to-vol ratio, and rolling average.
A small correlation heatmap table showing APAC, EU, US cross-session correlations.
How to use it
Pick the asset — leave Custom Instrument empty to use the chart symbol, or point to another symbol for cross-asset studies.
Set your sessions and time zones — defaults approximate APAC, EU, and US hours, but you can align them to exchange times or your workflow.
Choose calculation modes — Percent vs Points for return, Range vs ATR for volatility. Points are convenient for futures and fixed-tick assets, Percent is comparable across symbols.
Decide the lookback — more sessions smooths lines and stats; fewer sessions makes the tool more reactive.
Toggle analytics — add volatility, volume, drawdown, streaks, Sharpe-like ratio, rolling averages, and the correlation table as needed.
Why session attribution helps
Different sessions are driven by different flows. Asia often sets the overnight tone, Europe adds liquidity and direction changes, and the US session can dominate range expansion. Separating contributions by session helps you:
Identify which session has been the main driver of net trend.
Measure whether volatility or volume is concentrated in a specific window.
See if one session’s gains are consistently given back in another.
Adapt tactics: fade during a mean-reverting session, press during a trending session.
Reading the tables
Cumulative % — sum of session returns over the lookback. The sign and slope tell you who is carrying the move.
Avg Return % and Positive Sessions % — direction and hit rate. A low average but high hit rate implies many small moves; the reverse implies occasional big swings.
Avg Volatility % — typical intrabars range for that session. Compare with Avg Return to judge efficiency.
Return/Vol Ratio — return per unit of volatility. Higher is better for stability.
Max Drawdown % — worst cumulative give-back within the lookback. A quick way to spot riskiness by session.
Current Streak — consecutive up or down sessions. Useful for mean-reversion or regime awareness.
Rolling Avg % — short-window drift indicator to catch recent turnarounds.
Correlation matrix — green clusters indicate sessions tending to move together; red indicates offsetting behavior.
Settings overview
Basic
Number of Sessions — how many recent days to include.
Custom Instrument — analyze another ticker while staying on your current chart.
Session Configuration and Times
Enable or hide APAC, EU, US rows.
Set hours per session and the specific time zone for each.
Calculation Methods
Return Calculation — Percent or Points.
Volatility Calculation — Range or ATR; ATR Length when applicable.
Advanced Analytics
Correlation, Drawdown, Momentum, Sharpe-like ratio, Rolling Statistics, Rolling Period.
Display Options and Colors
Show Statistics Table and its position.
Toggle columns for Volatility and Volume.
Pick individual colors for each session line and row accents.
Common applications
Session bias mapping — find which window tends to trend in your market and plan exposure accordingly.
Strategy scheduling — allocate attention or risk to the session with the best return-to-vol ratio.
News and macro awareness — see if correlation rises around central bank cycles or major data releases.
Cross-asset monitoring — set the Custom Instrument to a driver (index future, DXY, yields) to see if your symbol reacts in a particular session.
Notes
This indicator works on intraday charts, since sessions are defined within a day. If you change session clocks or time zones, give the script a few bars to accumulate fresh rows. Percent vs Points and Range vs ATR choices affect comparability across assets, so be consistent when comparing symbols.
Session context is one of the simplest ways to explain a messy tape. By separating the day into three windows and scoring each one on return, volatility, and consistency, this tool shows not just where price ended up but when and how it got there. Use the cumulative lines to spot the steady driver, read the table to judge quality and risk, and glance at the heatmap to learn whether the sessions are amplifying or canceling one another. Adjust the hours to your market and let the data tell you which session deserves your focus.
