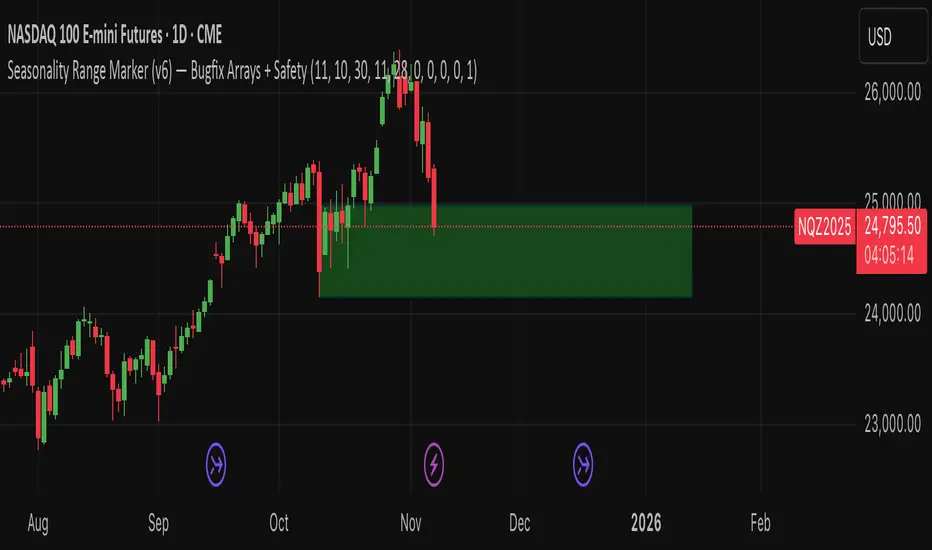
Seasonality Range Marker For better Seasonality Analysation. To see Seasionality patterns in the chart.
Mevsimlik
Volume Surprise [LuxAlgo]The Volume Surprise tool displays the trading volume alongside the expected volume at that time, allowing users to spot unexpected trading activity on the chart easily.
The tool includes an extrapolation of the estimated volume for future periods, allowing forecasting future trading activity.
🔶 USAGE
We define Volume Surprise as a situation where the actual trading volume deviates significantly from its expected value at a given time.
Being able to determine if trading activity is higher or lower than expected allows us to precisely gauge the interest of market participants in specific trends.
A histogram constructed from the difference between the volume and expected volume is provided to easily highlight the difference between the two and may be used as a standalone.
The tool can also help quantify the impact of specific market events, such as news about an instrument. For example, an important announcement leading to volume below expectations might be a sign of market participants underestimating the impact of the announcement.
Like in the example above, it is possible to observe cases where the volume significantly differs from the expected one, which might be interpreted as an anomaly leading to a correction.
🔹 Detecting Rare Trading Activity
Expected volume is defined as the mean (or median if we want to limit the impact of outliers) of the volume grouped at a specific point in time. This value depends on grouping volume based on periods, which can be user-defined.
However, it is possible to adjust the indicator to overestimate/underestimate expected volume, allowing for highlighting excessively high or low volume at specific times.
In order to do this, select "Percentiles" as the summary method, and change the percentiles value to a value that is close to 100 (overestimate expected volume) or to 0 (underestimate expected volume).
In the example above, we are only interested in detecting volume that is excessively high, we use the 95th percentile to do so, effectively highlighting when volume is higher than 95% of the volumes recorded at that time.
🔶 DETAILS
🔹 Choosing the Right Periods
Our expected volume value depends on grouping volume based on periods, which can be user-defined.
For example, if only the hourly period is selected, volumes are grouped by their respective hours. As such, to get the expected volume for the hour 7 PM, we collect and group the historical volumes that occurred at 7 PM and average them to get our expected value at that time.
Users are not limited to selecting a single period, and can group volume using a combination of all the available periods.
Do note that when on lower timeframes, only having higher periods will lead to less precise expected values. Enabling periods that are too low might prevent grouping. Finally, enabling a lot of periods will, on the other hand, lead to a lot of groups, preventing the ability to get effective expected values.
In order to avoid changing periods by navigating across multiple timeframes, an "Auto Selection" setting is provided.
🔹 Group Length
The length setting allows controlling the maximum size of a volume group. Using higher lengths will provide an expected value on more historical data, further highlighting recurring patterns.
🔹 Recommended Assets
Obtaining the expected volume for a specific period (time of the day, day of the week, quarter, etc) is most effective when on assets showing higher signs of periodicity in their trading activity.
This is visible on stocks, futures, and forex pairs, which tend to have a defined, recognizable interval with usually higher trading activity.
Assets such as cryptocurrencies will usually not have a clearly defined periodic trading activity, which lowers the validity of forecasts produced by the tool, as well as any conclusions originating from the volume to expected volume comparisons.
🔶 SETTINGS
Length: Maximum number of records in a volume group for a specific period. Older values are discarded.
Smooth: Period of a SMA used to smooth volume. The smoothing affects the expected value.
🔹 Periods
Auto Selection: Automatically choose a practical combination of periods based on the chart timeframe.
Custom periods can be used if disabling "Auto Selection". Available periods include:
- Minutes
- Hours
- Days (can be: Day of Week, Day of Month, Day of Year)
- Months
- Quarters
🔹 Summary
Method: Method used to obtain the expected value. Options include Mean (default) or Percentile.
Percentile: Percentile number used if "Method" is set to "Percentile". A value of 50 will effectively use a median for the expected value.
🔹 Forecast
Forecast Window: Number of bars ahead for which the expected volume is predicted.
Style: Style settings of the forecast.

MF_Average_Seasonal_MovementYou can chose a date range and see the average, min and max movement within that time.
n addition it shows how many longs or shorts would have won in that time frame.
To quikly look at the time periods in the past it markes the chosen dates each year with two horizontal lines.
You can utilize the election year cycle and look only at post election years for example
Seasonal Pattern DecoderSeasonal Pattern Decoder
The Seasonal Pattern Decoder is a powerful tool designed for traders and analysts who want to uncover and leverage seasonal tendencies in financial markets. Instead of cluttering your chart with complex visuals, this indicator presents a clean, intuitive table that summarizes historical monthly performance, allowing you to spot recurring patterns at a glance.
How It Works
The indicator fetches historical monthly data for any symbol and calculates the percentage return for each month over a specified number of years. It then organizes this data into a comprehensive table, providing a clear, year-by-year and month-by-month breakdown of performance.
Key Features
Historical Performance Table: Displays monthly returns for up to a user-defined number of years, making it easy to compare performance across different periods.
Color-Coded Heatmap: Each cell is colored based on the performance of the month. Strong positive returns are shaded in green, while strong negative returns are shaded in red, allowing for immediate visual analysis of monthly strength or weakness.
Annual Summary: A "Σ" column shows the total percentage return for each full calendar year.
AVG Row: Calculates and displays the average return for each month across all the years shown in the table.
WR Row: Shows the "Win Rate" for each month, which is the percentage of time that month had a positive return. This is crucial for identifying high-probability seasonal trends.
How to Use
Add the "Seasonal Pattern Decoder" indicator to your chart. Note that it works best on Daily, Weekly, or Monthly timeframes. A warning message will be displayed on intraday charts.
In the indicator settings, adjust the "Lookback Period" to control how many years of historical data you want to analyze.
Use the "Show Years Descending" option to sort the table from the most recent year to the oldest.
The "Heat Range" setting allows you to adjust the sensitivity of the color-coding to fit the volatility of the asset you are analyzing.
This tool is ideal for confirming trading biases, developing seasonal strategies, or simply gaining a deeper understanding of an asset's typical behavior throughout the year.
## Disclaimer
This indicator is designed as a technical analysis tool and should be used in conjunction with other forms of analysis and proper risk management.
Past performance does not guarantee future results, and traders should thoroughly test any strategy before implementing it with real capital.

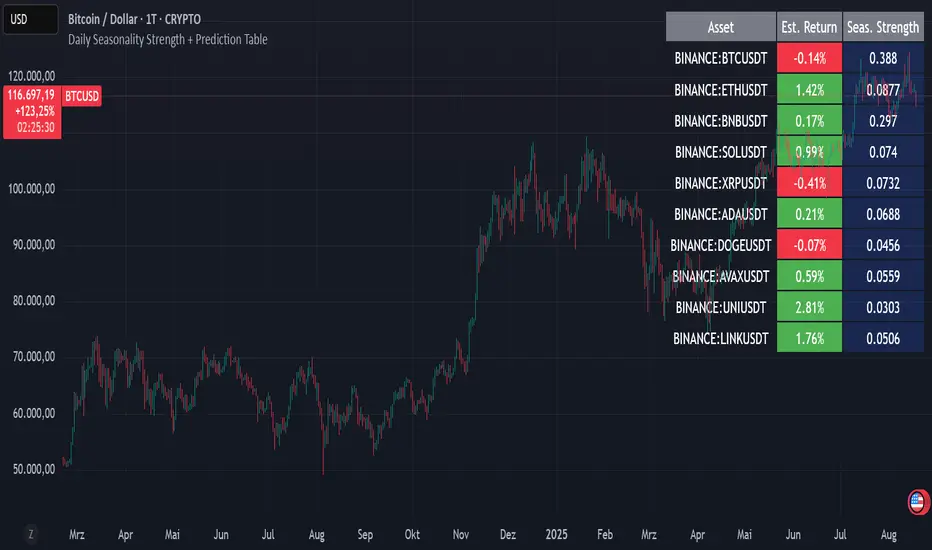
Daily Seasonality Strength + Prediction TableDaily Seasonality Strength + Prediction Table
Return Estimates:
This indicator uses historical price data to calculate average returns for each day (of the week or month) and uses these to predict the next day’s return.
Seasonality Strength:
It measures seasonality strength by comparing predicted returns with actual returns, using the inverse of MSE (higher values mean stronger seasonality).
supports up to 10 assets
This script is for informational and educational purposes only. It does not constitute financial, investment, or trading advice. I am not a financial advisor. Any decisions you make based on this indicator are your own responsibility. Always do your own research and consult with a qualified financial professional before making any investment decisions.
Past performance is no guarantee of future results. The value of the instruments may fluctuate and is not guaranteed
Detailed Monthly Seasonality Table By TheNextronThe "Detailed Monthly Seasonality Table" script is a Pine Script v6 TradingView indicator designed to visually analyze monthly performance trends for any security. It computes and displays how price behaves month-by-month over a user-defined number of years, offering a clean, data-rich dashboard for evaluating seasonal trading patterns.
📊 Purpose:
To help traders identify which months tend to be bullish or bearish, and how consistently the price reacts during those months, based on historical closing prices.
🧩 Key Features:
✅ User Inputs
Years to Analyze: How many past years to include in the analysis (e.g., 5–20 years).
Result Display Options:
% Change or Point Change
Toggle to show absolute performance or color-coded gain/loss
📅 Monthly Analysis Logic
For each month (Jan to Dec), the script:
Gathers historical data year by year
Calculates monthly return based on selected price type
📋 Dashboard Output
A custom table on the chart showing:
Each month's average % return
Win rate
Number of times the month was positive (green) or negative (red)

Bitcoin Monthly Seasonality [Alpha Extract]The Bitcoin Monthly Seasonality indicator analyzes historical Bitcoin price performance across different months of the year, enabling traders to identify seasonal patterns and potential trading opportunities. This tool helps traders:
Visualize which months historically perform best and worst for Bitcoin.
Track average returns and win rates for each month of the year.
Identify seasonal patterns to enhance trading strategies.
Compare cumulative or individual monthly performance.
🔶 CALCULATION
The indicator processes historical Bitcoin price data to calculate monthly performance metrics
Monthly Return Calculation
Inputs:
Monthly open and close prices.
User-defined lookback period (1-15 years).
Return Types:
Percentage: (monthEndPrice / monthStartPrice - 1) × 100
Price: monthEndPrice - monthStartPrice
Statistical Measures
Monthly Averages: ◦ Average return for each month calculated from historical data.
Win Rate: ◦ Percentage of positive returns for each month.
Best/Worst Detection: ◦ Identifies months with highest and lowest average returns.
Cumulative Option
Standard View: Shows discrete monthly performance.
Cumulative View: Shows compounding effect of consecutive months.
Example Calculation (Pine Script):
monthReturn = returnType == "Percentage" ?
(monthEndPrice / monthStartPrice - 1) * 100 :
monthEndPrice - monthStartPrice
calcWinRate(arr) =>
winCount = 0
totalCount = array.size(arr)
if totalCount > 0
for i = 0 to totalCount - 1
if array.get(arr, i) > 0
winCount += 1
(winCount / totalCount) * 100
else
0.0
🔶 DETAILS
Visual Features
Monthly Performance Bars: ◦ Color-coded bars (teal for positive, red for negative returns). ◦ Special highlighting for best (yellow) and worst (fuchsia) months.
Optional Trend Line: ◦ Shows continuous performance across months.
Monthly Axis Labels: ◦ Clear month names for easy reference.
Statistics Table: ◦ Comprehensive view of monthly performance metrics. ◦ Color-coded rows based on performance.
Interpretation
Strong Positive Months: Historically bullish periods for Bitcoin.
Strong Negative Months: Historically bearish periods for Bitcoin.
Win Rate Analysis: Higher win rates indicate more consistently positive months.
Pattern Recognition: Identify recurring seasonal patterns across years.
Best/Worst Identification: Quickly spot the historically strongest and weakest months.
🔶 EXAMPLES
The indicator helps identify key seasonal patterns
Bullish Seasons: Visualize historically strong months where Bitcoin tends to perform well, allowing traders to align long positions with favorable seasonality.
Bearish Seasons: Identify historically weak months where Bitcoin tends to underperform, helping traders avoid unfavorable periods or consider short positions.
Seasonal Strategy Development: Create trading strategies that capitalize on recurring monthly patterns, such as entering positions in historically strong months and reducing exposure during weak months.
Year-to-Year Comparison: Assess how current year performance compares to historical seasonal patterns to identify anomalies or confirmation of trends.
🔶 SETTINGS
Customization Options
Lookback Period: Adjust the number of years (1-15) used for historical analysis.
Return Type: Choose between percentage returns or absolute price changes.
Cumulative Option: Toggle between discrete monthly performance or cumulative effect.
Visual Style Options: Bar Display: Enable/disable and customize colors for positive/negative bars, Line Display: Enable/disable and customize colors for trend line, Axes Display: Show/hide reference axes.
Visual Enhancement: Best/Worst Month Highlighting: Toggle special highlighting of extreme months, Custom highlight colors for best and worst performing months.
The Bitcoin Monthly Seasonality indicator provides traders with valuable insights into Bitcoin's historical performance patterns throughout the year, helping to identify potentially favorable and unfavorable trading periods based on seasonal tendencies.

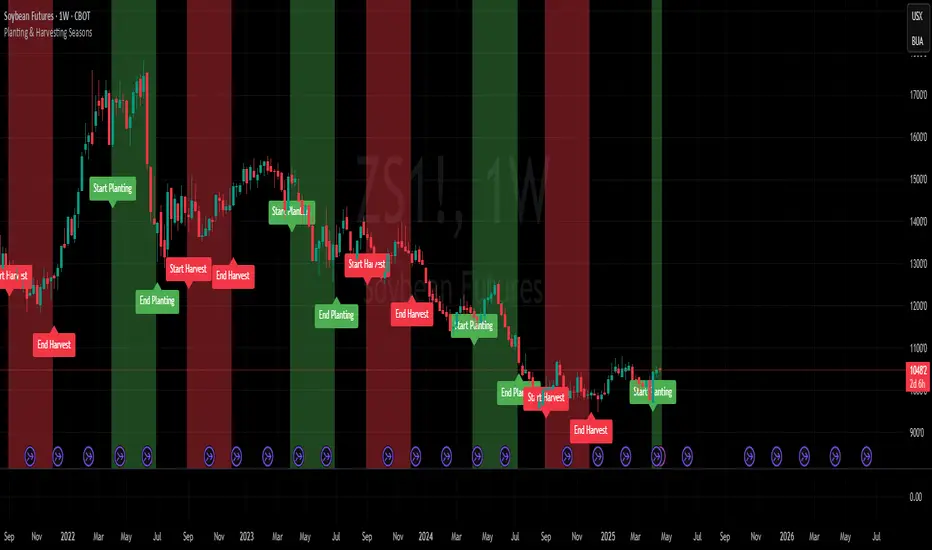
Planting & Harvesting SeasonsHello all,
as a commodity trader, I use a lot of seasonal patterns in my analysis. Some time ago, I came up with the idea to develop a simple script that visually overlays the typical planting and harvesting periods for key agricultural futures directly on the chart.
This script automatically detects the underlying commodity based on the symbol (e.g. ZC, ZW, ZS, CT) and displays color-coded zones for each seasonal window. These zones are based on historical crop calendars and help identify when planting or harvesting typically takes place. The goal is to better align technical setups with fundamental seasonal factors.
This is a basic version and meant as a visual aid — not a trading signal in itself.
Hope you enjoy it and any feedback is highly appreciated!
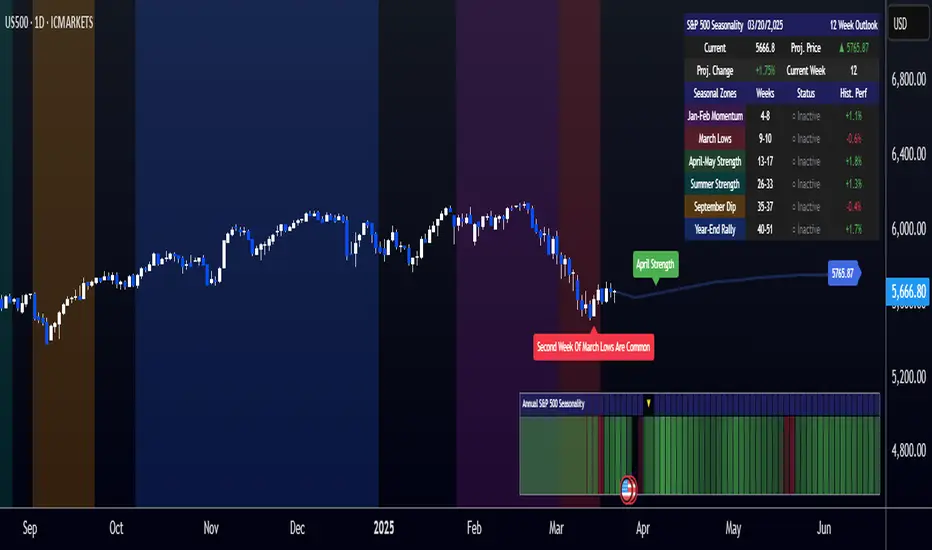
[COG]S&P 500 Weekly Seasonality ProjectionS&P 500 Weekly Seasonality Projection
This indicator visualizes S&P 500 seasonality patterns based on historical weekly performance data. It projects price movements for up to 26 weeks ahead, highlighting key seasonal periods that have historically affected market performance.
Key Features:
Projects price movements based on historical S&P 500 weekly seasonality patterns (2005-2024)
Highlights six key seasonal periods: Jan-Feb Momentum, March Lows, April-May Strength, Summer Strength, September Dip, and Year-End Rally
Customizable forecast length from 1-26 weeks with quick timeframe selection buttons
Optional moving average smoothing for more gradual projections
Detailed statistics table showing projected price and percentage change
Seasonality mini-map showing the full annual pattern with current position
Customizable colors and visual elements
How to Use:
Apply to S&P 500 index or related instruments (daily timeframe or higher recommended)
Set your desired forecast length (1-26 weeks)
Monitor highlighted seasonal zones that have historically shown consistent patterns
Use the projection line as a general guideline for potential price movement
Settings:
Forecast length: Configure from 1-26 weeks or use quick select buttons (1M, 3M, 6M, 1Y)
Visual options: Customize colors, backgrounds, label sizes, and table position
Display options: Toggle statistics table, period highlights, labels, and mini-map
This indicator is designed as a visual guide to help identify potential seasonal tendencies in the S&P 500. Historical patterns are not guarantees of future performance, but understanding these seasonal biases can provide valuable context for your trading decisions.
Note: For optimal visualization, use on Daily timeframe or higher. Intraday timeframes will display a warning message.
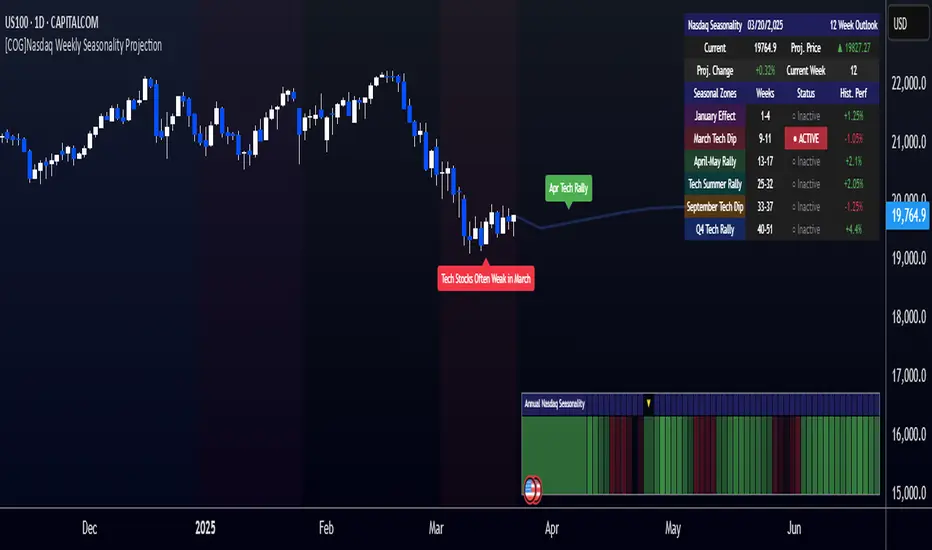
[COG]Nasdaq Weekly Seasonality ProjectionNasdaq Weekly Seasonality Projection
This indicator provides a visualization of Nasdaq seasonality patterns based on historical weekly performance data. It projects price movements for up to 26 weeks ahead, highlighting key seasonal periods that have historically affected tech stocks.
Key Features:
Projects price movements based on historical Nasdaq weekly seasonality patterns
Highlights six key seasonal periods: January Effect, March Lows, April-May Strength, Tech Summer Rally, September Dip, and Q4 Tech Rally
Customizable forecast length from 1-26 weeks with quick timeframe selection buttons
Optional moving average smoothing for more gradual projections
Detailed statistics table showing projected price and percentage change
Seasonality mini-map showing the full annual pattern with current position
Customizable colors and visual elements
How to Use:
Apply to Nasdaq indices or tech-focused instruments (daily timeframe or higher recommended)
Set your desired forecast length (1-26 weeks)
Monitor highlighted seasonal zones that have historically shown consistent patterns
Use the projection line as a general guideline for potential price movement
Settings:
Forecast length: Configure from 1-26 weeks or use quick select buttons (1M, 3M, 6M, 1Y)
Visual options: Customize colors, backgrounds, label sizes, and table position
Display options: Toggle statistics table, period highlights, labels, and mini-map
This indicator is designed as a visual guide to help identify potential seasonal tendencies in Nasdaq and tech stocks. Historical patterns are not guarantees of future performance, but understanding these seasonal biases can provide valuable context for your trading decisions.
Note: For optimal visualization, use on Daily timeframe or higher. Intraday timeframes will display a warning message.
Multi-Timeframe VWAP Master ProThe Multi-Timeframe VWAP Suite is a comprehensive and highly customizable indicator designed for traders who rely on Volume-Weighted Average Price (VWAP) across multiple timeframes and periods. This tool provides a complete suite of VWAP calculations, including daily, weekly, monthly, quarterly, yearly, and custom VWAPs, allowing traders to analyze price action and volume trends with precision. Whether you're a day trader, swing trader, or long-term investor, this indicator offers unparalleled flexibility and depth for your trading strategy.
Multi-Timeframe VWAPs:
Daily, Weekly, Monthly, Quarterly, and Yearly VWAPs: Track VWAP across various timeframes to identify key support and resistance levels.
Customizable Timeframes: Use the SMA timeframe input to adjust the period for moving averages and other calculations.
Previous Period VWAPs:
Previous Daily, Weekly, Monthly, and Quarterly VWAPs: Analyze historical VWAP levels to understand past price behavior and identify potential reversal zones.
Previous Year Quarterly VWAPs: Compare current price action to VWAP levels from specific quarters of the previous year.
Custom VWAPs:
Custom Start Date and Timeframe: Define your own VWAP periods by specifying a start date and timeframe, allowing for tailored analysis.
Dynamic Custom VWAP Calculation: Automatically calculates VWAP based on your custom inputs, ensuring flexibility for unique trading strategies.
Seasonal and Yearly VWAPs:
April, July, and October VWAPs: Analyze seasonal trends by tracking VWAP levels for specific months.
Yearly VWAP: Get a broader perspective on long-term price trends with the yearly VWAP.
SMA Integration:
SMA Overlay: Combine VWAP analysis with a Simple Moving Average (SMA) for additional confirmation of trends and reversals.
Customizable SMA Length and Timeframe: Adjust the SMA settings to match your trading style and preferences.
User-Friendly Customization:
Toggle Visibility and Labels: Easily enable or disable the display of specific VWAPs and their labels to keep your chart clean and focused.
Color Customization: Each VWAP line and label is color-coded for easy identification and can be customized to suit your preferences.
Dynamic Labeling:
Automatic Labels: Labels are dynamically placed on the last bar, providing clear and concise information about each VWAP level.
Customizable Label Text: Labels include detailed information, such as the timeframe or custom period, for quick reference.
Flexible Timeframe Detection:
Automatic Timeframe Detection: The indicator automatically detects new days, weeks, months, and quarters, ensuring accurate VWAP calculations.
Support for Intraday and Higher Timeframes: Works seamlessly on all chart timeframes, from 1-minute to monthly charts.
Previous Year Quarterly VWAPs:
Q1, Q2, Q3, Q4 VWAPs: Compare current price action to VWAP levels from specific quarters of the previous year.
User-Selectable Year: Choose the year for which you want to calculate previous quarterly VWAPs.
Persistent Monthly VWAPs:
Option to Persist Monthly VWAPs Year-Round: Keep monthly VWAP levels visible even after the month ends for ongoing analysis.
Comprehensive Analysis: Combines multiple VWAP timeframes and periods into a single tool, eliminating the need for multiple indicators.
Customizable and Flexible: Tailor the indicator to your specific trading strategy with customizable timeframes, periods, and settings.
Enhanced Decision-Making: Gain deeper insights into price action and volume trends across different timeframes, helping you make more informed trading decisions.
Clean and Organized Charts: Toggle visibility and labels to keep your chart clutter-free while still accessing all the information you need.
Ideal For:
Day Traders: Use daily and intraday VWAPs to identify intraday support and resistance levels.
Swing Traders: Analyze weekly and monthly VWAPs to spot medium-term trends and reversals.
Long-Term Investors: Leverage quarterly and yearly VWAPs to understand long-term price behavior and key levels.
Seasonal Traders: Track April, July, and October VWAPs to capitalize on seasonal trends.
The Multi-Timeframe VWAP Suite is a powerful and versatile tool for traders of all styles and timeframes. With its comprehensive suite of VWAP calculations, customizable settings, and user-friendly design, it provides everything you need to analyze price action and volume trends with precision and confidence. Whether you're looking to fine-tune your intraday strategy or gain a broader perspective on long-term trends, this indicator has you covered.

Window Seasonality IndicatorThis is a time window seasonal returns indicator. That is, it will provide the mean returns for a given time window based on a given number of lookbacks set by the user. The script finds matching time windows, e.g., 1st week of March going back 5 years or 9:00-10:00 window of every day going 50 days, and then calculates an average return for that window close price with respect to the close price in the immediately preceding time window, e.g. last week of February or 8:00-9:00 close price, respectively.
There are 4 input options:
1) Historical Periods to Average: Set the number of matching historical windows with which to calculate an average price. The max is 730 lookback windows. Note: for monthly or weekly windows, setting too large a number will cause the script to error out.
2) Use Open Price: calculates the seasonal returns using the open price rather than close price.
3) Show Bands: select from 1 Gaussian standard deviation or a nonparamateric ranked confidence interval. As a rough heuristic, the Gaussian band requires at least 30 lookback periods, and the ranked confidence interval requires 50 or more.
4) Upper Percentile: set the upper cutoff for ranked confidence interval.
5) Lower Percentile: set the lower cutoff for ranked confidence interval.
Please be aware, this indicator does not use rigorous statistical methodology and does not imply predictive power. You'll notice the range bands are very wide. Do not trade solely based on this indicator! Certain time windows, such as weekly and monthly, will make more sense applied to commodities, where annual cycles play a role in its supply and demand dynamics. Hourly windows are more useful in looking at equities markets. I like to look at equities with 1-hr windows to see if there is some pattern to overnight behavior or for market open and close.

RShar Seasonal RSISeasonal RSI
This indicator, Seasonal RSI, is designed to enhance trading decisions by combining the **Relative Strength Index (RSI)** with insights derived from historical **seasonality patterns**. It not only calculates RSI but also overlays seasonality data for the current week of the year, providing traders with a more contextualized view of market conditions.
---
### **Key Features**
#### 1. **Relative Strength Index (RSI) Calculation**
- The script calculates the RSI for a user-defined period (`RSI Length`), which is an oscillator used to measure the speed and magnitude of price changes.
- RSI values are plotted on the chart, helping traders identify **overbought** and **oversold** conditions.
- Thresholds for **Overbought** and **Oversold** levels are customizable, with default values of 70 and 30, respectively.
---
#### 2. **Dynamic RSI Coloring Based on Seasonality**
- The color of the RSI line dynamically adjusts based on historical **win rates** for the current week of the year:
- **Bright Green** for win rates > 65%.
- **Green** for win rates between 50-65%.
- **Red** for win rates between 35-50%.
- **Dark Red** for win rates < 35%.
- This feature gives traders a quick visual cue about whether the historical performance of the current week tends to be bullish, neutral, or bearish.
---
#### 3. **Overbought and Oversold Level Visualization**
- Overbought and oversold levels are displayed as dotted horizontal lines on the RSI chart.
- These levels act as visual guides for potential price reversals:
- **Overbought (default 70)**: Indicates potential selling pressure.
- **Oversold (default 30)**: Indicates potential buying pressure.
---
#### 4. **Seasonality Data Integration**
- Historical **seasonality data** is used to analyze price performance patterns for each week of the year:
- **Win Rate**: The percentage of years in which prices closed higher during the current week.
- **Average Weekly Change**: The average price percentage change during the current week over historical data.
- This data provides additional context to RSI readings, helping traders align their strategies with seasonal tendencies.
---
#### 5. **Information Table Overlay**
- A table is displayed in the **top-right corner** of the chart, summarizing seasonality data for the current week:
- **Week Win Rate**: Displays the percentage of historical years where prices rose during this week.
- **Avg Weekly Change**: Shows the average percentage price change for the current week. Positive values are displayed in green, and negative values are shown in red.
- This overlay provides actionable insights without cluttering the chart.
---
### **How It Works**
1. **Seasonality Data**:
- A function (`getSeasonalityForWeek`) fetches or uses predefined mock seasonality data for each week of the year.
- For each week, it calculates:
- The **Win Rate** (percentage of years with positive performance).
- The **Mean Change** (average price percentage change).
2. **RSI Plot**:
- The RSI line is plotted on the chart.
- The line's color is determined by the win rate for the current week, providing a visual representation of historical performance trends.
3. **Threshold Visualization**:
- Horizontal lines for overbought and oversold levels are drawn to assist in identifying potential reversal points.
4. **Information Table**:
- The table summarizes the current week's seasonality data for quick reference, helping traders make data-driven decisions.
---
### **Use Cases**
- **Short-Term Traders**:
Use the dynamic RSI colors and seasonality table to align short-term trades with historical patterns of weekly performance.
- **Swing Traders**:
Identify whether a stock or market is in an overbought/oversold condition while considering the seasonal tendency for the week.
- **Contextual Decision-Making**:
Combine traditional RSI signals with historical data to reduce false signals and improve timing.
---
### **Limitations**
- The script uses **mock seasonality data** in its default state. To make it fully functional, replace the mock data with actual historical performance metrics for your specific ticker or market.
- The indicator does not fetch real-time external data due to Pine Script’s limitations, so all seasonality data must be manually updated or hardcoded.
---
This indicator provides a powerful way to combine technical analysis with historical trends, offering a unique edge to traders by adding seasonal context to RSI signals.

Seasonality normalizedThis custom indicator provides an in-depth analysis of historical price performance to identify potential seasonal patterns and correlations. By examining data from the past 10 years, the indicator filters out outlier performances and focuses on the most consistent seasonal trends.
Key Features:
Intelligent Clustering Algorithm: The indicator employs a custom clustering algorithm to group similar yearly performances together. This approach effectively filters out anomalous years, such as those affected by black swan events like the COVID-19 pandemic, providing a more accurate representation of typical seasonal behavior.
Seasonal Correlation Measurement: The indicator calculates the percentage of years exhibiting similar performance patterns for each week. This measurement helps traders assess the strength of seasonal correlations and make informed decisions based on the consistency of historical data.
High and Low Seasonality Bands: The indicator plots two distinct bands on the chart, representing the expected range of price movement based on historical highs and lows. These bands offer valuable insight into potential support and resistance levels during specific weeks.
Enhanced Visualization: Weeks with high seasonal correlations are prominently highlighted, making it easy for traders to identify periods with the strongest historical patterns. The seasonality bands extend to cover the last and future 3 months, divided into weekly segments, providing a comprehensive view of the current market context.
Dynamic Adaptation: The seasonality bands are dynamically tied to the current high and low prices, ensuring that the indicator remains relevant and responsive to the latest market conditions.
Under the Hood:
The indicator begins by calculating the performance of the asset for each week, going back 10 years.
The custom clustering algorithm groups similar performances together, effectively filtering out outlier years.
The percentage of years falling into the largest performance cluster is calculated, representing the seasonal correlation for each week.
The average performance of the largest cluster is used to plot the high and low seasonality bands, anchored to the current high and low prices.
The bands are color-coded based on the strength of the seasonal correlation, with darker colors indicating higher consistency.
This indicator is designed to help professional traders identify and capitalize on seasonal patterns in the market. By providing a robust and adaptable framework for analyzing historical performance, the Seasonality Indicator offers valuable insights for making informed trading decisions.
We believe this tool will be a valuable addition to your trading arsenal, complementing your existing strategies and enhancing your market analysis capabilities. As a professional trader, your feedback and ideas are invaluable to us. Please share your thoughts, experiences, and suggestions for improvement as you incorporate the Seasonality Indicator into your trading workflow. Together, we can refine this powerful tool to better serve the needs of the trading community.
Season ChartThis overlay is built on the idea of seasonal charts.
It is constructed by taking the percentage change from each close and recording that change for every trading day of any year that is within the sample. We then take the average for each day of all the years.
These averages are then cumulated to create the chart as per traditional seasonal chart construction.
I have also taken a trimmed mean of the averages to try and dampen the impact one off moves that may have a dramatic effect on the daily averages (for example the crash to $0 in oil in April 2020) however, even removing 10% may not guarantee one off moves won’t affect the average.
The construction of the chart is completely dependent on the data provided by TradingView and so it is recommended that if longer sample sizes are used, the user go back to check that the years contained within the sample have a full history. Some data may have large gaps in their history and this can distort the seasonality readings.
I have attempted to align the chart with the first trading day of the year, but the start of some months may be out by a day or two as it becomes difficult to track all weeks with differing market holidays closures each year and this in turn varies the total amount of actual trading days in each year as well as leap years.
This overlay is designed for the Daily time frame only and will not work on Crypto or any other instrument that trades outside of usual business weekdays. Future updates may include the ability to adapt to Crypto instruments.
All feedback and comments welcome!

Seasonality Widget [LuxAlgo]The Seasonality Widget tool allows users to easily visualize seasonal trends from various data sources.
Users can select different levels of granularity as well as different statistics to express seasonal trends.
🔶 USAGE
Seasonality allows us to observe general trends occurring at regular intervals. These intervals can be user-selected from the granularity setting and determine how the data is grouped, these include:
Hour
Day Of Week
Day Of Month
Month
Day Of Year
The above seasonal chart shows the BTCUSD seasonal price change for every hour of the day, that is the average price change taken for every specific hour. This allows us to obtain an estimate of the expected price move at specific hours of the day.
Users can select when data should start being collected using the "From Date" setting, any data before the selected date will not be included in the calculation of the Seasonality Widget.
🔹 Data To Analyze
The Seasonality Widget can return the seasonality for the following data:
Price Change
Closing price minus the previous closing price.
Price Change (%)
Closing price minus the previous closing price, divided by the
previous closing price, then multiplied by 100.
Price Change (Sign)
Sign of the price change (-1 for negative change, 1 for positive change), normalized in a range (0, 100). Values above 50 suggest more positive changes on average.
Range
High price minus low price.
Price - SMA
Price minus its simple moving average. Users can select the SMA period.
Volume
Amount of contracts traded. Allow users to see which periods are generally the most /least liquid.
Volume - SMA
Volume minus its simple moving average. Users can select the SMA period.
🔹 Filter
In addition to the "From Date" threshold users can exclude data from specific periods of time, potentially removing outliers in the final results.
The period type can be specified in the "Filter Granularity" setting. The exact time to exclude can then be specified in the "Numerical Filter Input" setting, multiple values are supported and should be comma separated.
For example, if we want to exclude the entire 2008 period we can simply select "Year" as filter granularity, then input 2008 in the "Numerical Filter Input" setting.
Do note that "Sunday" uses the value 1 as a day of the week.
🔶 DETAILS
🔹 Supported Statistics
Users can apply different statistics to the grouped data to process. These include:
Mean
Median
Max
Min
Max-Min Average
Using the median allows for obtaining a measure more robust to outliers and potentially more representative of the actual central tendency of the data.
Max and Min do not express a general tendency but allow obtaining information on the highest/lowest value of the analyzed data for specific periods.
🔶 SETTINGS
Granularity: Periods used to group data.
From Data: Starting point where data starts being collected
🔹 Data
Analyze: Specific data to be processed by the seasonality widget.
SMA Length: Period of the simple moving average used for "Price - SMA" and "Volume - SMA" options in "Analyze".
Statistic: Statistic applied to the grouped data.
🔹 Filter
Filter Granularity: Period type to exclude in the processed data.
Numerical Filter Input: Determines which of the selected hour/day of week/day of month/month/year to exclude depending on the selected Filter Granularity. Only numerical inputs can be provided. Multiple values are supported and must be comma-separated.

Seasonal Tendencies - SMC IndicatorsA Seasonal Tendency refers to a historical price action behaviour that tends to repeat during specific times of the year, month over month.
It's a roadmap to navigate price action on the daily chart to help determine the medium to long-term bias.
Seasonal Tendencies are NOT an exact prediction of future price action but rather serve as a guideline for spotting high-probability opportunities when combined with other elements of SMC Price Action analysis, such as Order Blocks, Fair Value Gaps, etc...
The Seasonal Tendencies Indicator has been tested to match what ICT has taught in his lectures. It can be applied to any Market or Asset. However, it's limited by the maximum number of years available on tradingview.
Traders can use this Seasonal Tendencies indicator to support their already existing analysis as an added confirmation tool. This indicator should not be used as a main reason to enter a trade idea.
The Seasonal Tendencies Indicator can be used in 2 ways:
1) To look for potential points of long-term reversals during specific times of the year.
2) To look for confirmation and align with an existing long-term trend.
So how does it work?
The Seasonal Tendencies Indicator takes the averages of the last 30, 10, and 5 years' prices by default and compares them to the current year's price action (Green Line).
However, the number of years chosen for the averages can be modified in the indicator's setting.
When looking at the historical price action lines, generally, the price tends to make the lows and highs during specific times of the year.
Note that we should not look at the exact dates these lows and highs form, but we take time periods conceptually instead.
In the example below, the SP500 5-year average made the low on 14 March, and the SP500 10-year average made the low on 23 March.
This gives us the idea that "generally" SP500 makes the low of the year around the 2nd to 3rd week of March every year.
So, IF the trader's analysis was pointing out that SP500 is Bullish, then we use the information that we derived from the Seasonal Tendencies Indicator to look for long setups around the 2nd to 3rd week of March for medium to long-term swing trades.
The Seasonal Tendencies Indicator can also be useful for day traders as it helps support their daily bias to look for trades within the direction of the higher timeframe trend.
How do we measure the strength of the Seasonal Tendencies?
When using the Seasonal Tendencies Indicator, it's important to look for periods where the averages converge and get closer to each other. This usually indicates that during those specific periods, there is a high probability for the price to behave in a certain way.
So the closer the averages are to each other, the more likely the price would respect the Seasonal Tendencies.
Bonus Feature
Premium Discount Range
As a bonus feature, split the Seasonal Tendencies Indicator's Range into 4 quarters to indicate when the price is at a Premium (above the 50% level in Red) and when the price is at a Discount (below the 50% level in blue).
Each Premium and Discount range is also split into 2 halves.
Those levels can also be used to identify potential turning points when comparing the Current Year's price positioning in the Yearly Range to historical price action.
As you can see from the example below, most major turning points happen at around key price levels.

Time Cycles IndicatorThis script is used to analyze the seasonality of any asset (commodities, stocks, indices).
To use the script select a timeframe D or W and select the months you are interested in the script settings. You will see all the candles that are part of those months highlighted in the chart.
You can use this script to understand if assets have a cyclical behavior in certain months of the year.

Seasonality Chart [LuxAlgo]The Seasonality Chart script displays seasonal variations of price changes that are best used on the daily timeframe. Users have the option to select the calculation lookback (in years) as well as show the cumulative sum of the seasonal indexes.
🔶 SETTINGS
Lookback (Years): Number of years to use for the calculation of the seasonality chart.
Cumulative Sum: Displays the cumulative sum of seasonal indexes.
Use Percent Change: Uses relative price changes (as a percentage) instead of absolute changes.
Linear Regression: Fits a line on the seasonality chart results using the method of least squares.
🔶 USAGE
Seasonality refers to the recurrent tendencies in a time series to increase or decrease at specific times of the year. The proposed tool can highlight the seasonal variation of price changes.
It is common for certain analysts to use a cumulative sum of these indexes to display the results, highlighting months with the most significant bullish/bearish progressions.
The above chart allows us to highlight which months prices tended to have their worst performances over the selected number of years.
🔹 Note
Daily price changes are required for the construction of the seasonal chart. Thus, charts using a low timeframe might lack data compared to higher ones. We recommend using the daily timeframe for the best user experience.
🔶 DETAILS
To construct our seasonal chart, we obtain the average price changes for specific days on a specific month over a user-set number of years from January to December. These individual averages form "seasonal indexes."
This is a common method in classical time series decomposition.
Example:
To obtain the seasonal index of price changes on January first we record every price change occuring on January first over the years of interest, we then average the result.
This operation is done for all days in each month to construct our seasonal chart.
Seasonal variations are often highlighted if the underlying time series is affected by seasonal factors. For market prices, it is difficult to assess if there are stable seasonal variations on all securities.
The consideration of seasonality by market practitioners has often been highlighted through strategies or observations. One of the most common is expressed by the adage "Sell in May and Go Away" for the US market. We can also mention:
January Effect
Santa Claus Rally
Mark Twain Effect
...etc.
These are commonly known as calendar effects and appear from the study of seasonal variations over certain years.

Seasonal pivot datesPlots approximate equinox and solstice dates, which are often zones around which market pivots occur.

ILM Seasonality Monthly - Day of Month - Tabular FormUse this indicator on Daily Timeframe
This indicator displays the seasonality data for any instrument (index/stock/ futures /currency) in a tabular data by day of the month (Day 1..31).
User can change the start of the year and month for analysis from the inputs.
Year is represented in rows and Day of the month (Day) is represented in cols.
This indicator uses Daily Data feed to calculate the % change
Summary data for Day of month is displayed at the bottom of the table

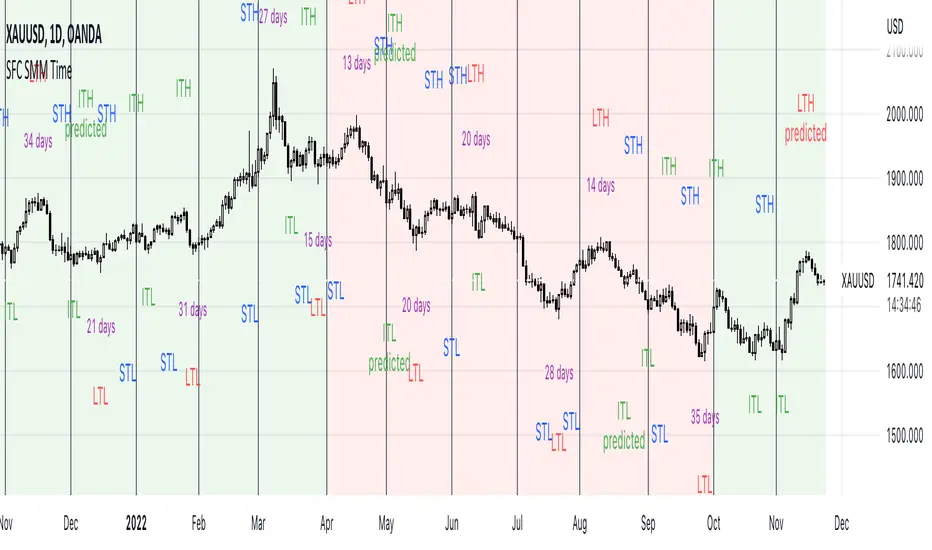
SFC Smart Money Manipulation - Time, Advanced Market StructureThis indicator shows the market structure in more advanced way and different time cycles.
Markets moves in cycles and swings. The indicator will help to determine these cycles and swings by time and price. These are the two columns of the market understanding. The third one is volume/ momentum, but it will not be discussed here.
Advanced Market Structure
According to ICT and Larry Williams Market Structure is not only Highs and Lows.
They present more advanced understanding of the MS:
-Short Term Highs/ Lows
-Intermediate Term Highs/ Lows
-Long Term Highs/ Lows
Rules of how to determine the Swing Points according to Larry Williams:
"A market has made a short-term low when we have a day (or bar if you are using different time periods) that has a higher low on both sides. By the same token a short-term high will be a day (or bar) that has lower bars on both sides of it."
"A short-term high with lower short-term highs on both sides is an intermediate- term high. By the same token, a short-term low with higher short-term lows on both sides is an intermediate-term low."
"An intermediate-term high with lower intermediate-term highs on both sides of it is just naturally a long-term high by our definition, thanks to understanding market structure.
An intermediate-term low with higher intermediate-term lows on both sides of it is just naturally a long-term low by our definition, thanks to understanding market structure."
If the Highs and Lows are labeled properly there is high probability to predict the next High or Low. In this way the trader will know how the current trend is changing and what kind of retracement is coming - deep or shallow.
Timing
Market moves in time cycles.
There is a theory that the swings are equal by time and length. This is not always the case, but very very often.
Indicator time features:
- Swing Trading days - how many time market needed to form a swing. Only Long term(main) Swings are measured. This will help trader to label T-formations.
" T Formations is cyclically related for formations that can be drawn to project the time frame of likely turning points. Basically T-formations are based on the concept that the time distance between the starting low/high of the cyclical wave and its peak is likely to be subsequently repeated between that peak and the final low/high of that cycle."
- Seasonality - theoretically an asset should go up or down in particular yearly quarter. Practically the direction not always match to quarters. Thats why the indicator shows the theoretical seasonal direction and historical real direction.
Seasonal direction is automatically displayed or XAUUSD, XAGUSD, EURUSD, AUDUSD, GBPUSD. There is a ways to set the seasonality manually.
- Earnings Season - This time is very important for Stocks and Indices. Most of the time the assets are in bullish trend during the Earnings Seasons.
- Monthly separator - Shows the monthly time cycle
- Gold bullish months - There are studies on Gold market. They shows that Gold is very bullish in particular months. These are displayed.
The indicator works only on Daily Time Frame.
ILM Seasonality Big Moves - TableUse this script on Daily Timeframe.
This script calculates Daily Moves ( Intraday / Close basis ) and buckets them into 1% / 2% / 3% moves
Also calculates MAX DD for the financial year from Peak to Trough
Helps in identifying volatility of the instrument and high drawdowns due to volatility
