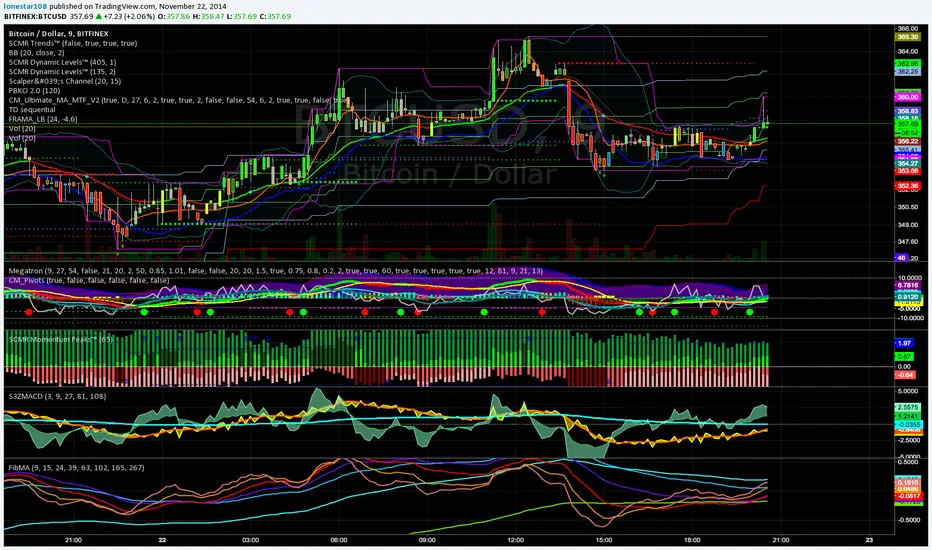
PhiMACDHere is a modified moving average which uses phi as the scaling interval between moving average periods. Each MACD line is derived by determining EMAs for 8 period frames, each of which is related to the other proportionally by phi, and calculating each line by comparing it against its immediate predecessor. Actual period values are 9 15 24 39 63 102 165 and 267
"豪24配债" için komut dosyalarını ara
Breakdown OscillatorThis is an indicator I made, based on the observation that the longer the price action hugs the bottom bollinger band, the greater the danger of a breakdown occurring (price decline). Essentially its a moving average of the difference between close price and the bottom bollinger band, divided by the bottom bollinger band; I like to use 1.5 standard deviations for the 20 day bollinger band. When it crosses below zero there is increased danger of a breakdown, although of course it could turn right around and go up again. In fact if it does turn around sharply from near zero it can be a good time to buy in the context of a pullback within an uptrend. I also have included the 'slope factor' which makes the indicator more negative based on the rate of downward movement of the bollinger moving average (set to 0 to omit this modification). The indicator can be used just for exits or can be used for entry signals when crossing over the green bar if desired. In the example chart you can see the price hitting the lower band or crossing below the 50dMA plenty of times on the way up while the indicator says to hold tight. When the breakdown comes its after a prolonged period of low volatility (band squeeze) on the lower side of the moving average so the signal comes quickly - they won't all be this good of course. This indicator can also be used to help spot potential shorting candidates.
This indicator also works well on weekly charts; I like the 1 standard deviation with 16 to 24 week long period, 6 to 10 week short period and 30 buy level. Your mileage may vary, please do your own research.

TheLark: Directional Movement Index StochasticThere is a nice writeup about a system that uses DMISTO here, which includes decent statistics:
traderedge.net
I have not yet done any back testing on the system as a whole myself, but thought the DMISTO was an interesting indicator, so ported it over for those who might want to play with it and create their own systems. I added dots that denote signals similar to the system described above, which can be turned off if desired.

BTC HistoricMerged Bitstamp and Mt Gox precrash data.
To use you will need to use any chart with a start time before 7/2010. You will need this to see all the data otherwise it will get cut off. Publishing ideas using this indicator will spam some other symbol so I would not recommend doing so (sorry XAUUSD).
Click the "eye" button next to the primary security to hide it.
Make sure the indicator scale is set to "Right".
Right click on the right axis, and uncheck "Scale Series Only"
Note: Since this is going to be overlayed onto another chart it will likely be missing weekend data. If anyone knows of a current chart that is 24/7 that has data prior to July 2011 please leave a comment.
You can tweak the price weight between Gox and Stamp and the point when the data starts to blend to the time when Gox went off a cliff.
- Key date values:
1377 is Jan-6-2014
1385 is Jan-15-2014 (default)
1337 is about the ATH (coincidentally)
1192 is July-5-2013
--- Custom indicators for historic data:
I updated to the latest versions
- BTC Historic RSI
pastebin.com
created by @debani (www.tradingview.com)
original here:
- BTC Histroric Willy
pastebin.com
original indicator by @CRInvestor (www.tradingview.com)
created by @flibbr (www.tradingview.com)
original here:
- BTC Historic Ichimoku
pastebin.com
thanks to @flibbr, @debani for the indicators
Let me know if you have questions, comments.

3 new Indicators - PGO / RAVI / TIIMy "to-publish" list is getting too big, so decided to push out 3 indicators in the same chart
Feel free to "make mine" and use :) Leave a comment on what you think.
Pretty Good Oscillator
----------------------------------------
This indicator, by Mark Johnson, measures the distance of the current close from its N-day simple moving average, expressed in terms of an average true range (see Average True Range) over a similar period. So for instance a PGO value of +2.5 would mean the current close is 2.5 average days' range above the SMA.
Johnson's approach was to use it as a breakout system for longer term trades. If the PGO rises above 3.0 then go long, or below -3.0 then go short, and in both cases exit on returning to zero (which is a close back at the SMA). Indicator marks all these areas (3/-3/0)
Rapid Adaptive Variance Indicator
---------------------------------------------------------
RAVI is a simple indicator, by Tushar Chande, to show whether a stock is trending or not. Unlike ADX, RAVI measures only the trend intensity, it doesn't distinguish which way the trend is going. Rising RAVI shows the beginning of a trend or an increase in trend intensity, a decreasing slope signifies decreasing intensity. Also, RAVI often reacts more quickly and exhibits a more pronounced curve than ADX.
The standard values for daily charts are 7 and 65. For hourly charts, the most common averaging periods are 12 and 72 or 24 and 120.
The signal lines suggested are from +/- 0.3% to +/-1%. I haven't added any markings as these signals are instrument-specific. I suggest doing some back testing and adding these accordingly.
Trend Intensity Index
--------------------------------------
TII, by M. H. Pee, measures the strength of a trend, by looking at what proportion of the past "n" days prices have been above or below the level of today's "x"-day simple moving average. You can configure "n" via options page. "x" is calculated as "2 times n".
TII moves between 0 and 100. A strong uptrend is indicated when TII is above 80. A strong downtrend is indicated when TII is below 20.
Pee recommended entering trades when levels of 80 on the upside or 20 on the downside are reached. Indicator marks these lines for easy reference.
