ApopheniaPays Crossing detector & 2-field date/time entryYou specify a horizontal line by value, start date/time, and end date/time, and choose a data source (bar close is the default) and it will label count how many times that source crosses that line between those dates/times.
Enter the start and end dates for your horizontal line as MMDDYY and HHMM (24 hour time).
: Jan 17, 2020 would be 11720 (properly it would be 011720, but Pine inputs delete leading 0s).
: November 17, 2020 would be 110720.
: 8:30 AM would be 0830.
: 8:30 PM would be 2030.
Remember to enter the right time zone.
I believe nobody else has published a 2-input date/time picker on TV, at least the last time I checked they hadn't, they all make you input M,D,Y,H,M as separate fields. Ugh!
If you use any parts of this code, please credit me. If somehow you happen to make a lot of money using this code, please think about what a fair share would be to pay me for my help, then give that amount to a worthwhile charity.
"豪24配债" için komut dosyalarını ara

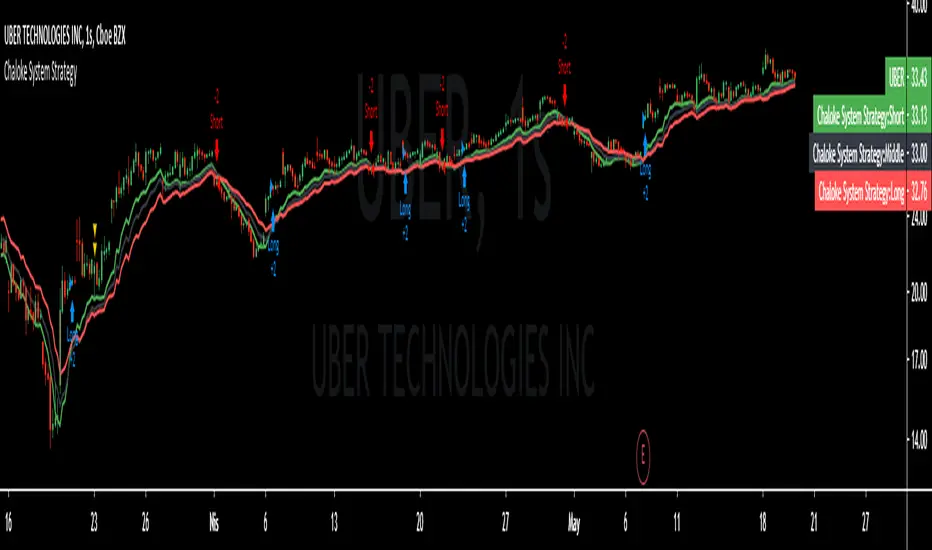
Chaloke System StrategyChaloke System Strategy
This is a trend indicator
Atr and 3 moving averages are used
Short 9-day moving average,Medium 15-day moving average,Calculated with a long 24-day moving average.
Atr period : 5
Sht,Mid,Lng calculation method is different
Buying Strategy
long = crossover(Sht,Mid) and close > Sht
Selling Strategy
short = crossunder(Sht, Lng ) or close < Lng
Buy should be done when the barcolor turns green
Sell should be done when barcolor is red
When the barcolor is black, there may be change.
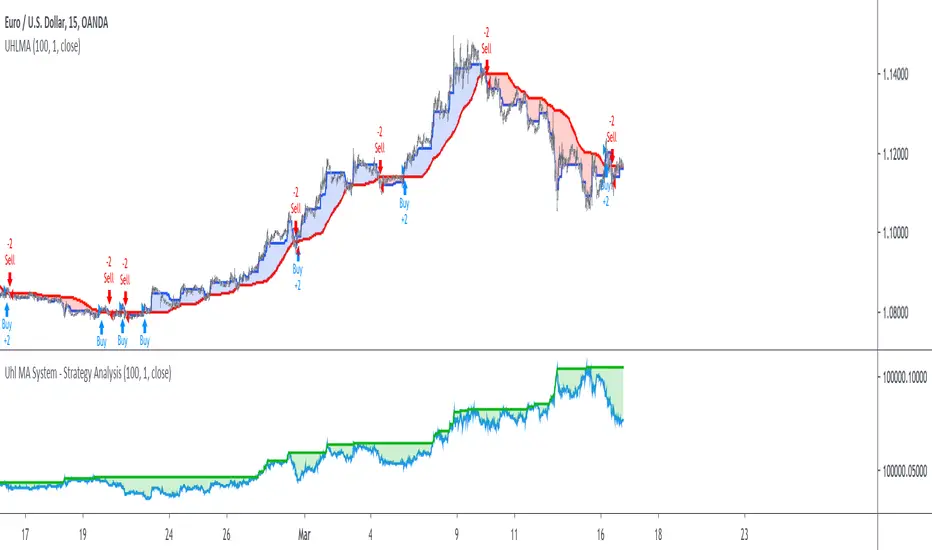
Uhl MA System - Strategy AnalysisThe Uhl MA crossover system was specifically designed to provide an adaptive MA crossover system that didn't committed the same errors of more classical MA systems. This crossover system is based on a fast and a slow moving average, with the slow moving average being the corrected moving average (CMA) originally proposed by Andreas Uhl, and the fast moving average being the corrected trend step (CTS) which is also based on the corrected moving average design.
For more information see :
In this post, the performances of this system are analyzed on various markets.
Setup And Rules
The analysis is solely based on the indicator signals, therefore no spread is applied. Constant position sizing is used. The strategy will be backtested on the 15 minute time-frame. The mult setting is discarded, the default setting used for length is 100.
Here are the rules of our strategy :
long: CTS crossover CMA
short: CTS crossunder CMA
Results And Data
EURUSD:
Net Profit: $ 0.08
Total number of trades: 99
Profitability: 35.35 %
Profit Factor: 1.834
Max Drawdown: $ 0.01
EURUSD behaved pretty well, and was most of time showing long term trends without exhibiting particularly tricky structures, the moving averages still did cross during ranging phases, since march 9 we can see a downtrend with more pronounced cyclical variations (retracements) that could potentially lead to loosing trades.
BTCUSD:
Net Profit: $ 4371.57
Total number of trades: 94
Profitability: 32.98 %
Profit Factor: 1.749
Max Drawdown: $ 1409.96
The strategy didn't started well, producing its largest drawdown after only a few trades, the strategy still managed to recover. BTCUSD exhibited a strong downtrend, the strategy profited from that to recover, signals still occurred on ranging phases, and where mostly caused by a short term volatile move, unfortunately the CMA can converge toward ranging/flat price zones where false signals might occur at higher frequency.
AMD:
Net Profit: $ 16.09
Total number of trades: 95
Profitability: 29.47 %
Profit Factor: 1.288
Max Drawdown: $ 20.11
On AMD the strategy started relatively well with a raising balance, then the balance quickly fallen, this downtrend in the balance lasted quite some time (almost 48 trades), the strategy finally recovered in Nov 2019 and the balance made a new highest high at the end of February. AMD had numerous trends during the backtesting period, yet results are poor.
AAPL:
Net Profit: $ -28.17
Total number of trades: 89
Profitability: 28.09 %
Profit Factor: 0.894
Max Drawdown: $ 63.21
AAPL show the poorest results so far, with a stationary balance around the initial capital (in short the evolution of the balance is not showing any particular trend and oscillate around the initial capital value).
AAPL had some significant retracements in its up-trend, which triggered some trades (of course), and the ranging period from Jan 24 to Feb 13 heavily damaged the strategy performance, generating 6 significant loosing trades. AAPL show the worst results so far, mostly due by ranging phases.
Conclusions
The Uhl MA crossover system strategy has been tested and based on the results don't show particularly interesting performances, and might even be outperformed by simpler MA systems that prove to be more robust against ranging markets. The total number of executed trades are on average 94, and the profitability is on average 31%. The strategy might prove more interesting if we can correct the behavior of the CMA, who sometimes converged toward ranging/flat markets.
FRAMA - Supertrend strategyFRAMA Strategy
I found this strategy on internet, in a well-known forex forum.
I have translated the two indicators mentioned in that strategy (originally in mq4) in pine script.
Thanks to Fractured and Shizaru for the FRAMA snippets, to mejialucas for Supertrend snippet, to JayRogers for trade management snippet and to Trost for backtesting snippet.
I also added some code to have FRAME with a deiiferent timeframe
Indicators set-up:
FRAMA period 24 (it was originally 25 but it's better to use an even number)
FRAMA timefarme lower then chart timeframe (e.g. daily chart and weekly FRAMA)
Supertrend indicator as it is.
Of course, it is better to adapt above setting to traded instrument.
Long/Buy rules:
1 - Enter at crossover between FRAMA and its signal
2 - Option to filter entries based on supertrend signal
3 - Exit when Supertrend change direction;
4 - Exit long when short signal occurs;
Short/Sell rules:
1 - Enter at crossunder between FRAMA and its signal
2 - Option to filter entries based on supertrend signal
3 - Exit when Supertrend change direction;
4 - Exit short when long signal occurs;
VERY IMPORTANT NOTE: this is a trend following strategy, so the target is to stay in the trade as much as possible (drawdown my be high). If your trading style is more focused on scalping and/or pullbaks, this strategy is not for you.
Credits to who developed this startegy (google it).
Thanks to all pinescripters mentined in the code for their snippets.
I have also a study with alerts.
Please use comment section for any feedback or contact me if you need support.

Montly 48/36/24/12 SMA and 48/30/20/10/5 EMA on 1D bars.This indicator is based on a combination of the popular SMA and EMA indicator.
The indicator is intended for use on a chart with 1 day candles and at stock exchange with a maximum history of prices.
The intervals of values are selected so that the chart with candles for 1 day contains information about the 48-month EMA and SMA, which is currently the highest available on the history. Price values between 48 MA's are highlighted in red. This is of great importance and the area between MA and MA is a strong support which may indicate market bottoms.
The borders of the decorated zones can be used as pivot points. Price trend may change when approaching the border of the zone. If the price has passed the zone, then the movement may continue.

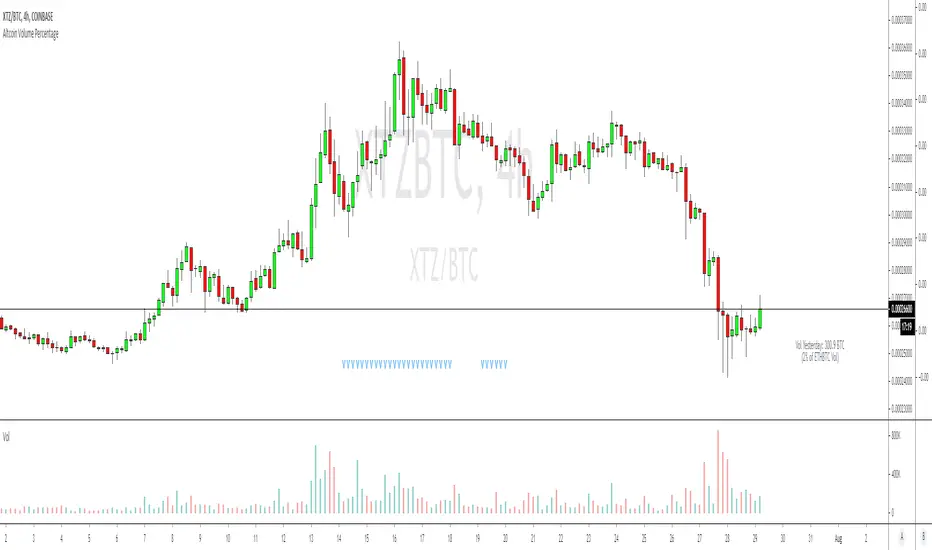
Altcoin Volume StatsShows how much BTC volume an alt has done in the past 24 hours as a label, with a comparison of that volume versus ETHBTC on Binance, as a percentage. Something I have been hoping the good people at Tradingview would add to the interface for years. It also shows some other stats in the data window on the right: i.imgur.com
Big thanks to the talented @Daveatt who helped unbake my noodle with some label code I couldn't figure out.
MA 12, MA 24, RSI OB-OS, CCI by WP@SITechDeveloped by Worachart Pirunruk, MD - Siam Intelligence Technology
This is the signal that generates based on 4 Technical Analysis Tools:
1. SMA 12,
2. SMA 26,
3. RSI 14,3,3
4. CCI
Signal to Buy/Long when the RSI below Dynamic oversold line based on close price back 60 bars.
Parameter. This signal doesn't have to best TP point, I'm working on improvement, now. Btw, don't forget to calculate you Margin Level. I'll teach you guys later of how to calculate.
Have fun Trading guys, and don't forget to give back to others. Because, Giving is Receiving."
WP@SITech

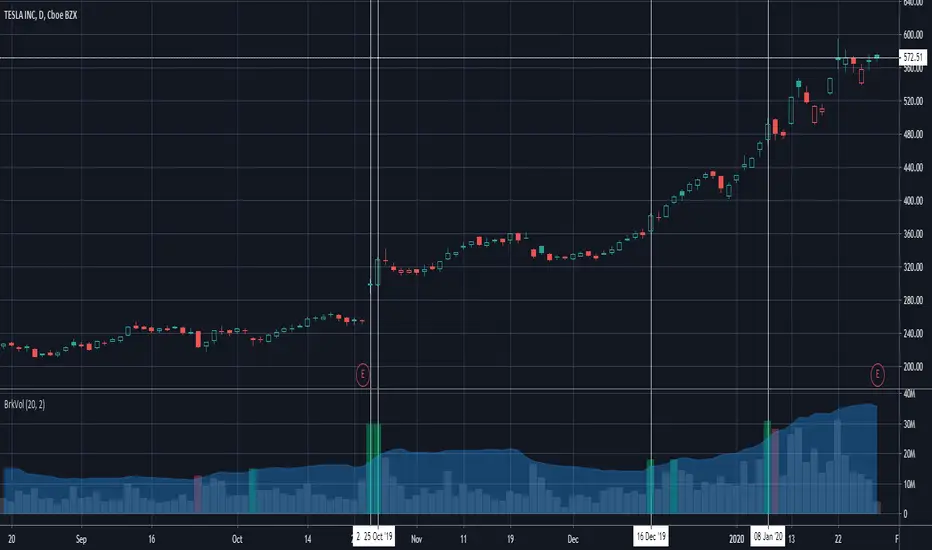
Breakout Volume Can Help Confirm Other SignalsVolume can help confirm signals we might discover using other methods of technical analysis.
This indicator tracks volume intelligently. Its logic spots above-average turnover and then tests against the price change. BrkVol highlights sessions with heavy volume and directional moves. This can help take out the noise and help confirm the trend.
Tesla is a classic example of this, with the stock rallying after showing heavy-volume gains on October 24- 25, December 16 and January 8.
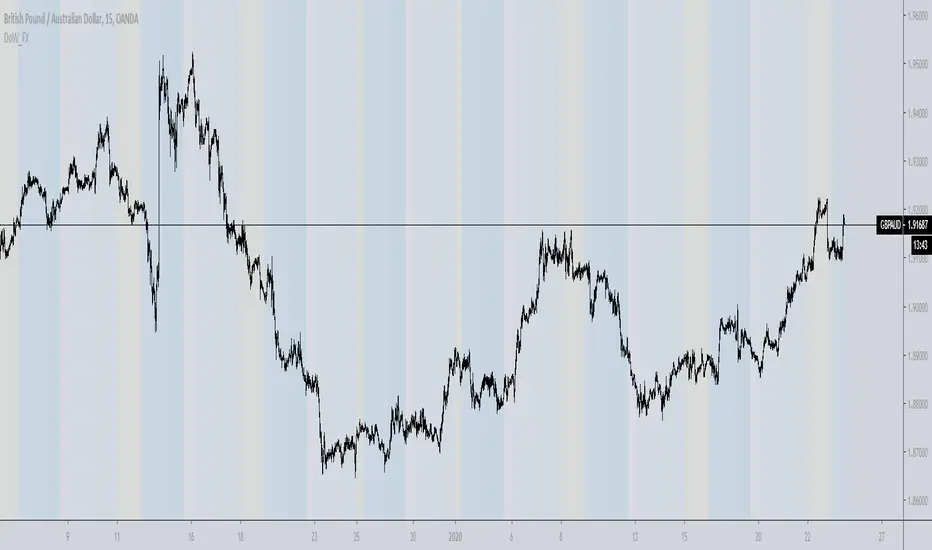
Day of week, Forex FixCalendar to work on instruments that trade a 24 hour day like crypto and forex, also does not display if you are above an intraday time. Main tweak was to end the trading day at 0000 (midnight) instead of 1700 (5pm) NYC time.
This update is geared towards Forex traders, which is why I chose to highlight Wednesday in yellow since that is commonly thought of as a midweek reversal point.
@airscape built a good calendar indicator based on the work of @ChrisMoody, this is really an update to their work and directed towards FX and Crypto
airscape:
ChrisMoody:
Future development:
Toggle for light and dark themes
Adjustment/offset for DLST and local vs/ server time
Additional color bands to denote Asian/London/NYC sessions?
Text label for days instead of color option?
Clean up the code and simplify
Detect Sequential Trading - Bot DetectorDetect Sequential Trading - Bot Detector.
This tool requires access to volume data .
There are many trading bots out there, that trade 24/7 .
The detector can be used to understand how the bots are configured - to push the market up or down .
Alerts can be set to fire whenever a bot pattern is detected .
They must be configured to run Once per Bar .
It works well with range charts (1R) .
It would work best on 1 second charts or tick charts (currently, TradingView's alert system doesn't work with second charts).
The alternative would be 1 minute charts .
It can be used on higher timeframes but may be less effective.

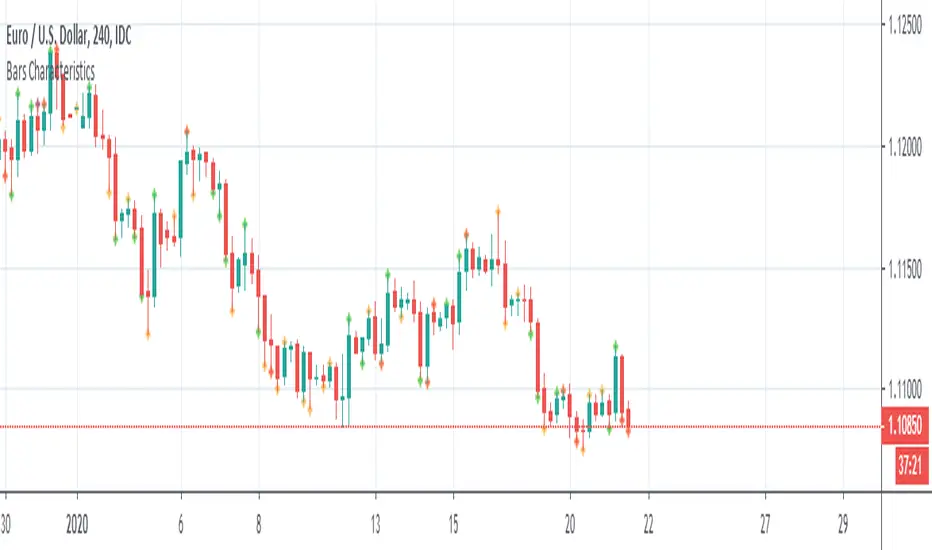
Bars CharacteristicsThis code is for defining or explaining market conditions via micro trend and the characterized bars.
lines 5,6: show the conditions for a normal trend, means market can go in the direction that it has in the past.
lines 11,12: show the conditions for kind of the trend having cumulative energy itself, mean market can go in the same direction.
lines 18,19: show the conditions for kind of the trend having overbought/sold concept, means it's better exit from the market or to look for the other clues.
lines 24,25: show some kind of noise not a stable trend, it's better not to enter the market.
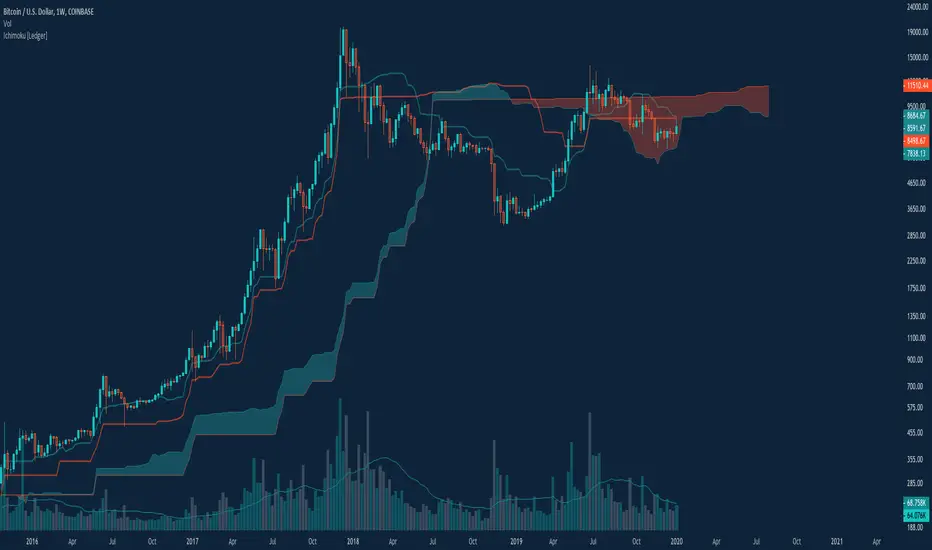
Ichimoku Cloud with Presets [Ledger]This is not too innovative, but I look at cloud setups with single and doubled settings, using both the traditional inputs for legacy markets, and "24/7" formatted inputs initially established by my friend CarpeNoctom and popularized for crypto markets. This makes those inputs a toggle that's easy to adjust. That's about it. Otherwise, it's the classic Ichimoku cloud. This is a fork of 's iteration, with my own flare and some minor adjustments. I have some ideas I would eventually like to include with this, but I've been using it this way for a long time and figure I should publish it.
Ichimoku [Gu5]Original Ichimoku Kinko Hyo created by Goichi Hosoda 1930
Knowing how to interpret the Ichimoku indicator can be complicated. I hope this version is more intuitive
Use Ichimoku to determine the trend of the day
When the market is above the cloud, and Tenkan (green line) crosses over Kijun (red Line), there is a Bullish Trend . When Tenkan crosses under Kijun, the trend ends.
When the market is under the cloud, and Tenkan crosses under Kijun; There is a Bearish Trend . When Tenkan crosses over Kijun, the trend ends.
When the market crosses the cloud (orange bars), there is no trend
The default setting is 9, 26 and 52. For cryptocurrencies (24/7 market), you can change it to 10, 30 and 60 periods.
///
Ichimoku Kinko Hyo fue creado por Goichi Hosoda en 1930
Saber interpretar al indicador Ichimoku puede ser complicado. Espero esta version sea mas intuitiva
Use Ichimoku para determinar la tendencia del día, y operar solo a favor de la misma
Cuando el mercado esta sobre la nube y Tenkan (linea verde) cruza sobre Kijun (linea roja), la tendencia es alcista. Cuando Tenkan cruza bajo Kijun, termina la tendencia.
Cuando el mercado esta bajo la nube y Tenkan cruza bajo Kijun, la tendencia es bajista. Cuando Tenkan cruza sobre Kijun, termina la tendencia.
Cuando el mercado atraviesa la nube (barras naranjas), no hay tendencia
Por defecto, el seteo es 9, 26 y 52. Para criptomonedas, puede cambiarlo a 10, 30 y 60 períodos

Smart labelling - Candlestick FunctionOftentimes a single look at the candlestick configuration happens to be enough to understand what is going on. The chandlestick function is an experiment in smart labelling that produces candles for various time frames, not only for the fixed 1m, 3m , 5m, 15m, etc. ones, and helps in decision-making when eye-balling the chart. This function generates up to 12 last candlesticks , which is generally more than enough.
Mind that since this is an experiment, the function does not cover all possible combinations. In some time frames the produced candles overlap. This is a todo item for those who are unterested. For instance, the current version covers the following TFs:
Chart - TF in the script
1m - 1-20,24,30,32
3m - 1-10
5m - 1-4,6,9,12,18,36
15m - 1-4,6,12
Tested chart TFs: 1m, 3m ,5m,15m. Tested securities: BTCUSD , EURUSD

Realized VolatilityRealized / Historical Volatility
Calculates historical, i.e. realized volatility of any underlying. If frequency is not the daily, but for example 6h, 30min, weeks or months, it scales the initial setting to be suitable for the different time frame.
Examples with default settings (30 day volatility, 365 days per year):
A) Frequency = Daily:
Returns 30 day historical volatility, under the assumption that there are 365 trading days in a year.
B) Frequency = 6h:
Still returns 30 day historical volatility, under the assumption that there are 365 trading days in a year. However, since 6h granularity fits 4 times in 24 hours, it rescales the look back period to rather 30*4 = 120 units to still reflect 30 day historical volatility.

Kairi Relative Index Leading IndicatorHere is a leading indicator based on the relatively obscure Kairi Relative Index. The Kairi comes from Japan and is similar to the popular RSI, although it is believed that it predates the RSI significantly.
The Kairi measures the difference between the current price and its SMA as a percentage of the moving average.
We made a few modifications to the Kairi to improve its timing and balance its sensitivity. First, we calculated a 'fast' and 'slow' Kairi Relative Index. To do this, it calculates the difference between the current price and a SMA with a length of 7 periods for the fast Kairi. Then, the difference between the current price and an SMA of length 24 is calculated for the slow Kairi.
The big modification is using a 25 period SMA of slow Kairi Relative Index values as the threshold for buy and sell signals. When the fast Kairi line crosses above the white line(the threshold) it is considered a bullish signal, while a bearish signal comes when it crosses back below the same white line. This solved the issue with the Kairi having slower reaction time than the RSI. As the chart shows, this setup allowed it to catch not only major trends but also predict unexpected price spikes.
Users can adjust all 3 lengths, as well as adjust the option to have the slow Kairi displayed on the chart(shown in second pane).

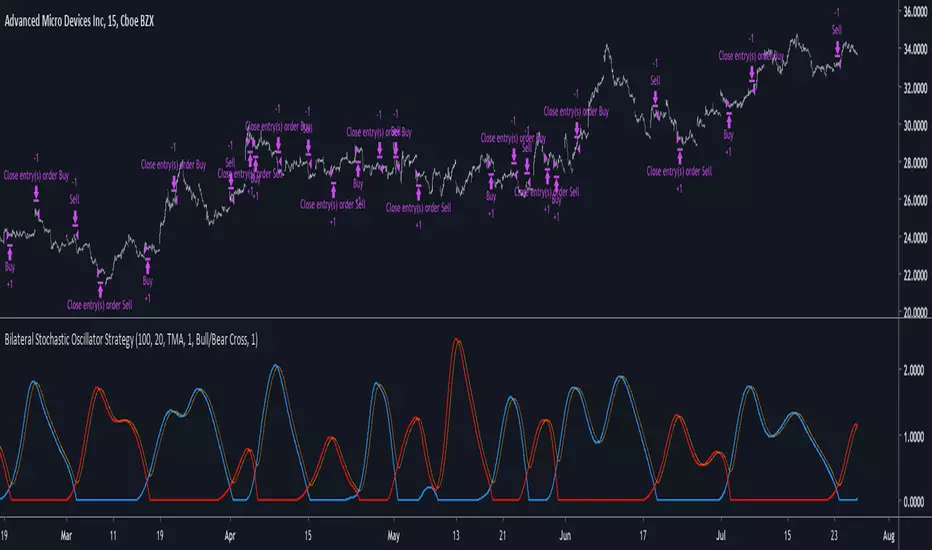
Bilateral Stochastic Oscillator StrategyIntroduction
Strategy based on the bilateral stochastic oscillator, this oscillator aim to detect trends and possible reversal points of the current trend. The oscillator is composed of 1 bull line in blue and 1 bear line in red as well as a signal line in orange, the strategy have many options such as two different strategy framework and a martingale mode. If you require more information about the indicator go check it into my uploaded indicators.
Strategy Frameworks
There are two frameworks available that can be selected from the strategy settings window. Both have the same closing conditions, the "Bull/Bear Cross" entry conditions are :
Buy : when the bull line cross over the bear line
Sell : when the bear line cross over the bull line
The "Signal Cross" entry conditions are :
Buy : when the bull line cross over the signal line
Sell : when the bear line cross over the signal line
Both have the same close conditions that is : close when bull/bear cross under the signal line.
Introduction To Martingale
The martingale money management system consist to double the order size after a loosing trade and can be described as a 2^x where x is the current number of loosing trades since the last win trade, when we win a trade the order size return to the default order size. Therefore our order size function is based on exponential growth.
This system enable the trader to win back his previous losses plus a potential profit, martingales must always be used with stops and sometimes take profits in order to get control in a strategy.
It must always be taken into account that in a series of losses the balance can exponentially decay thus ending to 0 in a matter of trades, this is why it is not recommended to use such system. The strategy allow you to select a martingale multiplier that can be inferior to 2 thus limiting risks, a multiplied of 1 disable the martingale.
Results
Those are the some statistics of the strategy applied to some forex majors by using the default settings in a time frames of 15 minutes.
//-------------------------------------------------------
EURUSD - Order Size 1000 - Spread 0.0002
Profit : $ 21.08
Trades : 19
PP : 57.89 %
Profit Factor : 3.228
Max Drawdown : -$ 3.81
Average Trade : $ 1.11
//-------------------------------------------------------
GBPUSD - Order Size 1000 - Spread 0.0002
Profit : $ 2.31
Trades : 20
PP : 55 %
Profit Factor : 0.938
Max Drawdown : -$ 20.29
Average Trade : $ 0.12
//-------------------------------------------------------
EURAUD - Order Size 1000 - Spread 0.0002
Profit : -$ 9.22
Trades : 20
PP : 40 %
Profit Factor : 0.698
Max Drawdown : -$ 23.44
Average Trade : $ 0.46
//-------------------------------------------------------
EURCHF - Order Size 1000 - Spread 0.0002
Profit : $ 1.58
Trades : 24
PP : 54.17 %
Profit Factor : 1.103
Max Drawdown : -$ 7.23
Average Trade : $ 0.07
//-------------------------------------------------------
Conclusions
Based on the results the strategy does not posses the sufficient performance in order to apply a martingale or any other growth systems as order size. Parameters might be subject to drastic changes depending on the market/time-frame in order to return long-term positive results. I let you draw your conclusions.
Donald Duck Index @ LekkerCryptisch.nl [v2019-07-24]This indicator provides three series that can be used to compare to other series, based on the price of the Dutch weekly magazine Donald Duck.
1) The price in euros
2) The price index
3) The year-on-year price appreciation

No Nonsense NNFX VP Strategy for Back Testing Indicators| jhAfter putting the whole system together, sat down to benchmark the various confirmation indicators, shrink it down to backtest individual confirmation indicators.
Results for 24 periods way better than 10, then again it's only one pair. :)
More details below.
//////////////////////////////////////////////////////////////////////////////////////////////////////////////////////////////////
//Designed per No Nonsense Forex VP rules
//For testing your individual indicators before the full system
//Originated from causecelebre
//Tried to put in as much VP rules as possible
///////////////////////////////////////////////////
//Rules Implemented:
///////////////////////////////////////////////////
// - SL 1.5 x ATR
// - TP 1 x ATR
//
// - Entry conditions
//// - Entry from 1 x confirmation
// - Exit conditions
//// - Exit on confirmation flip
///////////////////////////////////////////////////
//Trades entries
///////////////////////////////////////////////////
// - First entry L1 or S1 with standard SL and TP
///////////////////////////////////////////////////
//Included Indicators and settings
///////////////////////////////////////////////////
// - Confirmtion = SSL 10
///////////////////////////////////////////////////
//Credits
// Strategy causecelebre www.tradingview.com
// SSL Channel ErwinBeckers www.tradingview.com
//////////////////////////////////////////////////////////////////////////////////////////////////////////////////////////////////
//Change log
//First release. Testing of indicators
//////////////////////////////////////////////////////////////////////////////////////////////////////////////////////////////////

Jurik Fast K copyPretty good copy of the Jurik Fast-K indicator. The phase and power shouldn't really need to be messed with but you can play with the lengths. Jurik's default is 24 and 16 but I prefer the 16 and 12 that I coded into it on here. Enjoy!
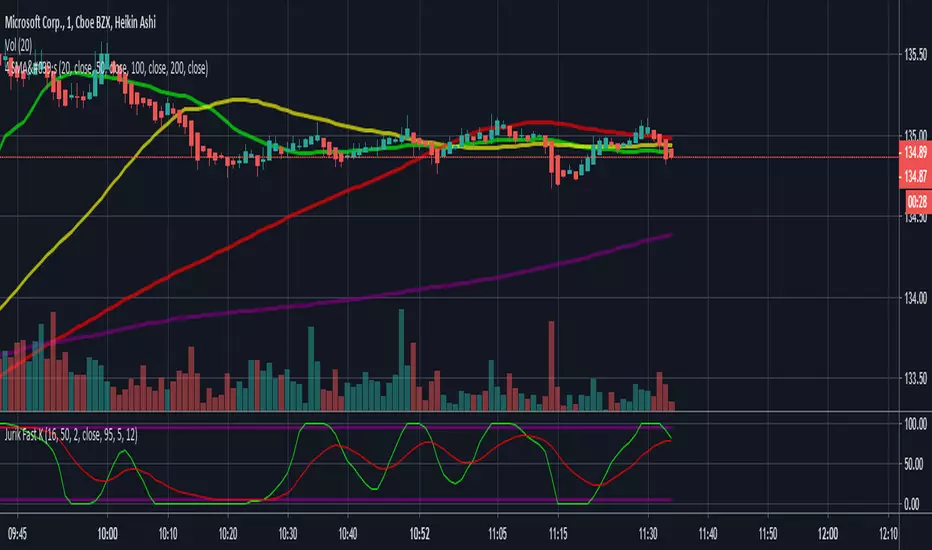
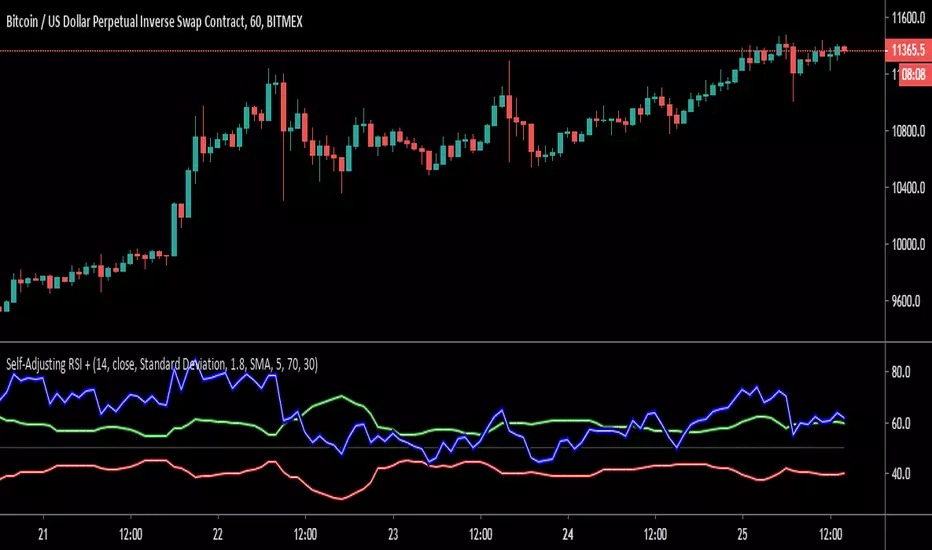
Self-Adjusting RSI +Here is an open source (no request needed!) version of the Self-Adjusting RSI by David Sepiashvili.
Published in Stocks & Commodities V. 24:2 (February, 2006): The Self-Adjusting RSI
David Sepiashvili's article, "The Self-Adjusting RSI," presents a technique to adjust the traditional RSI overbought and oversold thresholds so as to ensure that 70-80% of RSI values lie between the two thresholds. Sepiashvili presents two algorithms for adjusting the thresholds. One is based on standard deviation, the other on a simple moving average of the RSI.
This script allows you to choose between plotting the Self-Adjusting bands or the traditional bands. You can also plot a smoothed RSI (SMA or EMA) and change the theme color for dark or light charts.
If you find this code useful, please pass it forward by sharing open source!
Thank you to all of the open source heroes out there!
"If I have seen a little further it is by standing on the shoulders of Giants."
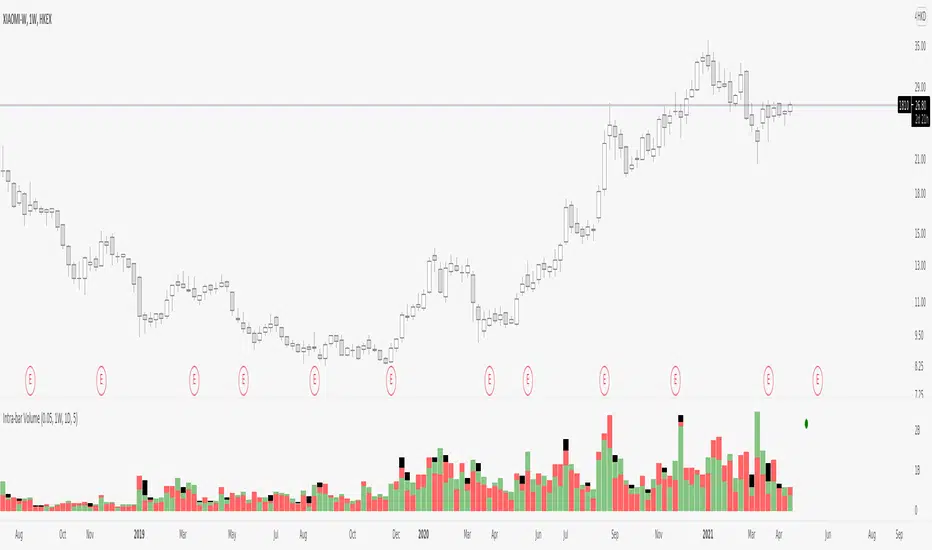
Intra-bar VolumeDisclamer : READ THIS BEFORE USING IT !!!
I have take and try to improuve the source code of indicator "intra-bar volume" by backtest-rookies.com
This indicator categorized the volume in lower timeframe, if the candle close up it's a buying volume, if it close down...
Beware that is not easy to work with different TF on tradingview so you have some limitation on the TF with this indicator. Also in TV we can't have a mutable variable in a security fonction.. so my approche is not clean but it works, if someone find better way, please comment or contact me :)
So by default the indicator can work on the following TF : 5m 15m 30m 60m 120m 240m 480m 720m 1D 1W 12M.
But ... this indicator need a lower timeframe and the number of bar to work correctly, in my code i suppose that the market run 24/7, so you need to adapte it or use intraday TF for other market.
To make sure that the indicator work correctly i have juste add circle, if it's green the buying+selling+balance volume is equal to the volume on the last close candle. If it's red theire is a problem.
I hope you enjoy it, feel free to modify the code and comment if you have any sugestion, i have just make it so maybe i will ajust some part of the code.
Volume Weighted Price Over A Moving 60 Bar Window// By S.Black
// 4/24/2019
// Pine on TradingView.com
//
// This plot takes a simple 60 bar window
// For each bar in the window 3 things are plotted:
// 1.) The volume-weighted average, each bar's volumne * price summed, then divided by total volume
// 2.) The simple 60 bar average (not weighted)
// 3.) The close price (for reference)
//
// Green is used when the weighted price is above the average
// This is meant to indicate that actually, by volume the stock may be worth more that it is currently trading at.
// I made a new script was because I didn't see one that had a rolling hour window.
