Wick Spike 50% Detector (15m & 1h)This script identifies candles with significant upper or lower wicks (spikes) based on a percentage of the total candle range. It helps spot potential reversals, exhaustion moves, or liquidity grabs — especially useful in volatile markets.
📍 Key Features:
15-Minute Timeframe:
Red Triangle Above: Candle range ≥ 0.35% and upper wick ≥ 50% of the range.
Green Triangle Below: Candle range ≥ 0.30% and lower wick ≥ 50% of the range.
1-Hour Timeframe:
Red Circle Above: Candle range ≥ 0.50% and upper wick ≥ 50%.
Green Circle Below: Candle range ≥ 0.50% and lower wick ≥ 50%.
📢 Alerts:
Alerts trigger when the 50% spike condition is met — within the last 60 seconds before candle close — ensuring timely notifications.
🎯 Designed to assist traders in identifying spike-driven opportunities and refining entry/exit strategies.
"股价站上60月线" için komut dosyalarını ara

Triple Stochastic Confluence by AtallaTriple Stochastic Confluence by Atalla - Indicator Summary
Overview
The "Triple Stochastic Confluence by Atalla" is a technical indicator for TradingView that identifies potential trading opportunities using the confluence of three Stochastic oscillators with different timeframes. The indicator focuses exclusively on the %D lines (signal lines) of the Stochastics.
Key Components
Three Stochastic Oscillators
Short-term Stochastic: Period 9, %K Smoothing 1, %D Period 3
Medium-term Stochastic: Period 14, %K Smoothing 1, %D Period 3
Long-term Stochastic: Period 60, %K Smoothing 1, %D Period 10
Visual Display
White lines for the first two Stochastics (%D lines)
Yellow line for the third (long-term) Stochastic (%D line)
Background color changes to highlight trading opportunities:
Yellow background: Bullish signal
Red background: Bearish signal
Trading Signals Logic
Bullish Signal (Yellow Background)
A bullish signal occurs when any Stochastic %D line is in the oversold zone (≤25%) while at least one of the other %D lines is in the overbought zone (≥75%).
Bearish Signal (Red Background)
A bearish signal occurs when any Stochastic %D line is in the overbought zone (≥75%) while at least one of the other %D lines is in the oversold zone (≤25%).
Configurable Parameters
Stochastic periods and smoothing values
Overbought level (default: 75%)
Oversold level (default: 25%)
Alert Conditions
The indicator includes alert conditions for both bullish and bearish confluence signals, allowing users to set up automated notifications for trading opportunities.
Trading Philosophy
This indicator leverages the concept of momentum divergence across different timeframes. When oscillators at different timeframes show opposing extreme readings (one in oversold and another in overbought), it may indicate a potential reversal point in the market. The indicator's strength lies in identifying these confluences automatically and providing clear visual signals.

Stoch Quad Oscillator📘 Stoch Quad Oscillator – User Guide
✅ Purpose
The Stoch Quad Oscillator is a multi-timeframe stochastic oscillator tool that helps traders detect oversold and overbought conditions, momentum shifts, and quad rotation signals using four distinct stochastic configurations. It includes visual cues, customizable parameters, and background highlights to improve decision-making during trend reversals or momentum surges.
🛠️ Inputs & Parameters
⏱ Timeframe
Timeframe for Stochastic Calculation: Defines which chart timeframe to use for stochastic calculations (default is "1" minute). This enables multi-timeframe analysis while on a lower timeframe chart.
📈 Stochastic Parameters
Four different stochastic configurations are used:
Label %K Length %D Smoothing Notes
K9 D3 9 3 Fastest, short-term view
K14 D3 14 3 Moderately short-term
K40 D4 40 4 Medium-term trend view
K60 D10 60 10 Long-term strength
Smoothing Type: Choose between SMA or EMA to control how smoothed the %D line is.
🎯 Levels
Overbought Level: Default 80
Oversold Level: Default 20
These are used to indicate overextended price conditions on any of the stochastic plots.
🔄 Quad Rotation Detection Settings
When enabled, the script detects synchronized oversold/overbought conditions with strong momentum using all 4 stochastic readings.
Enable Quad Rotation: Toggles detection on or off
Slope Calculation Bars: Number of bars used to calculate slope of %D lines
Slope Threshold: Minimum slope strength for signal (higher = stronger confirmation)
Oversold Quad Level: Total of all four stochastic values that define a quad oversold zone
Overbought Quad Level: Total of all four stochastic values that define a quad overbought zone
Oversold Quad Highlight Color: Background color when oversold quad is triggered
Overbought Quad Highlight Color: Background color when overbought quad is triggered
Slope Averaging Method: Either Simple Average or Weighted Average (puts more weight on higher timeframes)
Max Signal Bar Window: Defines how recent the signal must be to be considered valid
📊 Plots & Visual Elements
📉 Stochastic %D Lines
Each stochastic is plotted separately:
K9 D3 – Red
K14 D3 – Orange
K40 D4 – Fuchsia
K60 D10 – Silver
These help visualize short to long-term momentum simultaneously.
📏 Horizontal Reference Lines
Overbought Line (80) – Red
Oversold Line (20) – Green
These help you identify threshold breaches visually.
🌈 Background Highlighting
The indicator provides background highlights to mark potential signal zones:
✅ All Oversold or Overbought Conditions
When all four stochastics are either above overbought or below oversold:
Bright Red if all are overbought
Bright Green if all are oversold
🚨 Quad Rotation Signal Zones (if enabled)
Triggered when:
The combined sum of all four stochastic levels is extremely low/high (below/above oversoldQuadLevel or overboughtQuadLevel)
The average slope of the 4 %D lines is sharply positive (> slopeThreshold)
Highlights:
Custom Red Tint = Strong overbought quad signal
Custom Green Tint = Strong oversold quad signal
These zones can indicate momentum shifts or reversal potential when used with price action or other tools.
⚠️ Limitations & Considerations
This indicator does not provide trade signals. It visualizes conditions and potential setups.
It is best used in confluence with price action, support/resistance levels, and other indicators.
False positives may occur in ranging markets. Reduce reliance on slope thresholds during low volatility.
Quad signals rely on slope strength, which may lag slightly behind sudden reversals.
🧠 Tips for Use
Combine with volume, MACD, or PSAR to confirm direction before entry.
Watch for divergences between price and any of the stochastics.
Use on higher timeframes (e.g., 5m–30m) to filter for swing trading setups; use shorter TFs (1m–5m) for scalping signals.
Adjust oversoldQuadLevel and overboughtQuadLevel based on market conditions (e.g., in trending vs ranging markets).

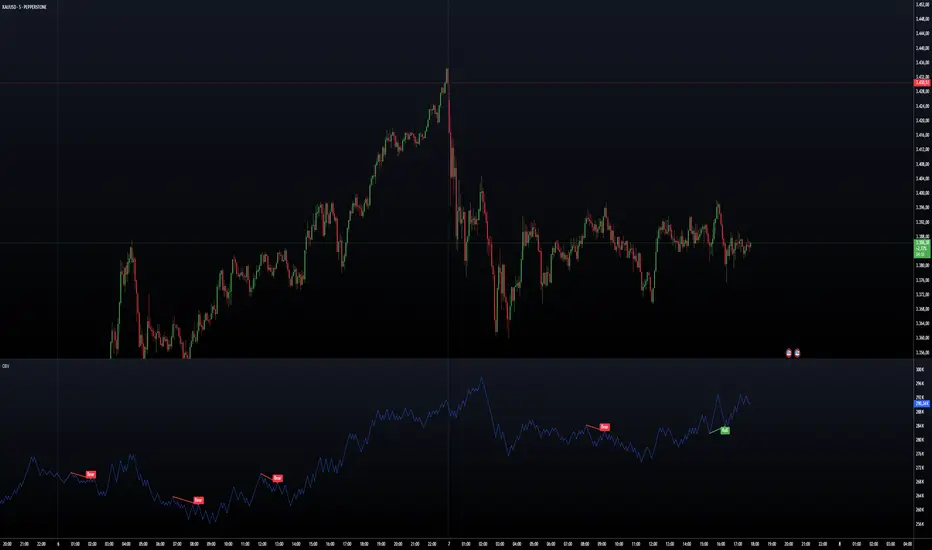
Trailing Cumulative Volume DeltaShort Description:
A dynamic volume delta indicator that calculates a trailing sum of net buying/selling pressure over a user-defined number of recent bars, offering a more adaptive view of order flow momentum compared to fixed-anchor CVD.
Overview:
The Trailing Cumulative Volume Delta (TCVD) indicator provides a powerful way to analyze market sentiment by tracking the net difference between buying and selling volume. Unlike traditional Cumulative Volume Delta (CVD) indicators that typically reset at fixed intervals (e.g., daily, weekly), the TCVD calculates a rolling sum of volume delta over a specified number of recent bars. This "trailing" approach offers a more fluid and responsive measure of recent order flow dynamics.
How it Works:
Per-Bar Delta Calculation: For each bar on your chart, the indicator first calculates the net Volume Delta. This is done by looking at a finer, user-configurable Lower Timeframe (e.g., 1-minute data for a 15-minute chart bar) to determine the aggressive buying vs. selling volume within that bar.
Trailing Sum: The indicator then sums these individual per-bar net deltas over a user-defined Trailing Bars lookback period. For example, if "Trailing Bars" is set to 20, the TCVD value will represent the cumulative net delta of the last 20 bars.
Visualization:
The TCVD is plotted in a "MACD-Columns-Style" in a separate pane.
Teal: When the TCVD value is increasing (suggesting growing net buying pressure or diminishing net selling pressure over the trailing period).
Red: When the TCVD value is decreasing (suggesting growing net selling pressure or diminishing net buying pressure over the trailing period).
White: When it is returning to the mean.
How to Interpret and Use TCVD:
Trend Strength & Momentum:
A rising TCVD suggests that, on average over the trailing period, buying pressure is dominant or strengthening. This can confirm bullish price action or indicate underlying strength.
A falling TCVD suggests that selling pressure is dominant or strengthening, potentially confirming bearish price action or indicating weakness.
Divergences:
Unlike other Divergences, the CVD has two different types of Divergences: a) Absorption and b) Exhaustion. You only want to trade the Absorption pattern.
Zero Line Crossovers:
TCVD crossing above the zero line can indicate a shift towards net positive buying pressure over the lookback period.
TCVD crossing below the zero line can indicate a shift towards net positive selling pressure.
Confirmation: Use TCVD to confirm breakouts or breakdowns. A price breakout accompanied by a strongly rising TCVD is generally more reliable.
Key Settings:
Trailing Bars: (Default: 10)
Determines the number of recent bars to include in the cumulative delta sum.
Shorter periods make the TCVD more responsive to immediate changes.
Longer periods provide a smoother, longer-term view of order flow.
Use custom timeframe: (Checkbox, Default: false)
Allows you to override the automatic selection of the lower timeframe for delta calculation.
Timeframe for Delta Calculation: (Default: "1" - 1 minute)
Specifies the lower timeframe data used to calculate the volume delta for each individual chart bar.
Choosing a very fine timeframe (e.g., seconds) can provide high precision but may be limited by data availability or processing load.
If "Use custom timeframe" is unchecked, the script attempts to choose a sensible default based on your chart's timeframe (e.g., "1S" for second charts, "1" for intraday, "5" for daily, "60" for weekly+).
Examples:
Confirming Breakout Strength:
Price breaks out above a significant resistance level.
If the TCVD is also sharply rising and has perhaps crossed above its zero line, it provides confirmation that strong buying interest is fueling the breakout, increasing confidence in its validity.
Important Notes:
This indicator requires reliable volume data from your broker/data feed to function correctly. If your chart does not have volume, or if the volume data is unreliable, the TCVD will not be accurate.
Like all indicators, TCVD is best used as part of a comprehensive trading strategy, in conjunction with price action analysis and other indicators or tools.
Experiment with the Trailing Bars and Timeframe for Delta Calculation settings to find what best suits your trading style, the asset you are analyzing, and the chart timeframe you are using.
Feel free to modify this, add your personal touch, or include specific screenshots when you publish!

Customizable Order Flow DashboardOrder Flow Dashboard – Indicator Summary
This TradingView indicator displays a real-time dashboard showing the candle direction (Bullish, Bearish) and countdown timers for three user-selected timeframes. It helps traders quickly assess multi-timeframe alignment during live sessions.
Features:
Custom Timeframes – Select any 3 timeframes (e.g. 1m, 5m, 1H)
Candle Trend Detection – Bullish (green), Bearish (red), or Neutral (gray)
Countdown Timer – Displays time remaining until the current candle closes in MM:SS format
Clean Labels – Automatically formats timeframes like “60” into “1H”
Table Display – Dashboard appears in the top-right corner of the chart
How to Use:
Add the script to your chart.
Open settings and select your preferred timeframes.
Monitor the table to view candle direction and time remaining for each selected timeframe.
Use Case:
Ideal for traders who want fast visual confirmation of trend direction across multiple timeframes to support entry and exit decisions.

Elliott Wave Noise FilterElliott Wave Noise Filter
Overview
The Elliott Wave Noise Filter is a specialized indicator for TradingView, designed to solve one of the biggest challenges in Elliott Wave analysis on lower timeframes: the identification of market noise. By combining multiple advanced filtering techniques, this indicator helps distinguish meaningful price action from random fluctuations.
The Problem
On lower timeframes—especially below 15 minutes—Elliott Wave analysis is significantly impacted by excessive market noise. This noise can lead to misinterpretation of wave structures, making it difficult to execute reliable trading decisions.
The Solution
The Elliott Wave Noise Filter utilizes four powerful methods to detect and filter noise:
ATR-Based Volatility Analysis: Identifies price movements too small to be structurally meaningful
Volume Confirmation: Filters out price moves that occur with insufficient volume
Trend Strength Measurement (ADX): Detects periods of weak trend activity, where noise tends to dominate
Fractal Pattern Recognition: Marks significant turning points that could be relevant for Elliott Wave analysis
Features
Visual Indicators
Background Coloring: Red indicates noise; green signifies a clear signal
Hull Moving Average: Smooths price action and highlights the prevailing trend
Fractal Markers: Triangles mark significant highs and lows
Status Panel: Displays current noise status and ADX value
Customization Options
ATR Period: Adjust the lookback period for ATR calculations
Noise Threshold: Defines the percentage of ATR below which a movement is considered noise
Volume Filter: Can be enabled or disabled
Volume Threshold: Sets the ratio to average volume for a move to be deemed significant
Hull MA Display and Length: Configure the moving average settings
ADX Parameters: Adjust trend strength sensitivity
Use Cases
For Elliott Wave Analysis
Eliminate noise to identify cleaner wave structures
Use fractal markers as potential wave endpoints
Reference the Hull MA for determining the broader trend
For General Trading
Identify high-noise periods to avoid low-quality setups
Spot clearer market phases for better entries
Assess price action quality through visual cues
Multi-Timeframe Approach
Apply the indicator across different timeframes for a comprehensive view
Prefer trading when both higher and lower timeframes align with consistent signals
Optimal Settings
For Very Short Timeframes (1–5 minutes)
Higher Noise Threshold (0.4–0.5)
Longer ATR Period (20–30)
Higher Volume Threshold (1.0–1.2)
For Medium Timeframes (15–60 minutes)
Medium Noise Threshold (0.2–0.3)
Standard ATR Period (14)
Standard Volume Threshold (0.8)
For Higher Timeframes (4h and above)
Lower Noise Threshold (0.1–0.2)
Shorter ATR Period (10)
Lower Volume Threshold (0.6–0.7)
Conclusion
The Elliott Wave Noise Filter is an essential tool for any Elliott Wave analyst or trader working on lower timeframes. By reducing noise and emphasizing significant market movements, it enables more precise analysis and potentially more profitable trading decisions.
Note: As with any technical indicator, the Elliott Wave Noise Filter should be used as part of a broader trading strategy and not as a standalone signal for trade execution.

Context MTF [Th16rry]Context MTF
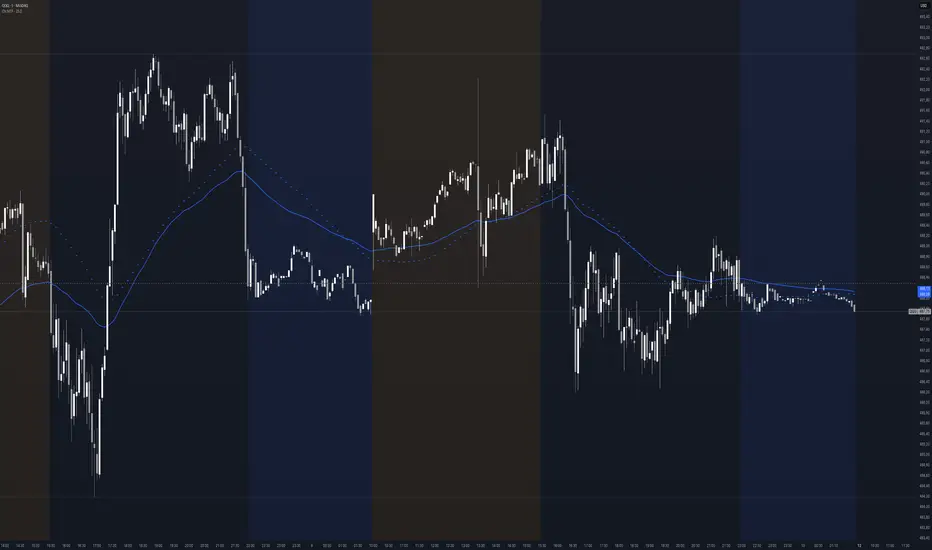
A multi-timeframe trend context indicator that overlays an Exponential Moving Average (EMA) and a Weighted Moving Average (WMA) whose look-back periods adapt automatically to your chart’s timeframe. Inspired by Mike Bellafore and Brian Shannon (Multi timeframe analysis)
🔍 Overview
Context MTF helps you quickly gauge the prevailing trend and its strength by plotting two complementary moving averages in a single view:
* EMA (solid line) for smooth, responsive trend direction
* WMA (dotted line) for emphasis on recent price action
By automatically selecting period lengths that reflect meaningful market cycles, Context MTF provides intuitive context at a glance:
| Timeframe | Period | Market Cycle Represented |
| :--------: | :----: | :----------------------: |
| Daily (D) | 63 | Quarterly trend |
| Weekly (W) | 52 | Yearly trend |
| 1H (60) | 126 | Monthly trend |
| 15m (15) | 130 | Weekly trend |
| 5m (5) | 78 | Last 24 hours |
⚙️ How It Works
1. Automatic Period Selection
The script detects your chart’s timeframe and applies the appropriate look-back for both EMA and WMA.
2. Solid vs. Dotted
* EMA is drawn as a continuous solid line.
* WMA is rendered as a dotted line of the same color, highlighting short-term momentum within the broader trend.
3. Visual Trend Context
* Widening Gap : Indicates strengthening trend momentum.
* Convergence/Overlap : Suggests a market in consolidation or range.
🎯 Benefits
* Multi-Timeframe Context in a single pane—no need to switch charts.
* Instant trend strength assessment by comparing EMA vs. WMA divergence.
* Clear identification of range conditions when averages align.
* Fully automated period adjustment —set and forget.
⚙️ Settings
* Color : Shared color for both lines (default blue).
* Line Width : Adjustable via script inputs (default 2).
* Dotted WMA : Simulated using built-in dotted line styling for precise rendering.
Use Context MTF to enhance trend-based strategies, confirm breakout momentum, or filter ranging markets. Ideal for swing traders, day traders, and anyone who values clear, time-aligned trend information on every timeframe.
Stochastic RSI with MTF TableShort Description of the Script
The provided Pine Script indicator, titled "Stochastic RSI with MTF Table," calculates and displays the Stochastic RSI for the current timeframe and multiple other timeframes (5m, 15m, 30m, 60m, 240m, and daily). The Stochastic RSI is a momentum indicator that blends the Relative Strength Index (RSI) and Stochastic Oscillator to identify overbought and oversold conditions, as well as potential trend reversals via K and D line crossovers.
Key features of the script include:
Inputs: Customizable parameters such as K smoothing (default 3), D smoothing (default 3), RSI length (default 14), Stochastic length (default 14), source price (default close), and overbought/oversold levels (default 80/20).
MTF Table: A table displays the Stochastic RSI status for each timeframe:
"OB" (overbought) if K > 80, "OS" (oversold) if K < 20, or "N" (neutral) otherwise.
Crossovers: "K↑D" for bullish (K crosses above D) and "K↓D" for bearish (K crosses below D).
Visualization: Plots the K and D lines for the current timeframe, with horizontal lines at 80 (overbought), 50 (middle), and 20 (oversold), plus a background fill for clarity.
Table Position: Configurable to appear in one of four chart corners (default: top-right).
This indicator helps traders assess momentum across multiple timeframes simultaneously, aiding in the identification of trend strength and potential entry/exit points.
Trading Strategy with 50EMA and 200EMA for Highest Winning Rate
To create a strategy with the best probability of a high winning rate using the Stochastic RSI MTF indicator alongside the 50-period Exponential Moving Average (50EMA) and 200-period Exponential Moving Average (200EMA), we can combine trend identification with momentum-based entry timing. The 50EMA and 200EMA are widely used to determine medium- and long-term trends, while the Stochastic RSI MTF table provides multi-timeframe momentum signals. Here’s the strategy:
1. Determine the Overall Trend
Bullish Trend: The 50EMA is above the 200EMA on the current timeframe (e.g., daily or 60m chart). This suggests an uptrend, often associated with a "Golden Cross."
Bearish Trend: The 50EMA is below the 200EMA on the current timeframe. This indicates a downtrend, often linked to a "Death Cross."
Implementation: Plot the 50EMA and 200EMA on your chart and visually confirm their relative positions.
2. Identify Entry Signals Using the Stochastic RSI MTF Table
In a Bullish Trend (50EMA > 200EMA):
Look for timeframes in the MTF table showing:
Oversold (OS): K < 20, indicating a potential pullback in the uptrend where price may rebound.
Bullish Crossover (K↑D): K crosses above D, signaling rising momentum and a potential entry point.
Example: If the 60m and 240m timeframes show "OS" or "K↑D," this could be a buy signal.
In a Bearish Trend (50EMA < 200EMA):
Look for timeframes in the MTF table showing:
Overbought (OB): K > 80, suggesting a rally in the downtrend where price may reverse downward.
Bearish Crossover (K↓D): K crosses below D, indicating declining momentum and a potential short entry.
Example: If the 30m and daily timeframes show "OB" or "K↓D," this could be a sell/short signal.
Current Timeframe Check: Use the plotted K and D lines on your trading timeframe for precise entry timing (e.g., confirm a K↑D crossover on a 60m chart for a long trade).
3. Confirm Signals Across Multiple Timeframes
Strengthen the Signal: A higher winning rate is more likely when multiple timeframes align with the trend and signal. For instance:
Bullish trend + "OS" or "K↑D" on 60m, 240m, and daily = strong buy signal.
Bearish trend + "OB" or "K↓D" on 15m, 60m, and 240m = strong sell signal.
Prioritize Higher Timeframes: Signals from the 240m or daily timeframe carry more weight due to their indication of broader trends, increasing reliability.
4. Set Stop-Loss and Take-Profit Levels
Long Trades (Bullish):
Stop-Loss: Place below the most recent swing low or below the 50EMA, whichever is closer, to protect against trend reversals.
Take-Profit: Target a key resistance level or use a risk-reward ratio (e.g., 2:1 or 3:1) based on the stop-loss distance.
Short Trades (Bearish):
Stop-Loss: Place above the most recent swing high or above the 50EMA, whichever is closer.
Take-Profit: Target a key support level or apply a similar risk-reward ratio.
Trailing Stop Option: As the trend progresses, trail the stop below the 50EMA (for longs) or above it (for shorts) to lock in profits.
5. Risk Management
Position Sizing: Risk no more than 1-2% of your trading capital per trade to minimize losses from false signals.
Volatility Consideration: Adjust stop-loss distances and position sizes based on the asset’s volatility (e.g., wider stops for volatile stocks or crypto).
Avoid Overtrading: Wait for clear alignment between the EMA trend and MTF signals to avoid low-probability setups.
Example Scenario
Chart: 60-minute timeframe.
Trend: 50EMA > 200EMA (bullish).
MTF Table: 60m shows "OS," 240m shows "K↑D," and daily is "N."
Action: Enter a long position when the 60m K line crosses above D, confirming the table signal.
Stop-Loss: Below the recent 60m swing low (e.g., 2% below entry).
Take-Profit: At the next resistance level or a 3:1 reward-to-risk ratio.
Outcome: High probability of success due to trend alignment and multi-timeframe confirmation.
Why This Strategy Works
Trend Following: Trading in the direction of the 50EMA/200EMA trend reduces the risk of fighting the market’s momentum.
Momentum Timing: The Stochastic RSI MTF table pinpoints pullbacks or reversals within the trend, improving entry timing.
Multi-Timeframe Confirmation: Alignment across timeframes filters out noise, increasing the win rate.
Risk Control: Defined stop-loss and position sizing protect against inevitable losses.
Caveats
No strategy guarantees a 100% win rate; false signals can occur, especially in choppy markets.
Test this strategy on historical data or a demo account to verify its effectiveness for your asset and timeframe.
This approach leverages the strengths of both trend-following (EMA) and momentum (Stochastic RSI) tools, aiming for a high-probability, disciplined trading system.

Hybrid Swing/Day Alert System - PLATINUM EditionThis indicator is a complete trading assistant designed for crypto swing and day traders, built to identify high-probability long and short setups based on a multi-confirmation system.
Strategy Logic
The system scans and confirms entries only when 6 major confluences align:
1. EMA Trend: Price is above or below the EMA 9, 21, and 200 (bullish or bearish trend).
2. RSI Zone: RSI(14) is between 40-60 (ideal reversal zone).
3. Volume Confirmation: Volume is declining on pullback and then spikes.
4. Accumulation/Distribution: A/D line rising (for longs) or falling (for shorts).
5. Fibonacci Pullback Zone: Automatic detection of swing high/low and checks if price is inside the golden zone (0.5-0.618).
Built-In Alerts
- Long Setup Confirmed - Short Setup Confirmed - Setup Forming: Monitor
Conclusion
This script is ideal for disciplined traders who value confluence-based entries, risk/reward logic, and trend-aligned trades. Perfect for semi-automated trading via alerts or manual execution.6. Candle Pattern: Bullish (hammer, doji, engulfing) or Bearish (rejection wick, engulfing, doji).
Visual Features
- Long Entry: Green square
- Short Entry: Red triangle
- Pre-Signal Alert: Blue circle (confluence forming)
- Dynamic Table: Displays all 6 confirmations in real time
- Fibonacci Zones: Auto-plotted long/short retracement zones
- Customizable: Turn on/off alerts, overlays, and direction filters
Best Use Cases
- 4H/Daily: Trend confirmation
- 1H: Entry execution
- 15min: Scalping (use cautiously)
- Works great with BTC, ETH, SOL, XAU, and meme coins

Adaptive Volume-Weighted RSI (AVW-RSI)Concept Summary
The AVW-RSI is a modified version of the Relative Strength Index (RSI), where each price change is weighted by the relative trading volume for that period. This means periods of high volume (typically driven by institutions or “big money”) have a greater influence on the RSI calculation than periods of low volume.
Why AVW-RSI Helps Traders
Avoids Weak Signals During Low Volume
Standard RSI may show overbought/oversold zones even during low-volume periods (e.g., during lunch hours or after news).
AVW-RSI gives less weight to these periods, avoiding misleading signals.
Amplifies Strong Momentum Moves
If RSI is rising during high volume, it's more likely driven by institutional buying—AVW-RSI reflects that stronger by weighting the RSI component.
Filters Out Retail Noise
By prioritizing high-volume candles, it naturally discounts fakeouts caused by thin markets or retail-heavy moves.
Highlights Institutional Entry/Exit
Useful for spotting hidden accumulation/distribution that classic RSI would miss.
How It Works (Calculation Logic)
Traditional RSI Formula Recap
RSI = 100 - (100 / (1 + RS))
RS = Average Gain / Average Loss (over N periods)
Modified Step – Apply Volume Weight
For each period
Gain_t = max(Close_t - Close_{t-1}, 0)
Loss_t = max(Close_{t-1} - Close_t, 0)
Weight_t = Volume_t / AvgVolume(N)
WeightedGain_t = Gain_t * Weight_t
WeightedLoss_t = Loss_t * Weight_t
Weighted RSI
AvgWeightedGain = SMA(WeightedGain, N)
AvgWeightedLoss = SMA(WeightedLoss, N)
RS = AvgWeightedGain / AvgWeightedLoss
AVW-RSI = 100 - (100 / (1 + RS))
Visual Features on Chart
Line Color Gradient
Color gets darker as volume weight increases, signaling stronger conviction.
Overbought/Oversold Zones
Traditional: 70/30
Suggested AVW-RSI zones: Use dynamic thresholds based on historical volatility (e.g., 80/20 for high-volume coins).
Volume Spike Flags
Mark RSI turning points that occurred during volume spikes with a special dot/symbol.
Trading Strategies with AVW-RSI
1. Weighted RSI Divergence
Regular RSI divergence becomes more powerful when volume is high.
AVW-RSI divergence with volume spike is a strong signal of reversal.
2. Trend Confirmation
RSI crossing above 50 during rising volume is a good entry signal.
RSI crossing below 50 with high volume is a strong exit or short trigger.
3. Breakout Validation
Price breaking resistance + AVW-RSI > 60 with volume = Confirmed breakout.
Price breaking but AVW-RSI < 50 or on low volume = Potential fakeout.
Example Use Case
Stock XYZ is approaching a resistance zone. A trader sees:
Standard RSI: 65 → suggests strength.
Volume is 3x the average.
AVW-RSI: 78 → signals strong momentum with institutional backing.
The trader enters confidently, knowing this isn't just low-volume hype.
Limitations / Tips
Works best on liquid assets (Forex majors, large-cap stocks, BTC/ETH).
Should be used alongside price action and volume analysis—not standalone.
Periods of extremely high volume (news events) might need smoothing to avoid spikes.

On Balance Volume W DivergenceOBV With Divergence Indicator
A comprehensive On Balance Volume (OBV) indicator enhanced with divergence detection capabilities.
Core Features:
Classic OBV calculation with volume-based price movement tracking
Advanced divergence detection system
Multiple smoothing options for OBV
Bollinger Bands integration
Technical Components:
Volume-based price movement analysis
Pivot point detection for divergence
Customizable lookback periods
Adjustable divergence range parameters
Customization Options:
Multiple Moving Average types (SMA, EMA, SMMA, WMA, VWMA)
Bollinger Bands with adjustable standard deviation
Divergence sensitivity settings
Visual customization for signals and alerts
The indicator combines traditional OBV analysis with modern divergence detection, offering traders a powerful tool for identifying potential trend reversals and market momentum shifts.
Key Parameters:
- Pivot Lookback Right/Left: 5 (default)
- Divergence Range: 5-60 bars
- MA Length: 14 (default)
- BB StdDev: 2.0 (default)
Alert System:
- Bullish divergence alerts
- Bearish divergence alerts
- Customizable alert messages
Note: The indicator requires volume data to function properly and will display an error if volume data is not available.
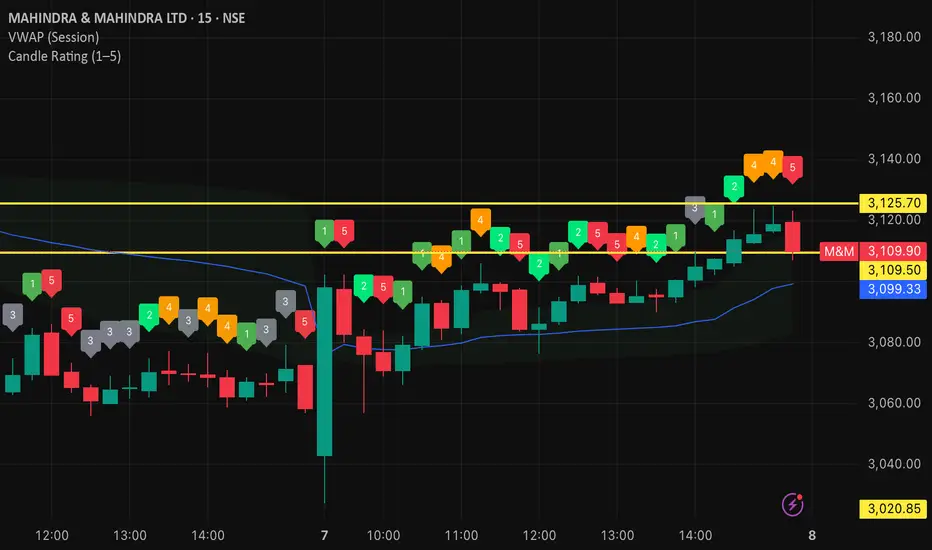
Candle Rating (1–5)This “Candle Rating (1–5)” indicator measures where each bar’s close sits within its own high-low range and assigns a simple strength score:
Range Calculation
It computes the candle’s total range (high − low) and finds the close’s position as a percentage of that range (0 = close at low, 1 = close at high).
Five-Point Rating
1 (Strong Buy): Close in the top 20% of the range
2 (Moderate Buy): 60–80%
3 (Neutral): 40–60%
4 (Moderate Sell): 20–40%
5 (Strong Sell): Bottom 20%
Visual Feedback
It plots the numeric rating above each bar (colored green → red), giving you an at-a-glance read of candle momentum and potential reversal strength across any timeframe.
CAN INDICATORCAN Moving Averages Indicator - Feature Guide
1. Multiple Moving Averages (20 MAs)
- Supports up to 20 individual moving averages
- Each MA can be independently configured:
- Enable/Disable toggle
- Length (period) setting
- Type selection (SMA, EMA, DEMA, VWMA, RMA, WMA)
- Color customization
- Individual timeframe settings when global timeframe is disabled
Pre-configured MA Settings:
1. MA1-8: SMA type
- Lengths: 20, 50, 100, 200, 365, 489, 600, 1460
2. MA9-20: EMA type
- Lengths: 30, 60, 120, 240, 300, 400, 500, 700, 800, 900, 1000, 2000
2. Global Timeframe Settings
Location: Global Settings group
Features:
- Use Global Timeframe: Toggle to use one timeframe for all MAs
- Global Timeframe: Select the timeframe to apply globally
3. Label Display Options
Location: Main Inputs section
Controls:
- Show MA Type: Display MA type (SMA, EMA, etc.)
- Show MA Length: Display period length
- Show Resolution: Display timeframe
- Label Offset: Adjust label position
4. Cross Alerts System
Location: Cross Alerts group
Features:
1. Price Crosses:
- Alerts when price crosses any selected MA
- Select MA to monitor (1-20)
- Triggers on crossover/crossunder
2. MA Crosses:
- Alerts when one MA crosses another
- Select fast MA (1-20)
- Select slow MA (1-20)
- Triggers on crossover/crossunder
5. Relative Strength (RS) Analysis
Location: Relative Strength group
Features:
- Select any MA to monitor (1-20)
- Compares MA to its own average
- Adjustable RS Length (default 14)
- Visual feedback via background color:
- Green: MA above its average (uptrend)
- Red: MA below its average (downtrend)
- Customizable colors and transparency
6. Moving Average Types Available
1. **SMA** (Simple Moving Average)
- Equal weight to all prices
2. **EMA** (Exponential Moving Average)
- More weight to recent prices
3. **DEMA** (Double Exponential Moving Average)
- Reduced lag compared to EMA
4. **VWMA** (Volume Weighted Moving Average)
- Incorporates volume data
5. **RMA** (Running Moving Average)
- Smoother than EMA
6. **WMA** (Weighted Moving Average)
- Linear weight distribution
Usage Tips
1. **For Trend Following:**
- Enable longer-period MAs (MA4-MA8)
- Use cross alerts between long-term MAs
- Monitor RS for trend strength
2. **For Short-term Trading:**
- Focus on shorter-period MAs (MA1-MA3, MA9-MA11)
- Enable price cross alerts
- Use multiple timeframe analysis
3. **For Multiple Timeframe Analysis:**
- Disable global timeframe
- Set different timeframes for each MA
- Compare MA relationships across timeframes
4. **For Performance:**
- Disable unused MAs
- Limit active alerts to necessary pairs
- Use RS selectively on key MAs

Overnight Bias: Net Long/Short with PercentOvernight bias can assist with NY session gap fades or gap and go trading once the NY session is open.
Some general gap rules are:
1. Gap Direction Aligned with Overnight Bias
Rule: If the NY session gaps up and the overnight bias is Net Long (e.g., >60% of bars above the overnight open), favor longs.
Confirmation: Look for price to hold above overnight open or VWAP.
Invalidation: If price re-enters the overnight range, reassess.
2. Gap Opposing Overnight Bias (Contrarian Setup)
Rule: If the NY opens opposite the overnight bias, expect potential gap fill or reversal.
Trade Bias: Look for retracement back toward the overnight open or VWAP.
Example: Overnight was Net Long, but NY gaps down → wait for reclaim of VWAP to go long, else fade strength.
3. Gap Into Prior Day Value Area (VAH to VAL)
Rule: If the NY session gaps into the prior day value area:
It implies mean reversion behavior.
Expect price to rotate toward the POC (point of control).
Trade Bias: Fade toward POC if overnight bias is balanced or opposite the gap direction.
4. Gap Outside Prior Day Value Area
Rule: A gap above VAH or below VAL suggests potential breakout or new trend day.
Trade Bias: If overnight bias aligns (e.g., gap above VAH + Net Long overnight), consider trend continuation.
Invalidation: If price breaks back inside the prior day value area, watch for failed breakout → fade trade possible.
5. Gap Above Prior Day High / Below Prior Day Low
Rule: This is a true breakout gap.
Above Prior High + Net Long Bias: Look for continuation.
Below Prior Low + Net Short Bias: Look for sell pressure continuation.
Trade Bias: Use pullbacks to the prior high/low or overnight open for continuation setups.
6. Gap Within Prior Day Range
Rule: If the NY open is within the prior day’s high and low, expect chop or balanced conditions.
Trade Bias: Use overnight VWAP and prior POC as decision zones. Be cautious unless a breakout occurs.
7. Failed Gap and Re-entry into Prior Day Range
Rule: If price gaps above prior high but re-enters the prior range, it's a failed breakout.
Trade Bias: Look for a fade back to VAH or POC.
Confirmation: Watch for breakdown below overnight VWAP or failure to hold overnight open.
8. Gap + Overnight VWAP Divergence
Rule: If price gaps opposite the direction of VWAP (e.g., VWAP rising, gap down), wait for confirmation.
Trade Bias: Be cautious with early trades. Bias may flip if VWAP is reclaimed.
9. Gap + Overnight Open Test
Rule: If price opens with a gap and then retests the overnight open, that level becomes a decision zone.
Trade Bias:
Hold above = trend continuation.
Rejection = gap fill or reversal.
10. Unfilled Gap = Trend Bias
Rule: If the gap remains unfilled for the first 30–60 minutes, it increases the odds of a trend day.
Trade Bias: Trade pullbacks in the direction of the gap and overnight bias.
Should anyone have suggestion to add please do so.

Guppy Multiple Moving Average (GMMA)The GMMA Momentum Indicator plots 12 EMAs on your chart, divided into two groups:
Short-term EMAs (6 lines, default periods: 3, 5, 8, 10, 12, 15): Represent short-term trader sentiment and momentum.
Long-term EMAs (6 lines, default periods: 30, 35, 40, 45, 50, 60): Reflect long-term investor behavior and broader market trends.
By analyzing the interaction between these two groups, the indicator identifies:
Bullish and bearish trends based on the relative positions of the short- and long-term EMAs.
Momentum strength through the spread or convergence of the EMAs.
Potential reversals or breakouts via compression signals.
This PineScript version enhances the traditional GMMA by adding visual cues like background colors, bearish signals, and compression detection, making it ideal for swing traders seeking clear, actionable insights.
The GMMA Momentum Indicator provides several key features:
1. Trend Identification
Bullish Trend: When the short-term EMAs (green lines) are above the long-term EMAs (blue lines) and spreading apart, it signals strong upward momentum. The chart background turns light green to highlight this condition.
Bearish Trend: When the short-term EMAs cross below the long-term EMAs and converge, it indicates downward momentum. The background turns light red, and an orange downward triangle appears above the bar to mark a new bearish signal.
2. Momentum Analysis
The spread between the short-term EMAs reflects the strength of short-term momentum. A wide spread suggests strong momentum, while a tight grouping indicates weakening momentum or consolidation. Similarly, the long-term EMAs act as dynamic support or resistance, guiding traders on the broader trend.
3. Compression Detection
Compression occurs when both the short-term and long-term EMAs converge, signaling low volatility and a potential breakout or reversal. A yellow upward triangle appears below the bar when compression is detected, alerting traders to watch for price action.
4. Visual Cues
Green short-term EMAs: Show short-term trader activity.
Blue long-term EMAs: Represent long-term investor sentiment.
Background colors: Light green for bullish trends, light red for bearish trends, and transparent for neutral conditions.
Orange downward triangles: Mark new bearish trends.
Yellow upward triangles: Indicate compression, hinting at potential breakouts.
How to Use the GMMA Momentum Indicator for Swing Trading
Swing trading involves capturing price moves over days to weeks, and the GMMA Momentum Indicator is an excellent tool for this strategy. Here’s how to use it effectively:
1. Identifying Trade Entries
Buy Opportunities:
Look for a bullish trend (green background) where the short-term EMAs are above the long-term EMAs and spreading apart, indicating strong momentum.
A compression signal (yellow triangle) followed by a breakout above resistance or a bullish candlestick pattern can confirm an entry.
Example: On a daily chart, if the short-term EMAs cross above the long-term EMAs and the background turns green, consider entering a long position, especially if volume supports the move.
Sell Opportunities:
Watch for a bearish signal (orange downward triangle) or a bearish trend (red background) where the short-term EMAs cross below the long-term EMAs.
Example: If the short-term EMAs collapse below the long-term EMAs and an orange triangle appears, it may signal a shorting opportunity or a time to exit longs.
2. Managing Trades
Use the long-term EMAs as dynamic support (in uptrends) or resistance (in downtrends) to set stop-loss levels or trail stops.
Monitor the spread of the short-term EMAs. A widening spread suggests the trend is strong, while convergence may indicate it’s time to take profits or tighten stops.
3. Anticipating Reversals
Compression signals (yellow triangles) highlight periods of low volatility, often preceding significant price moves. Combine these with price action (e.g., breakouts or reversals) or other indicators (e.g., RSI or volume) for confirmation.
Example: If a compression signal appears near a key support level and the price breaks upward, it could signal the start of a new bullish swing.
4. Best Practices
Timeframes: The indicator works well on daily or 4-hour charts for swing trading, but you can adjust the EMA periods for shorter (e.g., 1-hour) or longer (e.g., weekly) timeframes.
Confirmation: Combine the GMMA with other tools like support/resistance levels, candlestick patterns, or oscillators (e.g., MACD) to reduce false signals.
Risk Management: Always use proper position sizing and stop-losses, as EMAs are lagging indicators and may produce delayed signals in choppy markets.

X HL RangeOverview:
The X Range indicator is a multi-timeframe visualization tool designed to display the high and low price ranges of previous candles from higher timeframes (HTFs) directly on a lower timeframe chart. It helps traders identify significant price zones and potential support/resistance levels by visually representing the price range of up to three previous candles for each selected timeframe.
Key Features:
Multi-Timeframe Support: The indicator supports three configurable higher timeframes (default: 60 min, 15 min, 5 min) which can be independently toggled on or off.
Custom Candle Range Display: For each enabled timeframe, users can choose to display the range of the most recent 1, 2, or 3 completed candles.
Dynamic Box Drawing: Price ranges are highlighted using rectangular boxes that extend across the chart to show where the highs and lows of each selected HTF candle occurred.
Custom Styling: Each timeframe's boxes can be individually styled with user-defined background and border colors to suit visual preferences or chart themes.
Efficient Redrawing: Boxes update in real-time as new higher timeframe candles complete, and previous boxes are removed to prevent chart clutter.
Use Case:
This indicator is particularly useful for intraday traders who want to align entries and exits with higher timeframe levels. By visualizing previous HTF ranges on a lower timeframe chart, traders gain contextual awareness of where price is likely to react or consolidate, aiding in decision-making for breakouts, reversals, or trend continuation setups.

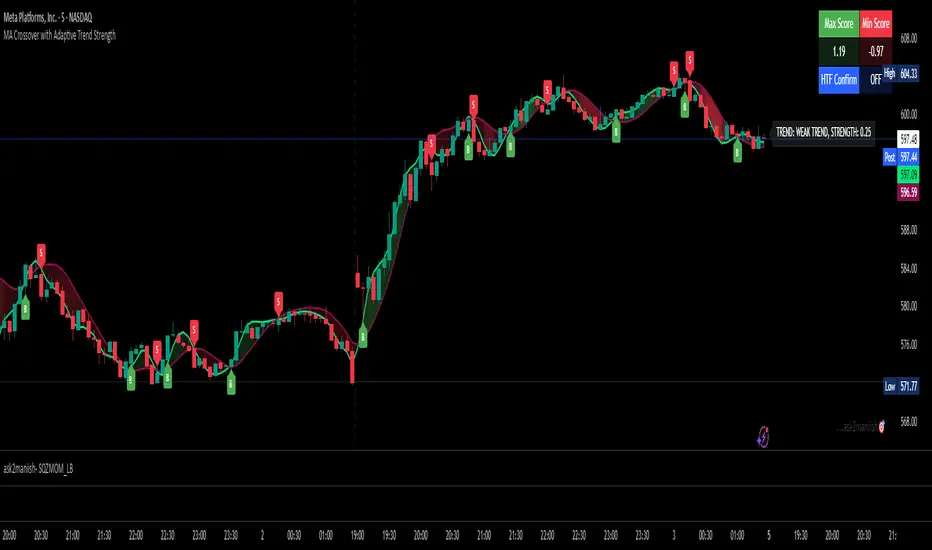
MA Crossover with Adaptive Trend Strength📘 MA Crossover with Adaptive Trend Strength —
📌 Overview
This TradingView indicator plots two moving averages (Fast & Slow) with user-selected types (T3, EMA, SMA, HMA), visual crossovers, and dynamically calculates an adaptive trend strength score using Z-scores of multiple features. Optional higher timeframe (HTF) confirmation is supported. A color-filled region between the MAs visually indicates momentum direction.
⚙️ Inputs & Controls
📈 Moving Average Settings
Fast MA Length: Length of the fast-moving average (default: 9).
Slow MA Length: Length of the slow-moving average (default: 21).
MA Type: Type of moving average used (T3, EMA, SMA, HMA).
Source: Input data source (default: close).
T3 Volume Factor: Only used when T3 is selected, controls smoothing (range: 0–1).
🎨 Visual Controls
Bullish Fill Color: Fill color when Fast MA is above Slow MA.
Bearish Fill Color: Fill color when Fast MA is below Slow MA.
Show Gradient Fill: Enable or disable the colored area between Fast & Slow MAs.
Trend Label Position: Choose where the trend strength label appears (top or bottom).
Label Update Interval: Number of bars between label updates (reduces clutter).
⏱ Multi-Timeframe Support
Higher Timeframe: Timeframe used for confirmation (default: 60 min).
Use HTF Confirmation: Enables filtering of trend score by higher timeframe trend direction.
📊 Lookback Configuration
Auto Lookback Based on Timeframe: Dynamically adapts scoring lookback period per chart timeframe.
Manual Lookback: Manual fallback lookback length when auto is off.
🧮 MA Calculation Options
T3 MA: Custom T3 function with exponential moving averages and volume factor.
EMA/SMA: Built-in Pine functions (ta.ema, ta.sma).
HMA: Hull Moving Average using WMA calculations.
📉 Trend Strength Calculation
🧠 Z-Score Inputs
Distance between MAs (zDist)
Slope of the Fast MA (zSlope)
Volume (zVol)
ATR (zATR)
📏 Choppiness & Adaptive Weighting
A Choppiness Index (based on ATR & price range) reduces score impact in sideways markets.
Dynamically adjusts Z-score weights:
W1: Distance
W2: Slope
W3: Volume
W4: ATR
🔁 HTF Confirmation
Optionally multiplies the trend score by the direction of the higher timeframe trend to filter noise.
🟩 Plot & Visual Elements
📊 MA Lines
Plots Fast and Slow MA lines in colors based on selected MA type.
🌈 Gradient Fill
Fills the area between Fast and Slow MAs with opacity proportional to their difference.
Colors based on bullish/bearish condition.
🏷️ Trend Strength Label
Updates every n bars (Label Update Interval).
Shows:
Trend Classification: Weak, Moderate, Strong
Numerical Score
Label position (top or bottom) is configurable.
🔔 Crossover Signals
Bullish Crossover ("B"): Fast MA crosses above Slow MA.
Bearish Crossover ("S"): Fast MA crosses below Slow MA.
Labels are plotted at crossover points.
Old labels are removed after a threshold (100) to reduce chart clutter.
📋 Score Summary Table
A table showing:
Max Score within the lookback period
Min Score
HTF Confirmation Status (ON / OFF)
Updates on the same user-defined interval as the trend label.
🚨 Alerts
Condition Description
Bullish MA Cross Fast MA crosses above Slow MA
Bearish MA Cross Fast MA crosses below Slow MA
These are provided via alertcondition() for use in alert creation.
📌 Customization Tips
Turn off the gradient fill for a cleaner chart.
Use HTF confirmation to reduce false positives in ranging markets.
Adjust label update frequency to prevent visual clutter on faster timeframes.
Use T3 MA with volume factor for smoother signals in volatile markets.
[TTM] ICT Sessions & Ranges🌟 Overview 🌟
The ICT Sessions & Ranges Indicator helps traders identify key intraday price levels by marking custom session highs/lows and opening ranges.
It helps traders spot potential liquidity grabs, reversals, and breakout zones by tracking price behavior around these key areas
🌟 Session Highs & Lows – Liquidity Zones 🌟
Session highs and lows often attract price due to stop orders resting above or below them. These levels are frequently targeted during high-volatility moves.
🔹 Asia Session
- Usually ranges in low volatility.
- Highs/lows often get swept during early London.
- Price may raid these levels, then reverse.
🔹 London Session
- First major volatility of the day.
- Highs/lows often tested or swept in New York.
- Commonly forms the day’s true high or low.
🌟 Opening Range Concepts 🌟
The Opening Range is the first 15, 30, or 60 minutes of a session (e.g., New York).
The high (ORH) and low (ORL) define the market’s initial balance and key reaction levels.
🔹 Breakout Trade
- Price breaks ORH/ORL with momentum.
- Signals directional intent.
- Traders enter on the breakout, with stops inside the range.
🔹 Liquidity Raid
- Price briefly breaks ORH/ORL to trigger stops.
- Reverses after the sweep.
- Look for structure shift and entry near FVG or OB.
🌟 Customizable Settings 🌟
The indicator includes 3 configurable ranges , each with:
Start & End Time – Set any custom time window.
Display Type – Choose Box (highlight range) or Lines (mark high/low).
Color Settings – Set custom colors for boxes and lines.
🌟 Default Settings 🌟
Range 1 : 19:00–00:00 (Asia Session)
Range 2 : 01:45–05:15 (London Session)
Range 3 : 09:30–10:00 (NY Opening Range – 30m)

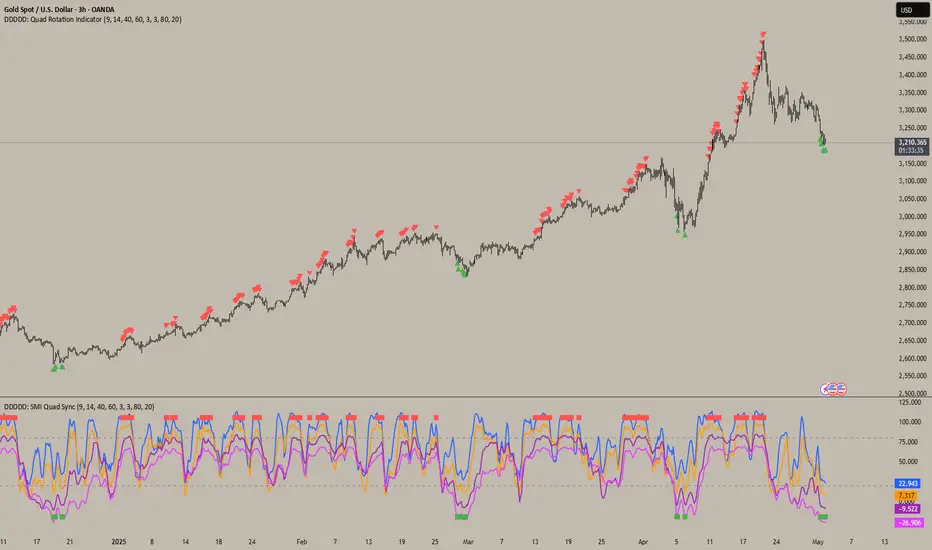
DDDDD: SMI Quad Sync📄DDDDD: SMI Quad Sync
A multi-timeframe momentum synchronization indicator using 4 Stochastic Oscillators with different lengths (9, 14, 40, 60) to detect collective oversold and overbought zones.
✅ Key Features:
Plots 4 stochastic lines with vertical offsets for better visual separation.
Generates a Long Signal (green square) when all 4 stochastics are below the oversold level.
Generates a Short Signal (red square) when all 4 stochastics are above the overbought level.
Use signals to confirm multi-timeframe momentum alignment or exhaustion.
🎯 How to Use:
Look for green square → potential LONG entry: signals multi-timeframe oversold condition.
Look for red square → potential SHORT entry: signals multi-timeframe overbought condition.
Combine with trend analysis, price action, or other confirmation for optimal entries.
📝 Notes:
The plotted stochastic lines are visually shifted (offset) for clarity; signals are computed from raw, unshifted values.
Designed for traders who prefer confluence across different stochastic lookback periods to improve confidence.
👉 Ideal for scalping, swing trading, or as a momentum filter in broader strategies.
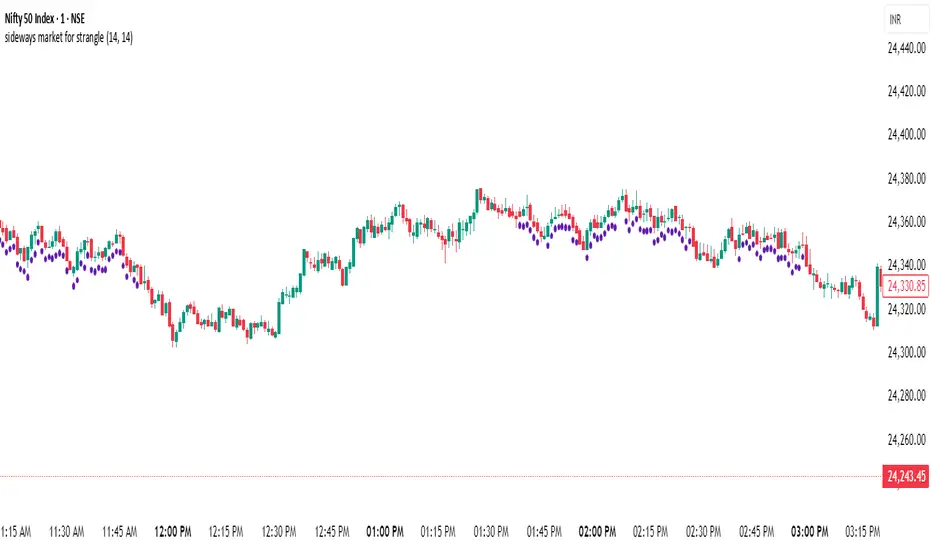
sideways market for strangleThis Pine Script is designed to identify **sideways or range-bound markets**, which are often ideal conditions for trading **options strangle strategies**. Here's a breakdown of what the script does:
---
### 🛠 **Purpose:**
To **detect low-volatility, sideways market conditions** where price is not trending strongly in either direction — suitable for **neutral options strategies like short strangles**.
---
### 📌 **Key Components:**
#### 1. **Inputs:**
- `RSI Length`: Default 14 — used for calculating the Relative Strength Index (RSI).
- `ADX Length`: Default 14 — used for calculating the Average Directional Index (ADX), DI+ (positive directional movement), and DI- (negative directional movement).
#### 2. **RSI Calculation:**
- `rsiValue` is calculated using the built-in `ta.rsi(close, rsiLength)`.
- A **sideways market** is expected when RSI is in the **40–60 range**, indicating lack of strong momentum.
#### 3. **ADX and Directional Indicators (DI+ and DI-):**
- `diPlus` and `diMinus` are calculated based on recent price movements and the True Range.
- `dx` (Directional Index) measures the strength of trend direction using the difference between DI+ and DI-.
- `adx` is a smoothed version of `dx` and represents **overall trend strength**.
#### 4. **Sideways Market Conditions:**
- **RSI Condition**: RSI is between 40 and 60.
- **ADX Condition**:
- `adx <= 25` → Weak or no trend.
- `adx < diPlus` and `adx < diMinus` → Confirms ADX is lower than directional components, reducing likelihood of a trending market.
#### 5. **Signal Plot:**
- A **green label below the bar** (`shape.labelup`) is plotted when both conditions are met.
- Indicates potential sideways market conditions.
---
### ✅ **Use Case:**
- This signal can help identify **low-volatility zones** suitable for **short strangles** or **iron condors**, where you profit from time decay while expecting the price to stay within a range.
PowerHouse SwiftEdge AI v2.10 StrategyOverview
The PowerHouse SwiftEdge AI v2.10 Strategy is a sophisticated trading system designed to identify high-probability trade setups in forex, stocks, and cryptocurrencies. By combining multi-timeframe trend analysis, momentum signals, volume confirmation, and smart money concepts (Change of Character and Break of Structure ), this strategy offers traders a robust tool to capitalize on market trends while minimizing false signals. The strategy’s unique “AI” component analyzes trends across multiple timeframes to provide a clear, actionable dashboard, making it accessible for both novice and experienced traders. The strategy is fully customizable, allowing users to tailor its filters to their trading style.
What It Does
This strategy generates Buy and Sell signals based on a confluence of technical indicators and smart money concepts. It uses:
Multi-Timeframe Trend Analysis: Confirms the market’s direction by analyzing trends on the 1-hour (60M), 4-hour (240M), and daily (D) timeframes.
Momentum Filter: Ensures trades align with strong price movements to avoid choppy markets.
Volume Filter: Validates signals with above-average volume to confirm market participation.
Breakout Filter: Requires price to break key levels for added confirmation.
Smart Money Signals (CHoCH/BOS): Identifies reversals (CHoCH) and trend continuations (BOS) based on pivot points.
AI Trend Dashboard: Summarizes trend strength, confidence, and predictions across timeframes, helping traders make informed decisions without needing to analyze complex data manually.
The strategy also plots dynamic support and resistance trendlines, take-profit (TP) levels, and “Get Ready” signals to alert users of potential setups before they fully develop. Trades are executed with predefined take-profit and stop-loss levels for disciplined risk management.
How It Works
The strategy integrates multiple components to create a cohesive trading system:
Multi-Timeframe Trend Analysis:
The strategy evaluates trends on three timeframes (1H, 4H, Daily) using Exponential Moving Averages (EMA) and Volume-Weighted Average Price (VWAP). A trend is considered bullish if the price is above both the EMA and VWAP, bearish if below, or neutral otherwise.
Signals are only generated when the trend on the user-selected higher timeframe aligns with the trade direction (e.g., Buy signals require a bullish higher timeframe trend). This reduces noise and ensures trades follow the broader market context.
Momentum Filter:
Measures the percentage price change between consecutive bars and compares it to a volatility-adjusted threshold (based on the Average True Range ). This ensures trades are taken only during significant price movements, filtering out low-momentum conditions.
Volume Filter (Optional):
Checks if the current volume exceeds a long-term average and shows positive short-term volume change. This confirms strong market participation, reducing the risk of false breakouts.
Breakout Filter (Optional):
Requires the price to break above (for Buy) or below (for Sell) recent highs/lows, ensuring the signal aligns with a structural shift in the market.
Smart Money Concepts (CHoCH/BOS):
Change of Character (CHoCH): Detects potential reversals when the price crosses under a recent pivot high (for Sell) or over a recent pivot low (for Buy) with a bearish or bullish candle, respectively.
Break of Structure (BOS): Confirms trend continuations when the price breaks below a recent pivot low (for Sell) or above a recent pivot high (for Buy) with strong momentum.
These signals are plotted as horizontal lines with labels, making it easy to visualize key levels.
AI Trend Dashboard:
Combines trend direction, momentum, and volatility (ATR) across timeframes to calculate a trend score. Scores above 0.5 indicate an “Up” trend, below -0.5 indicate a “Down” trend, and otherwise “Neutral.”
Displays a table summarizing trend strength (as a percentage), AI confidence (based on trend alignment), and Cumulative Volume Delta (CVD) for market context.
A second table (optional) shows trend predictions for 1H, 4H, and Daily timeframes, helping traders anticipate future market direction.
Dynamic Trendlines:
Plots support and resistance lines based on recent swing lows and highs within user-defined periods (shortTrendPeriod, longTrendPeriod). These lines adapt to market conditions and are colored based on trend strength.
Why This Combination?
The PowerHouse SwiftEdge AI v2.10 Strategy is original because it seamlessly integrates traditional technical analysis (EMA, VWAP, ATR, volume) with smart money concepts (CHoCH, BOS) and a proprietary AI-driven trend analysis. Unlike standalone indicators, this strategy:
Reduces False Signals: By requiring confluence across trend, momentum, volume, and breakout filters, it minimizes trades in choppy or low-conviction markets.
Adapts to Market Context: The ATR-based momentum threshold adjusts dynamically to volatility, ensuring signals remain relevant in both trending and ranging markets.
Simplifies Decision-Making: The AI dashboard distills complex multi-timeframe data into a user-friendly table, eliminating the need for manual analysis.
Leverages Smart Money: CHoCH and BOS signals capture institutional price action patterns, giving traders an edge in identifying reversals and continuations.
The combination of these components creates a balanced system that aligns short-term trade entries with longer-term market trends, offering a unique blend of precision, adaptability, and clarity.
How to Use
Add to Chart:
Apply the strategy to your TradingView chart on a liquid symbol (e.g., EURUSD, BTCUSD, AAPL) with a timeframe of 60 minutes or lower (e.g., 15M, 60M).
Configure Inputs:
Pivot Length: Adjust the number of bars (default: 5) to detect pivot highs/lows for CHoCH/BOS signals. Higher values reduce noise but may delay signals.
Momentum Threshold: Set the base percentage (default: 0.01%) for momentum confirmation. Increase for stricter signals.
Take Profit/Stop Loss: Define TP and SL in points (default: 10 each) for risk management.
Higher/Lower Timeframe: Choose timeframes (60M, 240M, D) for trend filtering. Ensure the chart timeframe is lower than or equal to the higher timeframe.
Filters: Enable/disable momentum, volume, or breakout filters to suit your trading style.
Trend Periods: Set shortTrendPeriod (default: 30) and longTrendPeriod (default: 100) for trendline plotting. Keep below 2000 to avoid buffer errors.
AI Dashboard: Toggle Enable AI Market Analysis to show/hide the prediction table and adjust its position.
Interpret Signals:
Buy/Sell Labels: Green "Buy" or red "Sell" labels indicate trade entries with predefined TP/SL levels plotted.
Get Ready Signals: Yellow "Get Ready BUY" or orange "Get Ready SELL" labels warn of potential setups.
CHoCH/BOS Lines: Aqua (CHoCH Sell), lime (CHoCH Buy), fuchsia (BOS Sell), or teal (BOS Buy) lines mark key levels.
Trendlines: Green/lime (support) or fuchsia/purple (resistance) dashed lines show dynamic support/resistance.
AI Dashboard: Check the top-right table for trend strength, confidence, and CVD. The optional bottom table shows trend predictions (Up, Down, Neutral).
Backtest and Trade:
Use TradingView’s Strategy Tester to evaluate performance. Adjust TP/SL and filters based on results.
Trade manually based on signals or automate with TradingView alerts (set alerts for Buy/Sell labels).
Originality and Value
The PowerHouse SwiftEdge AI v2.10 Strategy stands out by combining multi-timeframe analysis, smart money concepts, and an AI-driven dashboard into a single, user-friendly system. Its adaptive momentum threshold, robust filtering, and clear visualizations empower traders to make confident decisions without needing advanced technical knowledge. Whether you’re a day trader or swing trader, this strategy provides a versatile, data-driven approach to navigating dynamic markets.
Important Notes:
Risk Management: Always use appropriate position sizing and risk management, as the strategy’s TP/SL levels are customizable.
Symbol Compatibility: Test on liquid symbols with sufficient historical data (at least 2000 bars) to avoid buffer errors.
Performance: Backtest thoroughly to optimize settings for your market and timeframe.

ChopFlow ATR Scalp StrategyA lean, high-velocity scalp framework for NQ and other futures that blends trend clarity, volume confirmation, and adaptive exits to give you precise, actionable signals—no cluttered bands or lagging indicators.
⸻
🔍 Overview
This strategy locks onto rapid intraday moves by:
• Filtering for directional momentum with the Choppiness Index (CI)
• Confirming conviction via On-Balance Volume (OBV) against its moving average
• Automatically sizing stops and targets with a multiple of the Average True Range (ATR)
It’s designed for scalp traders who need clean, timely entries without wading through choppy noise.
⸻
⚙️ Key Features & Inputs
1. ATR Length & Multiplier
• Controls exit distances based on current volatility.
2. Choppiness Length & Threshold
• Measures trend strength; only fires when the market isn’t “stuck in the mud.”
3. OBV SMA Length
• Smoothes volume flow to confirm genuine buying or selling pressure.
4. Custom Session Hours
• Avoid overnight gaps or low-liquidity periods.
All inputs are exposed for rapid tuning to your preferred scalp cadence.
🚀 How It Works
1. Long Entry triggers when:
• CI < threshold (strong trend)
• OBV > its SMA (positive volume flow)
• You’re within the defined session
2. Short Entry mirrors the above (CI < threshold, OBV < SMA)
3. Exit uses ATR × multiplier for both stop-loss and take-profit
⸻
🎯 Usage Tips
• Start with defaults (ATR 14, multiplier 1.5; CI 14, threshold 60; OBV SMA 10).
• Monitor signal frequency, then tighten/loosen CI or OBV look-back as needed.
• Pair with a fast MA crossover or price-action trigger if you want even sharper timing.
• Backtest across different sessions (early open vs. power hours) to find your edge.
⸻
⚠️ Disclaimer
This script is provided “as-is” for educational and research purposes. Always paper-trade any new setup extensively before deploying live capital, and adjust risk parameters to your personal tolerance.
⸻
Elevate your scalp game with ChopFlow ATR—where trend, volume, and volatility converge for clear, confident entries. Happy scalping!

Dskyz (DAFE) Adaptive Regime - Quant Machine ProDskyz (DAFE) Adaptive Regime - Quant Machine Pro:
Buckle up for the Dskyz (DAFE) Adaptive Regime - Quant Machine Pro, is a strategy that’s your ultimate edge for conquering futures markets like ES, MES, NQ, and MNQ. This isn’t just another script—it’s a quant-grade powerhouse, crafted with precision to adapt to market regimes, deliver multi-factor signals, and protect your capital with futures-tuned risk management. With its shimmering DAFE visuals, dual dashboards, and glowing watermark, it turns your charts into a cyberpunk command center, making trading as thrilling as it is profitable.
Unlike generic scripts clogging up the space, the Adaptive Regime is a DAFE original, built from the ground up to tackle the chaos of futures trading. It identifies market regimes (Trending, Range, Volatile, Quiet) using ADX, Bollinger Bands, and HTF indicators, then fires trades based on a weighted scoring system that blends candlestick patterns, RSI, MACD, and more. Add in dynamic stops, trailing exits, and a 5% drawdown circuit breaker, and you’ve got a system that’s as safe as it is aggressive. Whether you’re a newbie or a prop desk pro, this strat’s your ticket to outsmarting the markets. Let’s break down every detail and see why it’s a must-have.
Why Traders Need This Strategy
Futures markets are a gauntlet—fast moves, volatility spikes (like the April 28, 2025 NQ 1k-point drop), and institutional traps that punish the unprepared. Meanwhile, platforms are flooded with low-effort scripts that recycle old ideas with zero innovation. The Adaptive Regime stands tall, offering:
Adaptive Intelligence: Detects market regimes (Trending, Range, Volatile, Quiet) to optimize signals, unlike one-size-fits-all scripts.
Multi-Factor Precision: Combines candlestick patterns, MA trends, RSI, MACD, volume, and HTF confirmation for high-probability trades.
Futures-Optimized Risk: Calculates position sizes based on $ risk (default: $300), with ATR or fixed stops/TPs tailored for ES/MES.
Bulletproof Safety: 5% daily drawdown circuit breaker and trailing stops keep your account intact, even in chaos.
DAFE Visual Mastery: Pulsing Bollinger Band fills, dynamic SL/TP lines, and dual dashboards (metrics + position) make signals crystal-clear and charts a work of art.
Original Craftsmanship: A DAFE creation, built with community passion, not a rehashed clone of generic code.
Traders need this because it’s a complete, adaptive system that blends quant smarts, user-friendly design, and DAFE flair. It’s your edge to trade with confidence, cut through market noise, and leave the copycats in the dust.
Strategy Components
1. Market Regime Detection
The strategy’s brain is its ability to classify market conditions into five regimes, ensuring signals match the environment.
How It Works:
Trending (Regime 1): ADX > 20, fast/slow EMA spread > 0.3x ATR, HTF RSI > 50 or MACD bullish (htf_trend_bull/bear).
Range (Regime 2): ADX < 25, price range < 3% of close, no HTF trend.
Volatile (Regime 3): BB width > 1.5x avg, ATR > 1.2x avg, HTF RSI overbought/oversold.
Quiet (Regime 4): BB width < 0.8x avg, ATR < 0.9x avg.
Other (Regime 5): Default for unclear conditions.
Indicators: ADX (14), BB width (20), ATR (14, 50-bar SMA), HTF RSI (14, daily default), HTF MACD (12,26,9).
Why It’s Brilliant:
Regime detection adapts signals to market context, boosting win rates in trending or volatile conditions.
HTF RSI/MACD add a big-picture filter, rare in basic scripts.
Visualized via gradient background (green for Trending, orange for Range, red for Volatile, gray for Quiet, navy for Other).
2. Multi-Factor Signal Scoring
Entries are driven by a weighted scoring system that combines candlestick patterns, trend, momentum, and volume for robust signals.
Candlestick Patterns:
Bullish: Engulfing (0.5), hammer (0.4 in Range, 0.2 else), morning star (0.2), piercing (0.2), double bottom (0.3 in Volatile, 0.15 else). Must be near support (low ≤ 1.01x 20-bar low) with volume spike (>1.5x 20-bar avg).
Bearish: Engulfing (0.5), shooting star (0.4 in Range, 0.2 else), evening star (0.2), dark cloud (0.2), double top (0.3 in Volatile, 0.15 else). Must be near resistance (high ≥ 0.99x 20-bar high) with volume spike.
Logic: Patterns are weighted higher in specific regimes (e.g., hammer in Range, double bottom in Volatile).
Additional Factors:
Trend: Fast EMA (20) > slow EMA (50) + 0.5x ATR (trend_bull, +0.2); opposite for trend_bear.
RSI: RSI (14) < 30 (rsi_bull, +0.15); > 70 (rsi_bear, +0.15).
MACD: MACD line > signal (12,26,9, macd_bull, +0.15); opposite for macd_bear.
Volume: ATR > 1.2x 50-bar avg (vol_expansion, +0.1).
HTF Confirmation: HTF RSI < 70 and MACD bullish (htf_bull_confirm, +0.2); RSI > 30 and MACD bearish (htf_bear_confirm, +0.2).
Scoring:
bull_score = sum of bullish factors; bear_score = sum of bearish. Entry requires score ≥ 1.0.
Example: Bullish engulfing (0.5) + trend_bull (0.2) + rsi_bull (0.15) + htf_bull_confirm (0.2) = 1.05, triggers long.
Why It’s Brilliant:
Multi-factor scoring ensures signals are confirmed by multiple market dynamics, reducing false positives.
Regime-specific weights make patterns more relevant (e.g., hammers shine in Range markets).
HTF confirmation aligns with the big picture, a quant edge over simplistic scripts.
3. Futures-Tuned Risk Management
The risk system is built for futures, calculating position sizes based on $ risk and offering flexible stops/TPs.
Position Sizing:
Logic: Risk per trade (default: $300) ÷ (stop distance in points * point value) = contracts, capped at max_contracts (default: 5). Point value = tick value (e.g., $12.5 for ES) * ticks per point (4) * contract multiplier (1 for ES, 0.1 for MES).
Example: $300 risk, 8-point stop, ES ($50/point) → 0.75 contracts, rounded to 1.
Impact: Precise sizing prevents over-leverage, critical for micro contracts like MES.
Stops and Take-Profits:
Fixed: Default stop = 8 points, TP = 16 points (2:1 reward/risk).
ATR-Based: Stop = 1.5x ATR (default), TP = 3x ATR, enabled via use_atr_for_stops.
Logic: Stops set at swing low/high ± stop distance; TPs at 2x stop distance from entry.
Impact: ATR stops adapt to volatility, while fixed stops suit stable markets.
Trailing Stops:
Logic: Activates at 50% of TP distance. Trails at close ± 1.5x ATR (atr_multiplier). Longs: max(trail_stop_long, close - ATR * 1.5); shorts: min(trail_stop_short, close + ATR * 1.5).
Impact: Locks in profits during trends, a game-changer in volatile sessions.
Circuit Breaker:
Logic: Pauses trading if daily drawdown > 5% (daily_drawdown = (max_equity - equity) / max_equity).
Impact: Protects capital during black swan events (e.g., April 27, 2025 ES slippage).
Why It’s Brilliant:
Futures-specific inputs (tick value, multiplier) make it plug-and-play for ES/MES.
Trailing stops and circuit breaker add pro-level safety, rare in off-the-shelf scripts.
Flexible stops (ATR or fixed) suit different trading styles.
4. Trade Entry and Exit Logic
Entries and exits are precise, driven by bull_score/bear_score and protected by drawdown checks.
Entry Conditions:
Long: bull_score ≥ 1.0, no position (position_size <= 0), drawdown < 5% (not pause_trading). Calculates contracts, sets stop at swing low - stop points, TP at 2x stop distance.
Short: bear_score ≥ 1.0, position_size >= 0, drawdown < 5%. Stop at swing high + stop points, TP at 2x stop distance.
Logic: Tracks entry_regime for PNL arrays. Closes opposite positions before entering.
Exit Conditions:
Stop-Loss/Take-Profit: Hits stop or TP (strategy.exit).
Trailing Stop: Activates at 50% TP, trails by ATR * 1.5.
Emergency Exit: Closes if price breaches stop (close < long_stop_price or close > short_stop_price).
Reset: Clears stop/TP prices when flat (position_size = 0).
Why It’s Brilliant:
Score-based entries ensure multi-factor confirmation, filtering out weak signals.
Trailing stops maximize profits in trends, unlike static exits in basic scripts.
Emergency exits add an extra safety layer, critical for futures volatility.
5. DAFE Visuals
The visuals are pure DAFE magic, blending function with cyberpunk flair to make signals intuitive and charts stunning.
Shimmering Bollinger Band Fill:
Display: BB basis (20, white), upper/lower (green/red, 45% transparent). Fill pulses (30–50 alpha) by regime, with glow (60–95 alpha) near bands (close ≥ 0.995x upper or ≤ 1.005x lower).
Purpose: Highlights volatility and key levels with a futuristic glow.
Visuals make complex regimes and signals instantly clear, even for newbies.
Pulsing effects and regime-specific colors add a DAFE signature, setting it apart from generic scripts.
BB glow emphasizes tradeable levels, enhancing decision-making.
Chart Background (Regime Heatmap):
Green — Trending Market: Strong, sustained price movement in one direction. The market is in a trend phase—momentum follows through.
Orange — Range-Bound: Market is consolidating or moving sideways, with no clear up/down trend. Great for mean reversion setups.
Red — Volatile Regime: High volatility, heightened risk, and larger/faster price swings—trade with caution.
Gray — Quiet/Low Volatility: Market is calm and inactive, with small moves—often poor conditions for most strategies.
Navy — Other/Neutral: Regime is uncertain or mixed; signals may be less reliable.
Bollinger Bands Glow (Dynamic Fill):
Neon Red Glow — Warning!: Price is near or breaking above the upper band; momentum is overstretched, watch for overbought conditions or reversals.
Bright Green Glow — Opportunity!: Price is near or breaking below the lower band; market could be oversold, prime for bounce or reversal.
Trend Green Fill — Trending Regime: Fills between bands with green when the market is trending, showing clear momentum.
Gold/Yellow Fill — Range Regime: Fills with gold/aqua in range conditions, showing the market is sideways/oscillating.
Magenta/Red Fill — Volatility Spike: Fills with vivid magenta/red during highly volatile regimes.
Blue Fill — Neutral/Quiet: A soft blue glow for other or uncertain market states.
Moving Averages:
Display: Blue fast EMA (20), red slow EMA (50), 2px.
Purpose: Shows trend direction, with trend_dir requiring ATR-scaled spread.
Dynamic SL/TP Lines:
Display: Pulsing colors (red SL, green TP for Trending; yellow/orange for Range, etc.), 3px, with pulse_alpha for shimmer.
Purpose: Tracks stops/TPs in real-time, color-coded by regime.
6. Dual Dashboards
Two dashboards deliver real-time insights, making the strat a quant command center.
Bottom-Left Metrics Dashboard (2x13):
Metrics: Mode (Active/Paused), trend (Bullish/Bearish/Neutral), ATR, ATR avg, volume spike (YES/NO), RSI (value + Oversold/Overbought/Neutral), HTF RSI, HTF trend, last signal (Buy/Sell/None), regime, bull score.
Display: Black (29% transparent), purple title, color-coded (green for bullish, red for bearish).
Purpose: Consolidates market context and signal strength.
Top-Right Position Dashboard (2x7):
Metrics: Regime, position side (Long/Short/None), position PNL ($), SL, TP, daily PNL ($).
Display: Black (29% transparent), purple title, color-coded (lime for Long, red for Short).
Purpose: Tracks live trades and profitability.
Why It’s Brilliant:
Dual dashboards cover market context and trade status, a rare feature.
Color-coding and concise metrics guide beginners (e.g., green “Buy” = go).
Real-time PNL and SL/TP visibility empower disciplined trading.
7. Performance Tracking
Logic: Arrays (regime_pnl_long/short, regime_win/loss_long/short) track PNL and win/loss by regime (1–5). Updated on trade close (barstate.isconfirmed).
Purpose: Prepares for future adaptive thresholds (e.g., adjust bull_score min based on regime performance).
Why It’s Brilliant: Lays the groundwork for self-optimizing logic, a quant edge over static scripts.
Key Features
Regime-Adaptive: Optimizes signals for Trending, Range, Volatile, Quiet markets.
Futures-Optimized: Precise sizing for ES/MES with tick-based risk inputs.
Multi-Factor Signals: Candlestick patterns, RSI, MACD, and HTF confirmation for robust entries.
Dynamic Exits: ATR/fixed stops, 2:1 TPs, and trailing stops maximize profits.
Safe and Smart: 5% drawdown breaker and emergency exits protect capital.
DAFE Visuals: Shimmering BB fill, pulsing SL/TP, and dual dashboards.
Backtest-Ready: Fixed qty and tick calc for accurate historical testing.
How to Use
Add to Chart: Load on a 5min ES/MES chart in TradingView.
Configure Inputs: Set instrument (ES/MES), tick value ($12.5/$1.25), multiplier (1/0.1), risk ($300 default). Enable ATR stops for volatility.
Monitor Dashboards: Bottom-left for regime/signals, top-right for position/PNL.
Backtest: Run in strategy tester to compare regimes.
Live Trade: Connect to Tradovate or similar. Watch for slippage (e.g., April 27, 2025 ES issues).
Replay Test: Try April 28, 2025 NQ drop to see regime shifts and stops.
Disclaimer
Trading futures involves significant risk of loss and is not suitable for all investors. Past performance does not guarantee future results. Backtest results may differ from live trading due to slippage, fees, or market conditions. Use this strategy at your own risk, and consult a financial advisor before trading. Dskyz (DAFE) Trading Systems is not responsible for any losses incurred.
Backtesting:
Frame: 2023-09-20 - 2025-04-29
Slippage: 3
Fee Typical Range (per side, per contract)
CME Exchange $1.14 – $1.20
Clearing $0.10 – $0.30
NFA Regulatory $0.02
Firm/Broker Commis. $0.25 – $0.80 (retail prop)
TOTAL $1.60 – $2.30 per side
Round Turn: (enter+exit) = $3.20 – $4.60 per contract
Final Notes
The Dskyz (DAFE) Adaptive Regime - Quant Machine Pro is more than a strategy—it’s a revolution. Crafted with DAFE’s signature precision, it rises above generic scripts with adaptive regimes, quant-grade signals, and visuals that make trading a thrill. Whether you’re scalping MES or swinging ES, this system empowers you to navigate markets with confidence and style. Join the DAFE crew, light up your charts, and let’s dominate the futures game!
(This publishing will most likely be taken down do to some miscellaneous rule about properly displaying charting symbols, or whatever. Once I've identified what part of the publishing they want to pick on, I'll adjust and repost.)
Use it with discipline. Use it with clarity. Trade smarter.
**I will continue to release incredible strategies and indicators until I turn this into a brand or until someone offers me a contract.
Created by Dskyz, powered by DAFE Trading Systems. Trade smart, trade bold.
