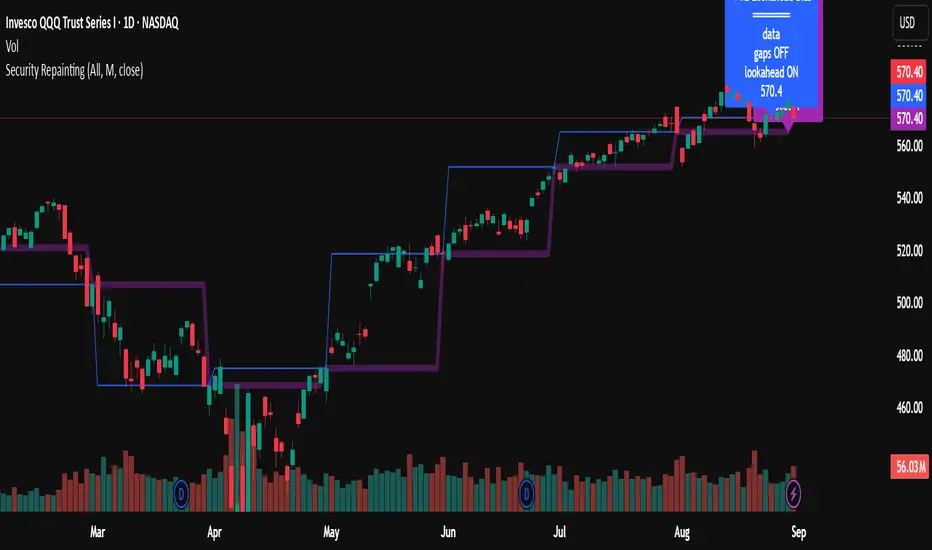
How to avoid repainting when using security() - viewing optionsHow to avoid repainting when using the security() - Edited PineCoders FAQ with more viewing options
This may be of value to a limited few, but I've introduced a set of Boolean inputs to PineCoders' original script because viewing all the various security lines at once was giving me a brain cramp. I wanted to study each behavior one-by-one. This version (also updated to PineScript v6) will allow users to selectively display each, or any combination, of the security plots. Each plot was updated to include a condition tied to its corresponding input, ensuring it only appears when explicitly enabled. The label-rendering logic only displays when its related plot is active; however, I've also added an input that allows you to remove all labels, enabling you to see the price action more clearly (the labels can sometimes obscure what you want to see). Run this script in replay mode to view the nuanced differences between the 12 methods while selecting/deselecting the desired plots (selecting all at once can be overcrowded and confusing).
All thanks and credit to PineCoders--these changes I made only provide more control over what’s shown on the chart without altering the core structure or intent of the original script. It helped me, so I thought I should share it. If I inadvertently messed something up, please let me know, and I will try to fix it.
I set the defaults for viewing monthly security functions on the daily timeframe. Only the first 2 security functions plot with the default settings, so change the settings as needed. Be sure to read the original notes and detailed explanations in the PineCoders posting "How to avoid repainting when using security() - PineCoders FAQ."
Bottom line, you should use one of the two functions: f_secureSecurity or f_security, depending on what you are trying to do. Hopefully, this script will make it a little easier for the visual learner to understand why (use replay mode or watch live price action on a lower timeframe).
"美联储议息会议12月时间" için komut dosyalarını ara
Future Value ProjectionFuture Value Projection with Actual CAGR
This indicator calculates the future value (FV) of the current ticker’s price using its historical Compound Annual Growth Rate (CAGR). It measures how much the price has grown over a chosen lookback period, derives the average annual growth rate, and then projects the current price forward into the future.
Formulae:
CAGR:
CAGR = ( PV_now / PV_past )^(1 / t) - 1
Future Value:
FV = PV_now × ( 1 + CAGR / n )^( n × T )
Where:
PV_now = Current price
PV_past = Price t years ago
t = Lookback period (years)
CAGR = Compound Annual Growth Rate
n = Compounding periods per year (1=annual, 12=monthly, 252=daily, etc.)
T = Projection horizon (years forward)
How it works:
Select a lookback period (e.g., 3 years).
The script finds the price from that time and computes the CAGR.
It then projects the current price forward by T years using the CAGR.
The chart shows:
Current price (blue)
Projected FV target (green)
A table with CAGR and projection details
Use case:
Helps investors and traders visualize long-term growth projections if the ticker continues growing at its historical pace.

HawkEye EMA Cloud
# HawkEye EMA Cloud - Enhanced Multi-Timeframe EMA Analysis
## Overview
The HawkEye EMA Cloud is an advanced technical analysis indicator that visualizes multiple Exponential Moving Average (EMA) relationships through dynamic color-coded cloud formations. This enhanced version builds upon the original Ripster EMA Clouds concept with full customization capabilities.
## Credits
**Original Author:** Ripster47 (Ripster EMA Clouds)
**Enhanced Version:** HawkEye EMA Cloud with advanced customization features
## Key Features
### 🎨 **Full Color Customization**
- Individual bullish and bearish colors for each of the 5 EMA clouds
- Customizable rising and falling colors for EMA lines
- Adjustable opacity levels (0-100%) for each cloud independently
### 📊 **Multi-Layer EMA Analysis**
- **5 Configurable EMA Cloud Pairs:**
- Cloud 1: 8/9 EMAs (default)
- Cloud 2: 5/12 EMAs (default)
- Cloud 3: 34/50 EMAs (default)
- Cloud 4: 72/89 EMAs (default)
- Cloud 5: 180/200 EMAs (default)
### ⚙️ **Advanced Customization Options**
- Toggle individual clouds on/off
- Adjustable EMA periods for all timeframes
- Optional EMA line display with color coding
- Leading period offset for cloud projection
- Choice between EMA and SMA calculations
- Configurable source data (HL2, Close, Open, etc.)
## How It Works
### Cloud Formation
Each cloud is formed by the area between two EMAs of different periods. The cloud color dynamically changes based on:
- **Bullish (Green/Custom):** When the shorter EMA is above the longer EMA
- **Bearish (Red/Custom):** When the shorter EMA is below the longer EMA
### Multiple Timeframe Analysis
The indicator provides a comprehensive view of trend strength across multiple timeframes:
- **Short-term:** Clouds 1-2 (faster EMAs)
- **Medium-term:** Cloud 3 (intermediate EMAs)
- **Long-term:** Clouds 4-5 (slower EMAs)
## Trading Applications
### Trend Identification
- **Strong Uptrend:** Multiple clouds stacked bullishly with price above
- **Strong Downtrend:** Multiple clouds stacked bearishly with price below
- **Consolidation:** Mixed cloud colors indicating sideways movement
### Entry Signals
- **Bullish Entry:** Price breaking above bearish clouds turning bullish
- **Bearish Entry:** Price breaking below bullish clouds turning bearish
- **Confluence:** Multiple cloud confirmations strengthen signal reliability
### Support/Resistance Levels
- Cloud boundaries often act as dynamic support and resistance
- Thicker clouds (higher opacity) may provide stronger S/R levels
- Multiple cloud intersections create significant price levels
## Customization Guide
### Color Schemes
Create your own visual style by customizing:
1. **Bullish/Bearish colors** for each cloud pair
2. **Rising/Falling colors** for EMA lines
3. **Opacity levels** to layer clouds effectively
### Recommended Settings
- **Day Trading:** Focus on Clouds 1-2 with higher opacity
- **Swing Trading:** Use Clouds 1-3 with moderate opacity
- **Position Trading:** Emphasize Clouds 3-5 with lower opacity
## Technical Specifications
- **Version:** Pine Script v6
- **Type:** Overlay indicator
- **Calculations:** Real-time EMA computations
- **Performance:** Optimized for all timeframes
- **Alerts:** Configurable long/short alerts available
## Risk Disclaimer
This indicator is for educational and informational purposes only. Always combine with proper risk management and additional analysis before making trading decisions. Past performance does not guarantee future results.
---
*Enhanced and customized version of the original Ripster EMA Clouds by Ripster47. This modification adds comprehensive color customization and enhanced user control while preserving the core analytical framework.*

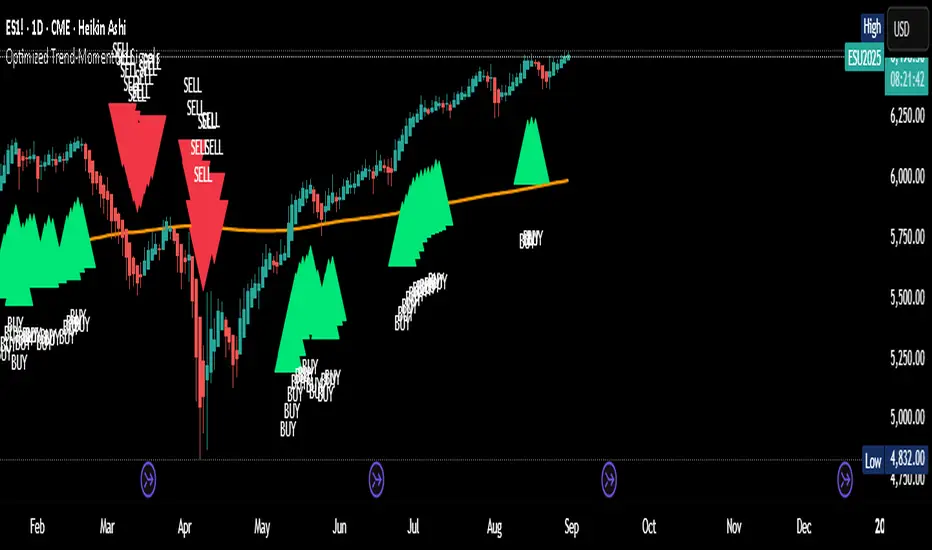
Optimized Trend-Momentum SignalsThis indicator combines trend, momentum, and volume-strength factors into a single buy/sell signal system. It integrates:
SMA 200 → Identifies the long-term trend (price above = bullish bias, below = bearish bias).
MACD (12,26,9) → Confirms momentum direction with line crossovers.
RSI (7) → Filters strength (above 50 = bullish, below 50 = bearish).
ROC (45) → Validates positive or negative rate of change.
Signal Logic:
Buy Signal → Price above SMA 200, MACD bullish, RSI > 50, and ROC > 0.
Sell Signal → Price below SMA 200, MACD bearish, RSI < 50, and ROC < 0.
Features:
Clear arrows for BUY and SELL signals.
Long-term SMA plotted for trend visualization.
Alerts built-in for real-time notifications.
This tool helps traders filter out noise and act only when all major confirmation factors align, reducing false signals and improving decision-making.
Persistence# Persistence
## What it does
Measures **price change persistence**, defined as the percentage of bars within a lookback window that closed higher than the prior close. A high value means the instrument has been closing up frequently, which can indicate durable momentum. This mirrors Stockbee’s idea: *select stocks with high price change persistence*, and then combine **momentum plus persistence**.
## Can be used for scanning in PineScreener
## Calculation
* `isUp` is true when `close > close `.
* `countUp` counts true instances over the last `len` bars.
* `pctUp = 100 * countUp / len`, bounded between 0 and 100.
* A 50% level is a natural baseline. Above 50% suggests more up closes than down closes in the window.
## Inputs
* **Lookback bars (`len`)**: default 252 for roughly one trading year on a daily chart. On weekly charts use something like 52, on monthly charts use 12.
## How to use
1. **Screen for persistence**
Sort a watchlist by the plotted value, higher is better. Many momentum traders start looking above 58 to 65 percent, then layer a trend filter.
2. **Combine with momentum**
Examples, pick tickers with:
* `pctUp > 60`, and price above a rising EMA50 or EMA100.
* `pctUp rising` and weekly ROC positive.
3. **Switch timeframe to change the horizon**
* Daily chart with `len = 252` approximates one year.
* Weekly chart with `len = 52` approximates one year.
* Monthly chart with `len = 12` approximates one year.
## TC2000 equivalence
Stockbee’s TC2000 expression:
```
CountTrue(c > c1, 252)
```
## Interpretation guide
* **70 to 90**: very strong persistence; often trend leaders, check for extensions and risk controls.
* **60 to 70**: constructive persistence; good hunting ground for swing setups that also pass momentum filters.
* **50**: neutral baseline; around random up vs down frequency.
* **Below 50**: persistent weakness; consider only for mean reversion or short strategies.
## Practical tips
* **Event effects**: ex-dividend gaps can reduce persistence on high yield names. Earnings gaps can swing the value sharply.
* **Survivorship bias**: when backtesting on curated lists, persistence can look cleaner than in live scans.
* **Liquidity**: thin names may show noisy persistence due to erratic prints.
## Reference to Stockbee
* “One way to select stocks for swing trading is to find those with high price change persistence.”
* “Persistence can be calculated on a daily, monthly, or weekly timeframe.”
* TC2000 function: `CountTrue(c > c1, 252)`
* Example noted in the tweet: CVNA had very high one-year price persistence at the time of that post.
* Takeaway: **look for momentum plus persistence**, not persistence alone.

🚀⚠️ Aggressive + Confirmed Long Strategy (v2)//@version=5
strategy("🚀⚠️ Aggressive + Confirmed Long Strategy (v2)",
overlay=true,
pyramiding=0,
initial_capital=10000,
default_qty_type=strategy.percent_of_equity,
default_qty_value=10, // % of equity per trade
commission_type=strategy.commission.percent,
commission_value=0.05)
// ========= Inputs =========
lenRSI = input.int(14, "RSI Length")
lenSMA1 = input.int(20, "SMA 20")
lenSMA2 = input.int(50, "SMA 50")
lenBB = input.int(20, "Bollinger Length")
multBB = input.float(2, "Bollinger Multiplier", step=0.1)
volLen = input.int(20, "Volume MA Length")
smaBuffP = input.float(1.0, "Margin above SMA50 (%)", step=0.1)
confirmOnClose = input.bool(true, "Confirm signals only after candle close")
useEarly = input.bool(true, "Allow Early entries")
// Risk
atrLen = input.int(14, "ATR Length", minval=1)
slATR = input.float(2.0, "Stop = ATR *", step=0.1)
tpRR = input.float(2.0, "Take-Profit RR (TP = SL * RR)", step=0.1)
useTrail = input.bool(false, "Use Trailing Stop instead of fixed SL/TP")
trailATR = input.float(2.5, "Trailing Stop = ATR *", step=0.1)
moveToBE = input.bool(true, "Move SL to breakeven at 1R TP")
// ========= Indicators =========
// MAs
sma20 = ta.sma(close, lenSMA1)
sma50 = ta.sma(close, lenSMA2)
// RSI
rsi = ta.rsi(close, lenRSI)
rsiEarly = rsi > 45 and rsi < 55
rsiStrong = rsi > 55
// MACD
= ta.macd(close, 12, 26, 9)
macdCross = ta.crossover(macdLine, signalLine)
macdEarly = macdCross and macdLine < 0
macdStrong = macdCross and macdLine > 0
// Bollinger
= ta.bb(close, lenBB, multBB)
bollBreakout = close > bbUpper
// Candle & Volume
bullishCandle = close > open
volCondition = volume > ta.sma(volume, volLen)
// Price vs MAs
smaCondition = close > sma20 and close > sma50 and close > sma50 * (1 + smaBuffP/100.0)
// Confirm-on-close helper
useSignal(cond) =>
confirmOnClose ? (cond and barstate.isconfirmed) : cond
// Entries
confirmedEntry = useSignal(rsiStrong and macdStrong and bollBreakout and bullishCandle and volCondition and smaCondition)
earlyEntry = useSignal(rsiEarly and macdEarly and close > sma20 and bullishCandle) and not confirmedEntry
longSignal = confirmedEntry or (useEarly and earlyEntry)
// ========= Risk Mgmt =========
atr = ta.atr(atrLen)
slPrice = close - atr * slATR
tpPrice = close + (close - slPrice) * tpRR
trailPts = atr * trailATR
// ========= Orders =========
if strategy.position_size == 0 and longSignal
strategy.entry("Long", strategy.long)
if strategy.position_size > 0
if useTrail
// Trailing Stop
strategy.exit("Exit", "Long", trail_points=trailPts, trail_offset=trailPts)
else
// Normal SL/TP
strategy.exit("Exit", "Long", stop=slPrice, limit=tpPrice)
// Move SL to breakeven when TP1 hit
if moveToBE and high >= tpPrice
strategy.exit("BE", "Long", stop=strategy.position_avg_price)
// ========= Plots =========
plot(sma20, title="SMA 20", color=color.orange, linewidth=2)
plot(sma50, title="SMA 50", color=color.new(color.blue, 0), linewidth=2)
plot(bbUpper, title="BB Upper", color=color.new(color.fuchsia, 0))
plot(bbBasis, title="BB Basis", color=color.new(color.gray, 50))
plot(bbLower, title="BB Lower", color=color.new(color.fuchsia, 0))
plotshape(confirmedEntry, title="🚀 Confirmed", location=location.belowbar,
color=color.green, style=shape.labelup, text="🚀", size=size.tiny)
plotshape(earlyEntry, title="⚠️ Early", location=location.belowbar,
color=color.orange, style=shape.labelup, text="⚠️", size=size.tiny)
// ========= Alerts =========
alertcondition(confirmedEntry, title="🚀 Confirmed Entry", message="🚀 {{ticker}} confirmed entry on {{interval}}")
alertcondition(earlyEntry, title="⚠️ Early Entry", message="⚠️ {{ticker}} early entry on {{interval}}")

Session Open Candle MarkerThe "Session Open Candle Marker" is a Pine Script indicator designed for forex and futures traders using Smart Money Concepts (SMC) and RP Profits-inspired strategies. It marks the 15-minute opening range candles for the Asia, London, and NY sessions, where institutional "big players" often gather liquidity. Each session’s range is drawn as a rectangle with a customizable midpoint line, ideal for spotting breakouts, retests, and liquidity sweeps.
Features
Session Open Ranges: Plots rectangles for the 15m open candles of Asia (03:00 EEST), London (10:00 EEST), and NY (15:00 EEST), corresponding to 01:00, 08:00, and 13:00 GMT+1.
Customizable Visualization:
Toggle each session (Asia, London, NY) on/off.
Independent high/low label toggles for each session.
Adjustable rectangle color, midpoint line color, style (solid/dashed/dotted), and width.
Customizable rectangle duration (default: 96 bars, ~24 hours on 15m).
Timezone Flexibility: Default times are set for EEST (UTC+3). Adjust session inputs for your chart’s timezone (e.g., GMT+1: Asia 01:00, London 08:00, NY 13:00; UTC: Asia 00:00, London 07:00, NY 12:00).
Clean Design: Rectangles and labels update dynamically, with proper cleanup to avoid clutter.
Usage:
Setup: Add to a 15m chart (e.g., EURUSD, ES1!). Check your chart’s timezone (Chart Settings > Symbol > Timezone) and adjust session times if needed.
Settings:
Toggle sessions and labels to focus on desired ranges (e.g., London and NY for high volatility).
Customize colors, midpoint line style/width, and rectangle duration.
Trading:
Breakouts/Retests: Trade breakouts above/below the rectangle high/low, with retests back to the range or midpoint (aligned with RP Profits scalping).
Liquidity Sweeps: Watch for price sweeping session highs/lows, reversing for entries (SMC concept).

[Top] Simple ATR TP/SLSimple TP/SL from ATR (Locked per Bar) - Advanced Position Management Tool
What This Indicator Does:
Automatically calculates and displays Take Profit (TP) and Stop Loss (SL) levels based on Average True Range (ATR)
Locks ATR values and direction signals at the start of each bar to prevent repainting and provide consistent levels
Offers multiple direction detection modes including real-time candle-based positioning for dynamic trading approaches
Displays entry, TP, and SL levels as clean horizontal lines that extend from the current bar
Original Features That Make This Script Unique:
Bar-Locked ATR System: ATR values are captured and frozen at bar open, ensuring levels remain stable throughout the bar's progression
Multi-Modal Direction Detection: Four distinct modes for determining TP/SL positioning - Trend Following (EMA-based), Bullish Only, Bearish Only, and real-time Candle Based
Real-Time Candle Flipping: In Candle Based mode, TP/SL levels flip immediately when the current candle changes from bullish to bearish or vice versa
Persistent Line Management: Uses efficient line object management to prevent ghost lines and maintain clean visual presentation
Flexible Base Price Selection: Choose between Open (static), Close (dynamic), or midpoint (H+L)/2 for entry level calculation
How The Algorithm Works:
ATR Calculation: Captures ATR value at each bar open using specified length parameter, maintaining consistency throughout the bar
Direction Determination: Uses different methods based on selected mode - EMA crossover for trend following, or real-time candle color for dynamic positioning
Level Calculation: TP level = Base Price + (Direction × TP Multiplier × ATR), SL level = Base Price - (Direction × SL Multiplier × ATR)
Visual Management: Creates persistent line objects once, then updates their positions every bar for optimal performance
Direction Modes Explained:
Trend Following: Uses 5-period and 12-period EMA relationship to determine trend direction (locked at bar open)
Bullish Only: Always places TP above and SL below entry (traditional long setup)
Bearish Only: Always places TP below and SL above entry (traditional short setup)
Candle Based: Dynamically adjusts based on current candle direction - flips in real-time as candle develops
Key Input Parameters:
ATR Length: Period for ATR calculation (default 14) - longer periods provide smoother volatility measurement
TP Multiplier: Take profit distance as multiple of ATR (default 1.0) - higher values target larger profits
SL Multiplier: Stop loss distance as multiple of ATR (default 1.0) - higher values allow more room for price movement
Base Price: Reference point for level calculations - Open for static entry, Close for dynamic tracking
Direction Mode: Method for determining whether TP goes above or below entry level
How To Use This Indicator:
For Position Sizing: Use the displayed SL distance to calculate appropriate position size based on your risk tolerance
For Entry Timing: Wait for price to approach the entry level before taking positions
For Risk Management: Set your actual stop loss orders at or near the displayed SL level
For Profit Taking: Use the TP level as initial profit target, consider scaling out at this level
Mode Selection: Choose Candle Based for scalping and quick reversals, Trend Following for swing trading
Visual Style Customization:
Line Colors: Customize TP line color (default teal) and SL line color (default orange) for easy identification
Line Widths: Adjust TP/SL line thickness (1-5) and entry line thickness (1-3) for visibility preferences
Clean Display: Lines extend 3 bars forward from current bar and update position dynamically
Best Practices:
Use on clean charts without multiple overlapping indicators for clearest visual interpretation
Combine with volume analysis and key support/resistance levels for enhanced decision making
Adjust ATR length based on your trading timeframe - shorter for scalping, longer for position trading
Test different TP/SL multipliers based on the volatility characteristics of your chosen instruments
Consider using Trend Following mode during strong trending periods and Candle Based during ranging markets

Apex Edge - London Open Session# Apex Edge - London Open Session Trading System
## Overview
The London Open Session indicator captures institutional price action during the first hour of the London forex session (8:00-9:00 AM GMT) and identifies high-probability breakout and retest opportunities. This system tracks the session's high/low range and generates precise entry signals when price breaks or retests these key institutional levels.
## Core Strategy
**Session Tracking**: Automatically identifies and marks the London Open session boundaries, creating a trading zone from the first hour's price range.
**Dual Entry Logic**:
- **Breakout Entries**: Triggers when price closes beyond the session high/low and continues in that direction
- **Retest Entries**: Activates when price returns to test the broken level as new support/resistance
**Performance Analytics**: Built-in win rate tracking displays real-time performance statistics over user-defined lookback periods, enabling data-driven optimization for each currency pair.
## Key Features
### Automated Zone Detection
- Precise London session timing with timezone offset controls
- Visual session boundaries with customizable colours
- Automatic high/low range calculation and display
### Smart Entry System
- Breakout confirmation requiring candle close beyond zone
- Retest detection with configurable pip distance tolerance
- Separate risk/reward ratios for breakout vs retest entries
- Visual entry arrows with clear trade direction labels
### Performance HUD
- Real-time win rate calculation over customizable periods (7-365 days)
- Total trades tracking with win/loss breakdown
- Average risk-reward ratio display
- Color-coded performance metrics (green >70%, yellow >50%, red <50%)
### PineConnector Integration
- Direct MT4/MT5 execution via PineConnector alerts
- Proper forex pip calculations for all currency pairs
- Customizable risk percentage per trade
- Symbol override capability for broker compatibility
- Automatic SL/TP level calculation in pips
## Critical Usage Requirements
### Pair-Specific Optimization
Each currency pair requires individual optimization due to varying volatility characteristics, institutional participation levels, and typical price ranges during London hours. The performance HUD is essential for identifying optimal settings before live trading.
**Recommended Testing Process**:
1. Apply indicator to desired currency pair and timeframe
2. Experiment with session timing - while 8:00-9:00 AM GMT is standard, some pairs may show improved performance with alternative hourly windows (e.g., 7:00-8:00 AM or 9:00-10:00 AM)
3. Adjust Stop Loss distances, Risk/Reward ratios, and Retest distances
4. Monitor win rate over 30+ day periods using the performance HUD
5. Only proceed with live alerts once consistent 60%+ win rates are achieved
6. Create separate optimized chart setups for each profitable pair/timeframe combination
### Timeframe Specifications
This indicator is specifically designed and tested for:
- **1-minute charts**: Optimal for capturing immediate institutional reactions
- **5-minute charts**: Balanced approach between noise reduction and opportunity frequency
Higher timeframes generally produce inferior results due to increased noise and reduced institutional edge during the London session window.
## Settings Configuration
### Session Timing
- **London Open/Close Hours**: Adjust for your chart's timezone
- **Rectangle End Time**: Set to 4:30 PM to stop signals before NY session close
- **Timezone Offset**: Ensure accurate London session capture
### Entry Parameters
- **Retest Distance**: 3-8 pips depending on pair volatility
- **Stop Loss Pips**: Separate settings for breakouts (10-15 pips) and retests (8-12 pips)
- **Risk/Reward Ratios**: Independent ratios for different entry types
### PineConnector Setup
- **License ID**: Your PineConnector license key
- **Symbol Override**: MT4/MT5 symbol names if different from TradingView
- **Risk Percentage**: Position size as percentage of account balance
- **Prefix/Comment**: Organize trades in terminal
## Manual Trading Limitations
Without PineConnector automation, traders face significant practical challenges:
**Settings Management**: Each currency pair requires different optimized parameters. Switching between charts means manually adjusting multiple settings each time, creating potential for errors and missed opportunities.
**Timing Sensitivity**: London Open signals can occur rapidly during high-volatility periods. Manual execution may result in slippage or missed entries.
**Multi-Pair Monitoring**: Tracking 4-11 currency pairs simultaneously while manually adjusting settings for each switch becomes impractical for most traders.
**Parameter Consistency**: Risk of using suboptimal settings when quickly switching between pairs, potentially compromising the careful optimization work.
## Recommended Workflow
1. **Historical Testing**: Use win rate HUD to identify profitable pairs and optimal parameters
2. **Demo Automation**: Test PineConnector alerts on demo accounts with optimized settings
3. **Live Implementation**: Deploy alerts only on proven profitable pair/timeframe combinations
4. **Ongoing Monitoring**: Regular review of performance metrics to maintain edge
## Risk Disclaimer
This indicator provides analysis tools and automation capabilities but does not guarantee profitable trading outcomes. Past performance does not predict future results. Users should thoroughly backtest and demo trade before risking live capital. The London session strategy works best during specific market conditions and may underperform during low volatility or unusual market environments.
## Support Requirements
Successful implementation requires:
- Basic understanding of London session market dynamics
- PineConnector subscription for automation features
- Patience for proper optimization process
- Realistic expectations about win rates and drawdown periods
This system is designed for serious traders willing to invest time in proper optimization and risk management rather than plug-and-play solutions.

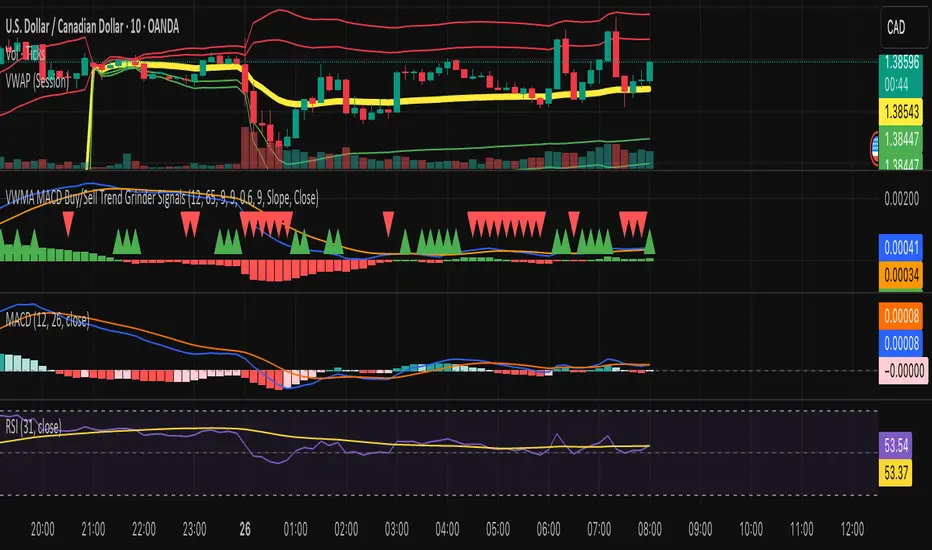
VWMA MACD Trend Grinder Buy/Sell SignalsDescription:
This indicator combines a VWMA-based MACD with volume and trend filters to reduce false buy and sell signals.
It is designed to give more reliable entry and exit points in trending markets while avoiding low-volume noise.
Features:
1. VWMA MACD:
- MACD is calculated using Volume-Weighted Moving Averages (VWMA) instead of standard EMAs.
- Histogram shows the difference between MACD and its signal line.
2. Volume Filter:
- Signals are only triggered when current volume exceeds a multiple of its moving average.
- Reduces false signals in low-volume periods.
3. Trend Filter:
- Only triggers buy signals when price is above a long-term VWMA (uptrend).
- Only triggers sell signals when price is below the long-term VWMA (downtrend).
- Helps avoid counter-trend trades.
4. Plots:
- MACD (blue), Signal (orange), Histogram (green/red)
- Trend VWMA (purple)
- Buy and Sell arrows in the indicator pane (green/red)
5. Alerts:
- Configurable alerts for buy and sell signals filtered by volume and trend.
Inputs:
- Fast Length: VWMA period for the fast MACD line (default 12)
- Slow Length: VWMA period for the slow MACD line (default 26)
- Signal Length: EMA period for the MACD signal line (default 9)
- Volume MA Length: Length for volume moving average filter (default 20)
- Volume Threshold Multiplier: Multiplier for volume filter (default 1.2)
- Trend VWMA Length: Period for long-term trend VWMA (default 50)
- Price Source: Close, HL2, HLC3, OHLC4
Usage:
- Use as a confirmation tool along with other analysis techniques.
- Buy when the green triangle appears (MACD crossover, above trend VWMA, sufficient volume).
- Sell when the red triangle appears (MACD crossunder, below trend VWMA, sufficient volume).
- Trend VWMA helps visually confirm the market trend.
JL - Market HeatmapThis indicator plots a static table on your chart that displays any tickers you want and their % change on the day so far.
It updates in real time, changes color as it updates, and has several custom functions available for you:
1. Plot up to 12 tickers of your choice
2. Choose a layout with 1-4 rows
3. Display % Change or Not
4. Choose your font size (Tiny, Small, Normal, Large)
5. Up/Down Cell Colors (% change dependent)
6. Up/Down Text Colors (high contrast to your color choices)
The purpose of the indicator is to quickly measure a broad basket of market instruments to paint a more context-rich perspective of the chart you are looking at.
I hope this indicator can help you (and me) accomplish this task in a simple, clean, and seamless manner.
Thanks and enjoy - Jack

VWMA MACD AmanitaVWMA MACD (Volume-Weighted MACD)
This indicator modifies the standard MACD by replacing EMAs with VWMAs
(Volume-Weighted Moving Averages).
- Fast VWMA (default 12 bars)
- Slow VWMA (default 26 bars)
- MACD Line = Fast VWMA - Slow VWMA
- Signal Line = EMA of MACD (default 9 bars)
- Histogram = MACD - Signal
Compared to the standard MACD, this version emphasizes price moves that
are backed by higher trading volume, helping to filter out weak signals.
The script also lets you choose the price source (Close, HL2, HLC3, OHLC4).

MACD StrategyOverview
The "MACD Strategy" is a straightforward trading strategy tested for BTCUSDT Futures on the 1-minute timeframe, leveraging the Moving Average Convergence Divergence (MACD) indicator to identify momentum-based buy and sell opportunities. Developed with input from expert trading analyst insights, this strategy combines technical precision with risk management, making it suitable for traders of all levels on platforms like TradingView. It focuses on capturing trend reversals and momentum shifts, with clear visual cues and automated alerts for seamless integration with trading bots (e.g., Bitget webhooks).
#### How It Works
This strategy uses the MACD indicator to generate trading signals based on momentum and trend direction:
- **Buy Signal**: Triggered when the MACD line crosses above the signal line, and the MACD histogram turns positive (above zero). This suggests increasing bullish momentum.
- **Sell Signal**: Triggered when the MACD line crosses below the signal line, and the MACD histogram turns negative (below zero), indicating growing bearish momentum.
Once a signal is detected, the strategy opens a position (long for buy, short for sell) with a position size calculated based on your risk tolerance. It includes a stop-loss to limit losses and a take-profit to lock in gains, both dynamically adjusted using the Average True Range (ATR) for adaptability to market volatility.
#### Key Features
- **MACD-Based Signals**: Relies solely on MACD for entry points, plotted in a separate pane for clear momentum analysis.
- **Risk Management**: Automatically calculates position size based on a percentage of your account balance and sets stop-loss and take-profit levels using ATR multipliers and a risk:reward ratio.
- **Visual Feedback**: Plots entry, stop-loss, and take-profit lines on the chart with labeled markers for easy tracking.
- **Alerts**: Includes Bitget webhook-compatible alerts for automated trading, notifying you of buy and sell signals in real-time.
#### Input Parameters
- **Account Balance**: Default 10000 – Set your initial trading capital to determine position sizing.
- **MACD Fast Length**: Default 12 – The short-term EMA period for MACD sensitivity.
- **MACD Slow Length**: Default 26 – The long-term EMA period for MACD calculation.
- **MACD Signal Length**: Default 9 – The smoothing period for the signal line.
- **Risk Per Trade (%)**: Default 3.0 – The percentage of your account balance risked per trade (e.g., 3% of 10000 = 300).
- **Risk:Reward Ratio**: Default 3.0 – The ratio of potential profit to risk (e.g., 3:1 means risking 1 to gain 3).
- **SL Multiplier**: Default 1.0 – Multiplies ATR to set the stop-loss distance (e.g., 1.0 x ATR).
- **TP Multiplier**: Default 3.0 – Multiplies ATR to set the take-profit distance, adjusted by the risk:reward ratio.
- **Line Length (bars)**: Default 25 – Duration in bars for displaying trade lines on the chart.
- **Label Position**: Default 'left' – Position of text labels (left or right) relative to trade lines.
- **ATR Period**: Default 14 – The number of periods for calculating ATR to measure volatility.
#### How to Use
1. **Add to Chart**: Load the "MACD Strategy" as a strategy and the "MACD Indicator" as a separate indicator on your TradingView chart (recommended for BTCUSDT Futures on the 1-minute timeframe).
2. **Customize Settings**: Adjust the input parameters based on your risk tolerance and market conditions. For BTCUSDT Futures, consider reducing `Risk Per Trade (%)` during high volatility (e.g., 1%) or increasing `SL Multiplier` for wider stops.
3. **Visual Analysis**: Watch the main chart for trade entry lines (green for buy, red for sell), stop-loss (red), and take-profit (green) lines with labels. Use the MACD pane below to confirm momentum shifts.
4. **Set Alerts**: Create alerts in TradingView for "Buy Signal" and "Sell Signal" to automate trades via Bitget webhooks.
5. **Backtest and Optimize**: Test the strategy on historical BTCUSDT Futures 1-minute data to fine-tune parameters. The short timeframe requires quick execution, so monitor closely for slippage or latency.
#### Tips for Success
- **Market Conditions**: This strategy performs best in trending markets on the 1-minute timeframe. Avoid choppy conditions where MACD crossovers may produce false signals.
- **Risk Management**: Start with the default 3% risk per trade and adjust downward (e.g., 1%) during volatile periods like BTCUSDT news events. The 3:1 risk:reward ratio targets consistent profitability.
- **Timeframe**: Optimized for 1-minute charts; switch to 5-minute or 15-minute for less noise if needed.
- **Confirmation**: Cross-check MACD signals with price action or support/resistance levels for higher accuracy on BTCUSDT Futures.
#### Limitations
- This strategy relies solely on MACD, so it may lag in fast-moving or sideways markets. Consider adding a secondary filter (e.g., RSI) if needed.
- Stop-loss and take-profit are ATR-based and may need adjustment for BTCUSDT Futures’ high volatility, especially during leverage trading.
#### Conclusion
The "MACD Strategy" offers a simple yet effective way to trade momentum shifts using the MACD indicator, tested for BTCUSDT Futures on the 1-minute timeframe, with robust risk management and visual tools. Whether you’re scalping crypto futures or exploring short-term trends, this strategy provides a solid foundation for automated or manual trading. Share your feedback or customizations in the comments, and happy trading!

Trend dealing rangeHi all!
This indicator will help you find the current dealing range according to the trend. If the trend is bullish the indicator will look for a range between the latest low pivot to the latest high pivot. Vice versa in a bearish trend. The code uses my new library 'FibonacciRetracement' () that has the same code as my other indicator 'Fibonacci retracement' ().
It plots 5 lines from the low to the high and labels them 0 %, 25 %, 50 %, 75 % and 100 %. A trendline can be drawn between the two pivots (dashed and gray by default). Firstly you can define the pivot lengths used, this setting is in the 'Market structure' section but it also applies to the dealing range (it defaults to 5 (left) and 2 (right)). You can show prices if you want to (shown in parantheses, off by default). You can change the default labels position (from left) and the font size (12 by default and higher up it's 7 for market structure text). Lastly you can change the alert frequency (defaults to once per bar close) and the price that has to enter a zone for alert to be sent. 'Close' means that the closing price (or current price if you change the alert frequency to all or once per bar) has to be inside the zone and 'Wick' means that the entire candle needs to be inside the zone.
It's very useful for traders to find the current dealing range and this indicator will help you to do so.
So, this indicator will give you the dealing range and basic market structure through break of structures and change of characters.
If you have any input or suggestions on future features or bugs, don't hesitate to let me know!
Best of trading luck!

Trend Continuation Filter - 🚀 Trend Continuation Filter — Multi-Factor Overlay
This overlay plots bullish / bearish continuation labels & arrows only when the market has enough confluence behind the move. Think of it as your “trend gatekeeper” — cutting out weak setups and highlighting only those with real momentum + structure.
🔍 Built-in Filters
✔ Ichimoku Cloud → trend bias + Tenkan/Kijun confirmation
✔ MACD (12/26/9) → acceleration via histogram slope
✔ RSI / MFI (14) → momentum quality (≥60 bullish / ≤40 bearish)
✔ ADX (14) → strength check (≥20 and rising)
➕ EMA Alignment (9/21/55/233) (optional)
➕ ATR Slope (14) (optional)
🎯 How it works
✅ Prints a Bull Continuation label/arrow when ≥4 filters align to the upside
✅ Prints a Bear Continuation label/arrow when ≥4 filters align to the downside
⚙️ minChecks input lets you adjust the strictness:
• Normal Days → set to 4 (more frequent, flexible)
• Trend Days → raise to 5–6 (fewer, high-conviction setups)
📈 Best Practices
⏰ Focus on London & New York sessions for clean expectancy
🧩 Pair with a HUD/Dashboard panel to see exactly which filters are active

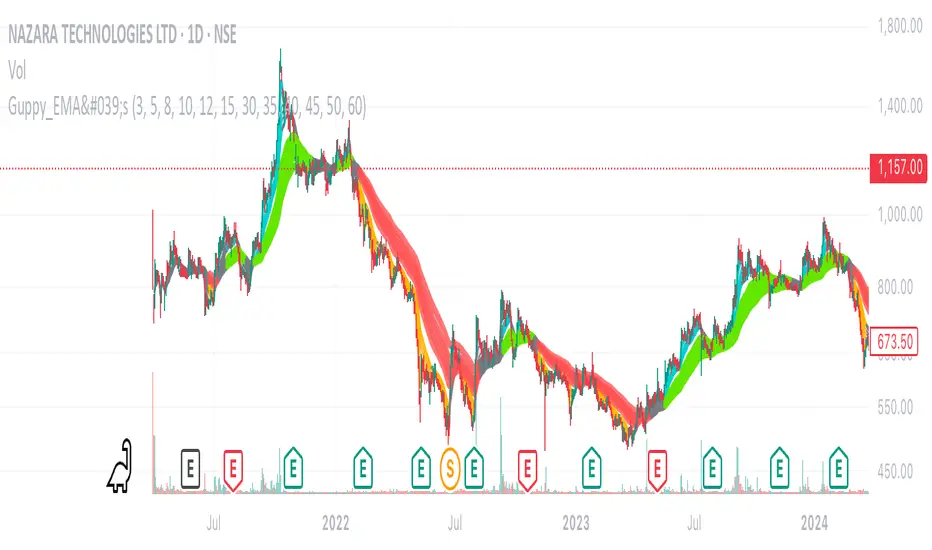
Daryl Guppy's Multiple Moving Averages - GMMAThe Guppy EMAs indicator (Daryl Guppy’s method) displays two groups of exponential moving averages (EMAs) on the chart:
Fast EMA group: 3, 5, 8, 10, 12, 15 periods (thinner, more responsive lines)
Slow EMA group: 30, 35, 40, 45, 50, 60 periods (thicker, smoother lines)
Color Logic:
Fast EMAs turn AQUA if all fast EMAs are in bullish alignment and slow EMAs are in bullish alignment.
Fast EMAs turn ORANGE if all fast EMAs are in bearish alignment and slow EMAs are in bearish alignment.
Otherwise, fast EMAs appear GRAY.
Slow EMAs turn LIME when in bullish order, RED when bearish, and remain GRAY otherwise.
The area between the outermost fast EMAs and slow EMAs is filled with a semi-transparent silver color for visual emphasis.
Volume % of Diluted Shares OutstandingIndicator does what it says - shows the volume traded per time frame as percentage of shares outstanding.
There are three scaling modes, see below.
Absolute (0–100%+) → The line values are the true % of diluted shares traded.
If the plot is at 12, that means 12% of all diluted shares traded that day.
Auto-range (absolute) → The line values are still the true % of shares traded (the y-axis is in real percentages).
But the reference lines (25/50/75/100) are not literal percentages anymore; they are markers at fractions of the local min-to-max range.
So your blue bars are real (e.g., 12% really is 12%), but the dotted lines are relative.
Normalize to 100 → The line values are not the true % anymore.
Everything is re-expressed as a fraction of the recent maximum, so 100 = “highest in the lookback window,” not “100% of shares.”
If the true max was 30% of shares traded, and today is 15%, then the plot will show 50 (because 15 is half of 30).

Advanced Trend Momentum [Alpha Extract]The Advanced Trend Momentum indicator provides traders with deep insights into market dynamics by combining exponential moving average analysis with RSI momentum assessment and dynamic support/resistance detection. This sophisticated multi-dimensional tool helps identify trend changes, momentum divergences, and key structural levels, offering actionable buy and sell signals based on trend strength and momentum convergence.
🔶 CALCULATION
The indicator processes market data through multiple analytical methods:
Dual EMA Analysis: Calculates fast and slow exponential moving averages with dynamic trend direction assessment and ATR-normalized strength measurement.
RSI Momentum Engine: Implements RSI-based momentum analysis with enhanced overbought/oversold detection and momentum velocity calculations.
Pivot-Based Structure: Identifies and tracks dynamic support and resistance levels using pivot point analysis with configurable level management.
Signal Integration: Combines trend direction, momentum characteristics, and structural proximity to generate high-probability trading signals.
Formula:
Fast EMA = EMA(Close, Fast Length)
Slow EMA = EMA(Close, Slow Length)
Trend Direction = Fast EMA > Slow EMA ? 1 : -1
Trend Strength = |Fast EMA - Slow EMA| / ATR(Period) × 100
RSI Momentum = RSI(Close, RSI Length)
Momentum Value = Change(Close, 5) / ATR(10) × 100
Pivot Support/Resistance = Dynamic pivot arrays with configurable lookback periods
Bullish Signal = Trend Change + Momentum Confirmation + Strength > 1%
Bearish Signal = Trend Change + Momentum Confirmation + Strength > 1%
🔶 DETAILS
Visual Features:
Trend EMAs: Fast and slow exponential moving averages with dynamic color coding (bullish/bearish)
Enhanced RSI: RSI oscillator with color-coded zones, gradient fills, and reference bands at overbought/oversold levels
Trend Fill: Dynamic gradient between EMAs indicating trend strength and direction
Support/Resistance Lines: Horizontal levels extending from pivot-based calculations with configurable maximum levels
Momentum Candles: Color-coded candlestick overlay reflecting combined trend and momentum conditions
Divergence Markers: Diamond-shaped signals highlighting bullish and bearish momentum divergences
Analysis Table: Real-time summary of trend direction, strength percentage, RSI value, and momentum reading
Interpretation:
Trend Direction: Bullish when Fast EMA crosses above Slow EMA with strength confirmation
Trend Strength > 1%: Strong trending conditions with institutional participation
RSI > 70: Overbought conditions, potential selling opportunity
RSI < 30: Oversold conditions, potential buying opportunity
Momentum Divergence: Price and momentum moving opposite directions signal potential reversals
Support/Resistance Proximity: Dynamic levels provide optimal entry/exit zones
Combined Signals: Trend changes with momentum confirmation generate high-probability opportunities
🔶 EXAMPLES
Trend Confirmation: Fast EMA crossing above Slow EMA with trend strength exceeding 1% and positive momentum confirms strong bullish conditions.
Example: During institutional accumulation phases, EMA crossovers with momentum confirmation have historically preceded significant upward moves, providing optimal long entry points.
15min
4H
Momentum Divergence Detection: RSI reaching overbought levels while momentum decreases despite rising prices signals potential trend exhaustion.
Example: Bearish divergence signals appearing at resistance levels have marked major market tops, allowing traders to secure profits before corrections.
Support/Resistance Integration: Dynamic pivot-based levels combined with trend and momentum signals create high-probability trading zones.
Example: Bullish trend changes occurring near established support levels offer optimal risk-reward entries with clearly defined stop-loss levels.
Multi-Dimensional Confirmation: The indicator's combination of trend, momentum, and structural analysis provides comprehensive market validation.
Example: When trend direction aligns with momentum characteristics near key structural levels, the confluence creates institutional-grade trading opportunities with enhanced probability of success.
🔶 SETTINGS
Customization Options:
Trend Analysis: Fast EMA Length (default: 12), Slow EMA Length (default: 26), Trend Strength Period (default: 14)
Support & Resistance: Pivot Length for level detection (default: 10), Maximum S/R Levels displayed (default: 3), Toggle S/R visibility
Momentum Settings: RSI Length (default: 14), Oversold Level (default: 30), Overbought Level (default: 70)
Visual Configuration: Color schemes for bullish/bearish/neutral conditions, transparency settings for fills, momentum candle overlay toggle
Display Options: Analysis table visibility, divergence marker size, alert system configuration
The Advanced Trend Momentum indicator provides traders with comprehensive insights into market dynamics through its sophisticated integration of trend analysis, momentum assessment, and structural level detection. By combining multiple analytical dimensions into a unified framework, this tool helps identify high-probability opportunities while filtering out market noise through its multi-confirmation approach, enabling traders to make informed decisions across various market cycles and timeframes.

SMA+MACD+RSI+Stoch Entry📌 Tools Used:
• SMA 21, SMA 50, SMA 200
• MACD (12, 26, 9)
• Pivot Point Standard
• RSI (length 75)
• Stochastic (14, 3, 3)
Trading Timeframe:
• Usable on all timeframes
Chart Preparation:
• Analyze the overall market trend and the instrument being traded
• Set an appropriate timeframe according to the market
• Apply SMA 21, SMA 50, SMA 200
• Apply MACD and Pivot Point Standard
• Ensure a proper market trend by checking the position of SMA 21, SMA 50, and SMA 200 relative to each other
If there are too many crossings between SMA 21, SMA 50, and SMA 200, do not enter any trades until the market trend stabilizes
Conditions for Entering a Long Trade (Bullish Trigger):
• Candle closes above the pivot line
• Confirm an uptrend by checking that SMA 21 is above SMA 50, and SMA 50 is above SMA 200
• RSI is above the midpoint
• Presence of a suitable corrective step with normal slope, considering the strength of the previous step
• MACD histogram indicates bullish momentum
• Stochastic shows a bullish crossover from below
Conditions for Entering a Short Trade (Bearish Trigger):
• Candle closes below the pivot line
• Confirm a downtrend by checking that SMA 21 is below SMA 50, and SMA 50 is below SMA 200
• RSI is below the midpoint
• Presence of a suitable corrective step with normal slope, considering the strength of the previous step
• MACD histogram indicates bearish momentum
• Stochastic shows a bearish crossover from above

RTH Levels: VWAP + PDH/PDL + ONH/ONL + IBAlgo Index — Levels Pro (ONH/ONL • PDH/PDL • VWAP±Bands • IB • Gaps)
Purpose. A session-aware, non-repainting levels tool for intraday decision-making. Designed for futures and indices, with clean visuals, alerts, and a one-click Minimal Mode for screenshot-ready charts.
What it plots
• PDH/PDL (RTH-only) – Prior Regular Trading Hours high/low, computed intraday and frozen at the RTH close (no 24h mix-ups, no repainting).
• ONH/ONL – Prior Overnight high/low, held throughout RTH.
• RTH VWAP with ±σ bands – Volume-weighted variance, reset each RTH.
• Initial Balance (IB) – First N minutes of RTH, plus 1.5× / 2.0× extensions after IB completes.
• Today’s RTH Open & Prior RTH Close – With gap detection and “gap filled” alert.
• Killzone shading – NY Open (09:30–10:30 ET) and Lunch (11:15–13:30 ET).
• Values panel (top-right) – Each level with live distance in points & ticks.
• Right-edge level tags – With anti-overlap (stagger + vertical jitter).
• Price-scale tags – Native trackprice markers that always “stick” to the axis.
⸻
New in v6.4
• Minimal Mode: one click for a clean look (thinner lines, VWAP bands/IB extensions hidden, on-chart right-edge labels off; price-scale tags remain).
• Theme presets: Dark Hi-Contrast / Light Minimal / Futures Classic / Muted Dark.
• Anti-overlap controls: horizontal staggering, vertical jitter, and baseline offset to keep tags readable even when levels cluster.
⸻
Quick start (2 minutes)
1. Add to chart → keep defaults.
2. Sessions (ET):
• RTH Session default: 09:30–16:00 (US equities cash hours).
• Overnight Session default: 18:00–09:29.
Adjust for your market if you use different “day” hours (e.g., many use 08:20–13:30 ET for COMEX Gold).
3. Theme & Minimal Mode: pick a Theme Preset; enable Minimal Mode for screenshots.
4. Visibility: toggle PD/ON/VWAP/IB/References/Panel to taste.
5. Right-edge labels: turn Show Right-Edge Labels on. If they crowd, tune:
• Anti-overlap: min separation (ticks)
• Horizontal offset per tag (bars)
• Vertical jitter per step (ticks)
• Right-edge baseline offset (bars)
6. Alerts: open Add alert → Condition: and pick the events you want.
⸻
How levels are computed (no repainting)
• PDH/PDL: Intraday H/L are accumulated only while in RTH and saved at RTH close for “yesterday’s” values.
• ONH/ONL: Accumulated across the defined Overnight window and then held during RTH.
• RTH VWAP & ±σ: Volume-weighted mean and standard deviation, reset at the RTH open.
• IB: First N minutes of RTH (default 60). Extensions (1.5×/2.0×) appear after IB completes.
• Gaps: Today’s RTH open vs prior RTH close; “Gap Filled” triggers when price trades back to prior close.
⸻
Practical playbooks (how to trade around the levels)
1) PDH/PDL interactions
• Rejection: Price taps PDH/PDL then closes back inside → mean-reversion toward VWAP/IB.
• Acceptance: Close/hold beyond PDH/PDL with momentum → continuation to next HTF/IB target.
• Alert: PD Touch/Break.
2) ONH/ONL “taken”
• Often one ON extreme is taken during RTH. ONH Taken / ONL Taken → check if it’s a clean break or sweep & reclaim.
• Sweep + reclaim near VWAP can fuel rotations through the ON range.
3) VWAP ±σ framework
• Balanced: First tag of ±1σ often reverts toward VWAP.
• Trend: Persistent trade beyond ±1σ + IB break → target ±2σ/±3σ.
• Alerts: VWAP Cross and VWAP Reject (cross then immediate fail back).
4) IB breaks
• After IB completes, a clean IB break commonly targets 1.5× and sometimes 2.0×.
• Quick return inside IB = possible fade back to the opposite IB edge/VWAP.
• Alerts: IB Break Up / Down.
5) Gaps
• Gap-and-go: Opening drive away from prior close + VWAP support → trend until IB completion.
• Gap-fill: Weak open and VWAP overhead/underfoot → trade toward prior close; manage on Gap Filled alert.
Pro tip: Stack confluences (e.g., ONL sweep + VWAP reclaim + IB hold) and respect your execution rules (e.g., require a 5-minute close in direction, or your order-flow confirmation).
⸻
Inputs you’ll actually touch
• Sessions (ET): Session Timezone, RTH Session, Overnight Session.
• Visibility: toggles for PD/ON/VWAP/IB/Ref/Panel.
• VWAP bands: set σ multipliers (±1/±2/±3).
• IB: duration (minutes) and extension multipliers (1.5× / 2.0×).
• Style & Theme: Theme Preset, Main Line Width, Trackprice, Minimal Mode, and anti-overlap controls.
⸻
Alerts included
• PD Touch/Break — High ≥ PDH or Low ≤ PDL
• ONH Taken / ONL Taken — First in-RTH take of ONH/ONL
• VWAP Cross — Close crosses VWAP
• VWAP Reject — Cross then immediate fail back
• IB Break Up / Down — Break of IB High/Low after IB completes
• Gap Filled — Price trades back to prior RTH close
Setup: Add alert → Condition: Algo Index — Levels Pro → choose event → message → Notify on app/email.
⸻
Panel guide
The top-right panel shows each level plus live distance from last price:
LevelValue (Δpoints | Δticks)
Coloring: green if level is below current price, red if above.
⸻
Styling & screenshot tips
• Use Theme Preset that matches your chart.
• For dark charts, “Dark Hi-Contrast” with Main Line Width = 3 works well.
• Enable Trackprice for crisp axis tags that always stick to the right edge.
• Turn on Minimal Mode for cleaner screenshots (no VWAP bands or IB extensions, on-chart tags off; price-scale tags remain).
• If tags crowd, increase min separation (ticks) to 30–60 and horizontal offset to 3–5; add vertical jitter (4–12 ticks) and/or push tags farther right with baseline offset (bars).
⸻
Behavior & limitations
• Levels are computed incrementally; tables refresh on the last bar for efficiency.
• Right-edge labels are placed at bar_index + offset and do not track extra right-margin scrolling (TradingView limitation). The price-scale tags (from trackprice) do track the axis.
• “RTH” is what you define in inputs. If your market uses different day hours, change the session strings so PDH/PDL reflect your definition of “yesterday’s session.”
⸻
FAQ
Q: My PDH/PDL don’t match the daily chart.
A: By design this uses RTH-only highs/lows, not 24h daily bars. Adjust sessions if you want a different definition.
Q: Right-edge tags overlap or don’t sit at the far right.
A: Increase min separation / horizontal offset / vertical jitter and/or push tags farther with baseline offset. If you want markers that always hug the axis, rely on Trackprice.
Q: Can I change killzones?
A: Yes—edit the session strings in settings or request a version with user inputs for custom windows.
⸻
Disclaimer
Educational use only. This is not financial advice. Always apply your own risk management and confirmation rules.
⸻
Enjoy it? Please ⭐ the script and share screenshots using Minimal Mode + a Theme Preset that fits your style.

Multi-TF Trend Table (Configurable)1) What this tool does (in one minute)
A compact, multi‑timeframe dashboard that stacks eight timeframes and tells you:
Trend (fast MA vs slow MA)
Where price sits relative to those MAs
How far price is from the fast MA in ATR terms
MA slope (rising, falling, flat)
Stochastic %K (with overbought/oversold heat)
MACD momentum (up or down)
A single score (0%–100%) per timeframe
Alignment tick when trend, structure, slope and momentum all agree
Use it to:
Frame bias top‑down (M→W→D→…→15m)
Time entries on your execution timeframe when the higher‑TF stack is aligned
Avoid counter‑trend traps when the table is mixed
2) Table anatomy (each column explained)
The table renders 9 columns × 8 rows (one row per timeframe label you define).
TF — The label you chose for that row (e.g., Month, Week, 4H). Cosmetic; helps you read the stack.
Trend — Arrow from fast MA vs slow MA: ↑ if fastMA > slowMA (up‑trend), ↓ otherwise (down‑trend). Cell is green for up, red for down.
Price Pos — One‑character structure cue:
🔼 if price is above both fast and slow MAs (bullish structure)
🔽 if price is below both (bearish structure)
– otherwise (between MAs / mixed)
MA Dist — Distance of price from the fast MA measured in ATR multiples:
XS < S < M < L < XL according to your thresholds (see §3.3). Useful for judging stretch/mean‑reversion risk and stop sizing.
MA Slope — The fast MA one‑bar slope:
↑ if fastMA - fastMA > 0
↓ if < 0
→ if = 0
Stoch %K — Rounded %K value (default 14‑1‑3). Background highlights when it aligns with the trend:
Green heat when trend up and %K ≤ oversold
Red heat when trend down and %K ≥ overbought Tooltip shows K and D values precisely.
Trend % — Composite score (0–100%), the dashboard’s confidence for that timeframe:
+20 if trendUp (fast>slow)
+20 if fast MA slope > 0
+20 if MACD up (signal definition in §2.8)
+20 if price above fast MA
+20 if price above slow MA
Background colours:
≥80 lime (strong alignment)
≥60 green (good)
≥40 orange (mixed)
<40 grey (weak/contrary)
MACD — 🟢 if EMA(12)−EMA(26) > its EMA(9), else 🔴. It’s a simple “momentum up/down” proxy.
Align — ✔ when everything is in gear for that trend direction:
For up: trendUp and price above both MAs and slope>0 and MACD up
For down: trendDown and price below both MAs and slope<0 and MACD down Tooltip spells this out.
3) Settings & how to tune them
3.1 Timeframes (TF1–TF8)
Inputs: TF1..TF8 hold the resolution strings used by request.security().
Defaults: M, W, D, 720, 480, 240, 60, 15 with display labels Month, Week, Day, 12H, 8H, 4H, 1H, 15m.
Tips
Keep a top‑down funnel (e.g., Month→Week→Day→H4→H1→M15) so you can cascade bias into entries.
If you scalp, consider D, 240, 120, 60, 30, 15, 5, 1.
Crypto weekends: consider 2D in place of W to reflect continuous trading.
3.2 Moving Average (MA) group
Type: EMA, SMA, WMA, RMA, HMA. Changes both fast & slow MA computations everywhere.
Fast Length: default 20. Shorten for snappier trend/slope & tighter “price above fast” signals.
Slow Length: default 200. Controls the structural trend and part of the score.
When to change
Swing FX/equities: EMA 20/200 is a solid baseline.
Mean‑reversion style: consider SMA 20/100 so trend flips slower.
Crypto/indices momentum: HMA 21 / EMA 200 will read slope more responsively.
3.3 ATR / Distance group
ATR Length: default 14; longer makes distance less jumpy.
XS/S/M/L thresholds: define the labels in column MA Dist. They are compared to |close − fastMA| / ATR.
Defaults: XS 0.25×, S 0.75×, M 1.5×, L 2.5×; anything ≥L is XL.
Usage
Entries late in a move often occur at L/XL; consider waiting for a pullback unless you are trading breakouts.
For stops, an initial SL around 0.75–1.5 ATR from fast MA often sits behind nearby noise; use your plan.
3.4 Stochastic group
%K Length / Smoothing / %D Smoothing: defaults 14 / 1 / 3.
Overbought / Oversold: defaults 70 / 30 (adjust to 80/20 for trendier assets).
Heat logic (column Stoch %K): highlights when a pullback aligns with the dominant trend (oversold in an uptrend, overbought in a downtrend).
3.5 View
Full Screen Table Mode: centers and enlarges the table (position.middle_center). Great for clean screenshots or multi‑monitor setups.
4) Signal logic (how each datapoint is computed)
Per‑TF data (via a single request.security()):
fastMA, slowMA → based on your MA Type and lengths
%K, %D → Stoch(High,Low,Close,kLen) smoothed by kSmooth, then %D smoothed by dSmooth
close, ATR(atrLen) → for structure and distance
MACD up → (EMA12−EMA26) > EMA9(EMA12−EMA26)
fastMA_prev → yesterday/previous‑bar fast MA for slope
TrendUp → fastMA > slowMA
Price Position → compares close to both MAs
MA Distance Label → thresholds on abs(close − fastMA)/ATR
Slope → fastMA − fastMA
Score (0–100) → sum of the five 20‑point checks listed in §2.7
Align tick → conjunction of trend, price vs both MAs, slope and MACD (see §2.9)
Important behaviour
HTF values are sampled at the execution chart’s bar close using Pine v6 defaults (no lookahead). So the daily row updates only when a daily bar actually closes.
5) How to trade with it (playbooks)
The table is a framework. Entries/exits still follow your plan (e.g., S/D zones, price action, risk rules). Use the table to know when to be aggressive vs patient.
Playbook A — Trend continuation (pullback entry)
Look for Align ✔ on your anchor TFs (e.g., Week+Day both ≥80 and green, Trend ↑, MACD 🟢).
On your execution TF (e.g., H1/H4), wait for Stoch heat with the trend (oversold in uptrend or overbought in downtrend), and MA Dist not at XL.
Enter on your trigger (break of pullback high/low, engulfing, retest of fast MA, or S/D first touch per your plan).
Risk: consider ATR‑based SL beyond structure; size so 0.25–0.5% account risk fits your rules.
Trail or scale at M/L distances or when score deteriorates (<60).
Playbook B — Breakout with confirmation
Mixed stack turns into broad green: Trend % jumps to ≥80 on Day and H4; MACD flips 🟢.
Price Pos shows 🔼 across H4/H1 (above both MAs). Slope arrows ↑.
Enter on the first clean base‑break with volume/impulse; avoid if MA Dist already XL.
Playbook C — Mean‑reversion fade (advanced)
Use only when higher TFs are not aligned and the row you trade shows XL distance against the higher‑TF context. Take quick targets back to fast MA. Lower win‑rate, faster management.
Playbook D — Top‑down filter for Supply/Demand strategy
Trade first retests only in the direction where anchor TFs (Week/Day) have Align ✔ and Trend % ≥60. Skip counter‑trend zones when the stack is red/green against you.
6) Reading examples
Strong bullish stack
Week: ↑, 🔼, S/M, slope ↑, %K=32 (green heat), Trend 100%, MACD 🟢, Align ✔
Day: ↑, 🔼, XS/S, slope ↑, %K=45, Trend 80%, MACD 🟢, Align ✔
Action: Look for H4/H1 pullback into demand or fast MA; buy continuation.
Late‑stage thrust
H1: ↑, 🔼, XL, slope ↑, %K=88
Day/H4: only 60–80%
Action: Likely overextended on H1; wait for mean reversion or multi‑TF alignment before chasing.
Bearish transition
Day flips from 60%→40%, Trend ↓, MACD turns 🔴, Price Pos “–” (between MAs)
Action: Stand aside for longs; watch for lower‑high + Align ✔ on H4/H1 to join shorts.
7) Practical tips & pitfalls
HTF closure: Don’t assume a daily row changed mid‑day; it won’t settle until the daily bar closes. For intraday anticipation, watch H4/H1 rows.
MA Type consistency: Changing MA Type changes slope/structure everywhere. If you compare screenshots, keep the same type.
ATR thresholds: Calibrate per asset class. FX may suit defaults; indices/crypto might need wider S/M/L.
Score ≠ signal: 100% does not mean “must buy now.” It means the environment is favourable. Still execute your trigger.
Mixed stacks: When rows disagree, reduce size or skip. The tool is telling you the market lacks consensus.
8) Customisation ideas
Timeframe presets: Save layouts (e.g., Swing, Intraday, Scalper) as indicator templates in TradingView.
Alternative momentum: Replace the MACD condition with RSI(>50/<50) if desired (would require code edit).
Alerts: You can add alert conditions for (a) Align ✔ changes, (b) Trend % crossing 60/80, (c) Stoch heat events. (Not shipped in this script, but easy to add.)
9) FAQ
Q: Why do I sometimes see a dash in Price Pos? A: Price is between fast and slow MAs. Structure is mixed; seek clarity before acting.
Q: Does it repaint? A: No, higher‑TF values update on the close of their own bars (standard request.security behaviour without lookahead). Intra‑bar they can fluctuate; decisions should be made at your bar close per your plan.
Q: Which columns matter most? A: For trend‑following: Trend, Price Pos, Slope, MACD, then Stoch heat for entries. The Score summarises, and Align enforces discipline.
Q: How do I integrate with ATR‑based risk? A: Use the MA Dist label to avoid chasing at extremes and to size stops in ATR terms (e.g., SL behind structure at ~1–1.5 ATR).

Live Trading Metrics DashboardReal-Time Trading Data Table for Chart Analysis
This clean and professional dashboard displays essential trading metrics directly on your chart in an easy-to-read table format. Perfect for traders who need quick access to key volatility and momentum data without cluttering their chart with multiple indicators.
Key Metrics Displayed:
IBD Relative Strength (RS):
Professional Formula: Uses Investor's Business Daily methodology
Multi-Timeframe Analysis: Weighted calculation across 3, 6, 9, and 12-month periods
Performance Indicator: Shows how the instrument performs relative to its historical price action
Real-Time Updates: Values update with each bar for current market conditions
1.5 ATR (Average True Range):
Volatility Measurement: 14-period ATR multiplied by 1.5 for extended range analysis
Stop-Loss Placement: Ideal for setting dynamic stop-loss levels
Risk Management: Helps determine appropriate position sizing based on volatility
Breakout Targets: Useful for setting profit targets on breakout trades
1.5 ATR Percentage:
Relative Volatility: Shows 1.5 ATR as a percentage of current price
Cross-Asset Comparison: Enables volatility comparison across different instruments
Position Sizing: Helps calculate risk per trade as percentage of price
Market Context: Understand volatility relative to instrument value
How to Interpret:
Positive IBD RS: Instrument showing strength relative to historical performance
Negative IBD RS: Instrument showing weakness relative to historical performance
Higher ATR Values: Increased volatility, wider stops needed
Higher ATR %: Greater relative volatility for the instrument's price level
Perfect For:
Day traders needing quick volatility reference
Swing traders using IBD methodology
Position traders managing risk with ATR-based stops
Any trader wanting clean, organized data display

Trading Macro Windows by BW v2
Trading Macros by BW: Integrating ICT Concepts for Session Analysis
This indicator combines two key Inner Circle Trader (ICT) concepts—Change in State of Delivery (CISD) or Inverted Fair Value Gap (IFVG) signals with Macro Time Windows—to provide a unified tool for analyzing intraday price action, particularly during Pacific Time (PT) sessions. Rather than simply merging existing scripts, this integration creates a cohesive visual framework that highlights how macro consolidation periods interact with potential reversal or continuation signals like CISD or IFVG. By overlaying macro candle styling and borders on the chart alongside selectable signal lines, traders can better contextualize setups within ICT's macro narrative, where price often manipulates liquidity during these windows before displacing toward higher-timeframe objectives.
Core Components and How They Work Together:
Macro Time Windows (Inspired by ICT's Macro Periods):
ICT emphasizes "macro" as 30-minute windows (e.g., 06:45–07:15 PT, 07:45–08:15 PT, up to 11:45–12:15 PT) where price tends to consolidate, sweep liquidity, or form key structures like Fair Value Gaps (FVGs). These periods set the stage for the session's directional bias.
The indicator styles candles within these windows using a user-defined color for wicks, borders, and bodies (translucent for visibility). This visual emphasis helps traders focus on activity inside macros, where reversals or continuations often originate.
Borders are drawn as vertical lines at the start and end of each window (with a +5 minute buffer to capture related activity), using a dotted style by default. This creates a "study zone" that encapsulates macro events, allowing traders to assess if price is respecting or violating these zones in alignment with broader ICT models like the Power of 3 (AMD cycle).
Toggle: "Macro Candles Enabled" (default: true) – Turn off to disable styling and borders if focusing solely on signals.
CISD or IFVG Signals (Selectable Mode):
Mode Selection: Choose between "Change in the State of Delivery" (CISD) or "IFVG" (default: IFVG). Both detect shifts in market delivery during specific 30-minute slices (15–45 or 17–45 minutes past the hour in PT sessions).
CISD Mode: Based on ICT's definition of a sudden directional shift, this identifies aggressive displacements after sweeping recent highs/lows. It uses a rolling reference high/low over 6 bars, checks for sweeps (penetrating by at least 2 ticks in the last 2-3 bars), reclamation (closing beyond the reference with at least 50% body), and displacement (50% of prior range or an immediate FVG of 6+ ticks). Signals plot a horizontal line from the close, extending 24 bars right, labeled "CISD."
IFVG Mode: Focuses on Inverted Fair Value Gaps, where a bullish FVG (low > high by 13+ ticks) forms but is inverted (closed below) in the same slice, signaling bearish intent (or vice versa). This targets violations against opposing liquidity, often leading to raids on external ranges. Signals plot similarly, labeled "IFVG."
Shared Logic: Both modes enforce a 55-bar cooldown to prevent clustering, operate only during PT sessions (06:30–13:00), and use tick-based thresholds for precision across instruments. The integration with macros allows traders to see if signals occur within or at the edges of macro windows, enhancing confirmation—for example, a CISD inside a macro might indicate a manipulated reversal toward the session's true objective.
Toggle: "Signals Enabled" (default: true) – Turn off to hide all signal lines and labels, isolating the macro visualization.
How Components Interact:
Macro windows provide the "narrative context" (consolidation/manipulation), while CISD/IFVG signals detect the "delivery shift" (displacement). Together, they form a mashup that justifies publication: isolated signals can be noisy, but when filtered by macro periods, they align with ICT's session model. For instance, an IFVG inversion during a macro might confirm a liquidity sweep before targeting PD arrays or order blocks.
No external dependencies; all calculations are self-contained using Pine's built-in functions like ta.highest/lowest for references and time-based sessions for windows.
Usage Guidelines:
Apply to intraday charts (e.g., 1-5 min) or stocks during PT hours.
Look for confluence: A bull IFVG signal post-macro low sweep might target the next macro high or daily bias.
Customize colors/styles for signals (solid/dashed/dotted lines) and macros to suit your chart.
Backtest in replay mode to observe how macros frame signals—e.g., price often respects macro borders as S/R.
Limitations: Timezone-fixed to PT (America/Los_Angeles); signals are directional hints, not trade entries. Combine with ICT tools like order blocks or liquidity pools for full setups.
This script draws from community ICT implementations but refines them into a single, purpose-built tool for macro-driven trading, reducing chart clutter while emphasizing interconnected concepts. Feedback welcome!
