Multi SMA EMA WMA HMA BB (4x5 MAs Bollinger Bands) Adv MTF - RRBMulti SMA EMA WMA HMA 4x5 Moving Averages with Bollinger Bands Advanced MTF by RagingRocketBull 2019
Version 1.0
This indicator shows multiple MAs of any type SMA EMA WMA HMA etc with BB and MTF support, can show MAs as dynamically moving levels.
There are 4 MA groups + 1 BB group, a total of 4 TFs * 5 MAs = 20 MAs. You can assign any type/timeframe combo to a group, for example:
- EMAs 12,26,50,100,200 x H1, H4, D1, W1 (4 TFs x 5 MAs x 1 type)
- EMAs 8,10,13,21,30,50,55,100,200,400 x M15, H1 (2 TFs x 10 MAs x 1 type)
- D1 EMAs and SMAs 8,10,12,26,30,50,55,100,200,400 (1 TF x 10 MAs x 2 types)
- H1 WMAs 7,77,89,167,231; H4 HMAs 12,26,50,100,200; D1 EMAs 89,144,169,233,377; W1 SMAs 12,26,50,100,200 (4 TFs x 5 MAs x 4 types)
- +1 extra MA type/timeframe for BB
There are several versions: Simple, MTF, Pro MTF, Advanced MTF and Ultimate MTF. This is the Advanced MTF version. The Differences are listed below. All versions have BB
- Simple: you have 2 groups of MAs that can be assigned any type (5+5)
- MTF: +2 custom Timeframes for each group (2x5 MTF) +1 TF for BB, TF XY smoothing
- Pro MTF: 4 custom Timeframes for each group (4x3 MTF), 1 TF for BB, MA levels and show max bars back options
- Advanced MTF: +2 extra MAs/group (4x5 MTF), custom Ticker/Symbols, Timeframe <>= filter, Remove Duplicates Option
- Ultimate MTF: +individual settings for each MA, custom Ticker/Symbols
Features:
- 4x5 = 20 MAs of any type
- 4x MTF groups with XY step line smoothing
- +1 extra TF/type for BB MAs
- 4x5 = 20 MA levels with adjustable group offsets, indents and shift
- supports any existing type of MA: SMA, EMA, WMA, Hull Moving Average (HMA)
- custom tickers/symbols for each group - you can compare MAs of the same symbol across exchanges
- show max bars back option
- show/hide both groups of MAs/levels/BB and individual MAs
- timeframe filter: show only MAs/Levels with TFs <>= Current TF
- hide MAs/Levels with duplicate TFs
- support for custom TFs that are not available in free accounts: 2D, 3D etc
- support for timeframes in H: H, 2H, 4H etc
Notes:
- Uses timeframe textbox instead of input resolution dropdown to allow for 240 120 and other custom TFs
- Uses symbol textbox instead of input symbol to avoid establishing multiple dummy security connections to the current ticker - otherwise empty symbols will prevent script from running
- Possible reasons for missing MAs on a chart:
- there may not be enough bars in history to start plotting it. For example, W1 EMA200 needs at least 200 bars on a weekly chart.
- price << default Y smoothing step 5. For charts with low/fractional prices (i.e. 0.00002 << 5) adjust X Y smoothing as needed (set Y = 0.0000001) or disable it completely (set X,Y to 0,0)
- TradingView Replay Mode UI and Pinescript security calls are limited to TFs >= D (D,2D,W,MN...) for free accounts
- attempting to plot any TF < D1 in Replay Mode will only result in straight lines, but all TFs will work properly in history and real-time modes. This is not a bug.
- Max Bars Back (num_bars) is limited to 5000 for free accounts (10000 for paid), will show error when exceeded. To plot on all available history set to 0 (default)
- Slow load/redraw times. This indicator becomes slower, its UI less responsive when:
- Pinescript Node.js graphics library is too slow and inefficient at plotting bars/objects in a browser window. Code optimization doesn't help much - the graphics engine is the main reason for general slowness.
- the chart has a long history (10000+ bars) in a browser's cache (you have scrolled back a couple of screens in a max zoom mode).
- Reload the page/Load a fresh chart and then apply the indicator or
- Switch to another Timeframe (old TF history will still remain in cache and that TF will be slow)
- in max possible zoom mode around 4500 bars can fit on 1 screen - this also slows down responsiveness. Reset Zoom level
- initial load and redraw times after a param change in UI also depend on TF. For example:
D1/W1 - 2 sec, H1/H4 - 5-6 sec, M30 - 10 sec, M15/M5 - 4 sec, M1 - 5 sec.
M30 usually has the longest history (up to 16000 bars) and W1 - the shortest (1000 bars).
- when indicator uses more MAs (plots) and timeframes it will redraw slower. Seems that up to 5 Timeframes is acceptable, but 6+ Timeframes can become very slow.
- show_last=last_bars plot limit doesn't affect load/redraw times, so it was removed from MA plot
- Max Bars Back (num_bars) default/custom set UI value doesn't seem to affect load/redraw times
- In max zoom mode all dynamic levels disappear (they behave like text)
1. based on 3EmaBB, uses plot*, barssince and security functions
2. you can't set certain constants from input due to Pinescript limitations - change the code as needed, recompile and use as a private version
3. Levels = trackprice implementation
4. Show Max Bars Back = show_last implementation
5. swma has a fixed length = 4, alma and linreg have additional offset and smoothing params
6. Smoothing is applied by default for visual aesthetics on MTF. To use exact ma mtf values (lines with stair stepping) - disable it
Good Luck! You can explore, modify/reuse the code to build your own indicators.
"细算江西救护车家长倒赚了四万三+-医疗花费13万(家长视频)++医保报" için komut dosyalarını ara

Moving Averages & Bollinger Bands with ForecastsMoving Averages & Bollinger Bands with Forecasts
11 Moving Averages
SMA, EMA, WMA
Highly Customizable
Linear Regression Forecast
Bollonger Bands
Personal Setup: Add indicator twice
1st indicator = SMA using #4, 7, 10, 11 (20, 50, 100, 200 SMAs) with bollonger bands on 20.
2nd indicator = EMA using #1, 2, 3, 5, 6, 8, 9 (5, 8, 13, 21 ,34, 55, 89 EMAs).
This allows easy toggling between SMAs/Bolls and Fib EMAs
Thank you to yatrader2 for the forecast code

Reversal off EMASimple script find when a probable reversal will start. When price moves sharply away from the 13 EMA a BUY/SELL signal will pop up. Scripted to work on 5m 1h, 4h, and daily chart. But it doesn't work on all charts. Not sure why. I'm a forex trader and use this on NZDUSD. It doesn't give too good results on the JPY charts. I think its a fairly good reversal indicator. It definitely doesn't catch them all, and if there is a strong bearish or bullish impulse it doesn't work too well. But with all indicators, you need other conformations when to get in and when to get out. Hope it helps someone.
EMA DivergenceThis script automatically calculates the divergence between your favorite exponential moving average and the current price (13 ema default).
Additionally, it displays the area in yellow once the first threshold gets reached (1.5% divergence default) and in red once the second threshold gets reached (1.5% divergence default).
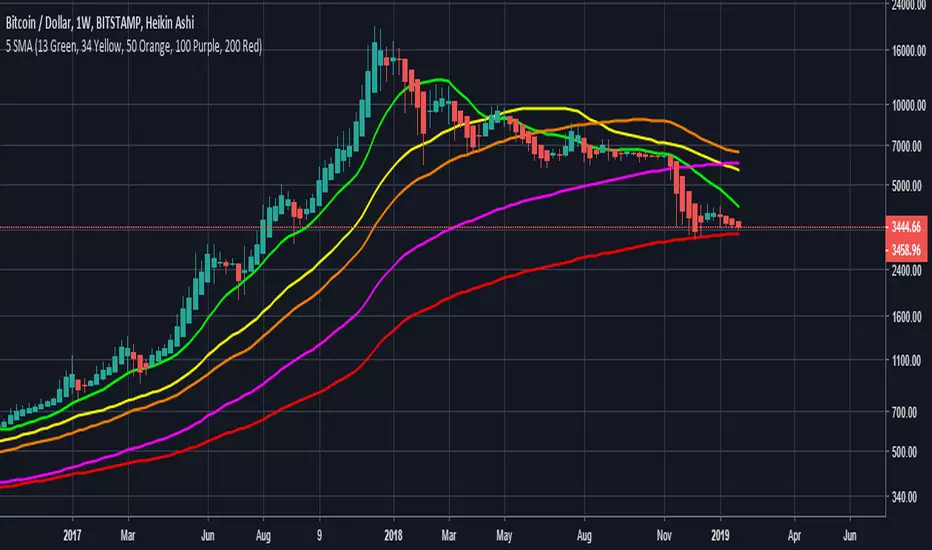
Multi SMAPlot all of the most important SMA values.
SMA 5, 8, 13 are based on Fibonaci values and frequently used in day trading frequently.
SMA 50, 100, 200 are important support/resistance lines.
Especially, SMA 50, 100, 200 are the most important support/resistance on BTC 1W. Dont forget to look at the weekly prices when trading :)

ATR+VWAP Alert//These signals mostly consist of crossovers between a 13 VWMA and a 62 VWMA. I've found these two moving averages to be quite special in their ability to
//recognize a quick trend using volume data. The VWAP is used in the alert system as well, to give some perspective on which direction we are looking to take. We
//are also using ATR. We only take trades when the ATR is on the move, meaning we have a chance to catch a volatile move! Finally, we use RSI to help weed out bad
//trades. We only take 'longs' with bullish readings from RSI, and we only take 'shorts' with bearish readings from RSI. These alerts are fantastic for catching quick intraday
//trades in either direction. I recommend using a small 'take profit' target rather than using an exit indicator. These trades can move 20-30 pips and reverse just as quickly. Good luck!
//How To Use:
//When the alert system is added to the chart, you will notice up/down symbols appear at various locations. For bullish alerts, right click an 'Up' symbol and choose 'Add Alert on VWap & ATR..'
//There are two condition options. 'Long/short', and right below that 'Buy-Signal/Sell-Signal'. Choose 'long' and 'Buy-Signal'. At options, choose 'Once Per Bar Close'. Design your alert, and you're good to go.
//For bearish signals, find a 'down' signal on the chart. Right click and follow the same process, except choosing 'short/Sell-Signal' conditions.
Tips:
Use VWAP as a stop-loss. If a candle closes below/above the VWAP in the direction against you.. get out of the trade. The losses will be minimal and few compared to the wins. Use discretion and trade carefully. This works great with crypto. Invent your own exit. If you come up with a clever exit, please share!
You can contact me at my Discord!
discord.gg


5 Simple Moving Averages5 Simple Moving Averages (13 Green, 34 Yellow, 50 Orange, 100 Purple, 200 Red)

[astropark] MACD, RSI+, AO, DMI, ADX, OBV, ADI//******************************************************************************
// Copyright by astropark v4.1.0
// MACD, RSI+, Awesome Oscillator, DMI, ADX, OBV, ADI
// 24/10/2018 Added RSI with Center line to have clear glue of current trend
// 10/12/2018 Added MACD
// 13/12/2018 Added multiplier for MACD in order to make it clearly visible over RSI graph
// 11/01/2019 Added Awesome Ascillator (AO)
// 11/01/2019 Added Directional Movement Index (DMI) with ADX
// 14/01/2019 Added On Balance Volume (OBV)
// 14/01/2019 Added Accelerator Decelerator Indicator (ADI)
//******************************************************************************

[astropark] MACD, RSI+, Awesome Oscillator, DMI, ADX, OBV//******************************************************************************
// Copyright by astropark v4.0.0
// MACD, RSI+, Awesome Oscillator, DMI, ADX, OBV
// 24/10/2018 Added RSI with Center line to have clear glue of current trend
// 10/12/2018 Added MACD
// 13/12/2018 Added multiplier for MACD in order to make it clearly visible over RSI graph
// 11/01/2019 Added Awesome Oscillator (AO)
// 11/01/2019 Added Directional Movement Index (DMI) with ADX
// 14/01/2019 Added On Balance Volume (OBV)
//******************************************************************************

[astropark] MACD, RSI+, Awesome Oscillator, DMI with ADX//******************************************************************************
// Copyright by astropark v3.1.0
// MACD, RSI+, Awesome Oscillator, DMI, ADX
// 24/10/2018 Added RSI with Center line to have clear glue of current trend
// 10/12/2018 Added MACD
// 13/12/2018 Added multiplier for MACD in order to make it clearly visible over RSI graph
// 11/01/2019 Added Awesome Ascillator (AO)
// 11/01/2019 Added Directional Movement Index (DMI) with ADX
//******************************************************************************

[astropark] MACD, RSI+, Awesome Oscillator//******************************************************************************
// Copyright by astropark v3.0.0
// MACD, RSI+, Awesome Oscillator
// 24/10/2018 Added RSI with Center line to have clear glue of current trend
// 10/12/2018 Added MACD
// 13/12/2018 Added multiplier for MACD in order to make it clearly visible over RSI graph
// 11/01/2019 Added Awesome Ascillator (AO)
//******************************************************************************

Fibonacci Moving Average (EMA/SMA) Bundle //@v1.2 Fibonacci Moving Average (EMA/SMA) Bundle
//By Tantamount
//Save your TV indicator use counts by using the Fibonacci SMA/EMA all in one indicator! Toggle between Exponetial or Simple moving averages functionality, using Fibonacci the sequence.
//Fib moving averages are very good at locating support and resistance zones on multiple time frames.
//Customize and or input your very own moving average nomenclature by simply changing the input options from default: SMA (21, 55, 89, 144, 233) or EMA (21, 55, 89, 144, 233) Example: (8,13,21,55,89)
Support and Resistance Lines

Fibonacci Trendlines 8-200In my opinion best EMA Trendlines there is, simple yet very reliable on any time frame, i found the version that had 8-13-21-55, so i decided to add 100 and 200 for higher time frames enjoy please share and like

SG-2-13-34-100 EMA's with AlertsSeveral different uses, but great for scalping when watching EMA2 open crosses with EMA13 close on 1M time frames. It can give early warning before pump and dumps.
BO Willians EMA'sBo Williams is a North America/Brazilian trader. He created a trading software called PHI CUBE.
This ema ratios are very used in Brazil. They a based in the Golden Number PHI.
"There is a special ratio that can be used to describe the proportions of everything from nature's smallest building blocks, such as atoms, to the most advanced patterns in the universe, such as unimaginably large celestial bodies. Nature relies on this innate proportion to maintain balance, but the financial markets also seem to conform to this "golden ratio." Here, we take a look at some technical analysis tools that have been developed to take advantage of it.
The Mathematics
Mathematicians, scientists and naturalists have known this ratio for centuries. It's derived from something known as the Fibonacci sequence, named after its Italian founder, Leonardo Fibonacci (whose birth is assumed to be around 1175 A.D. and death around 1250 A.D.). Each term in this sequence is simply the sum of the two preceding terms (1, 1, 2, 3, 5, 8, 13, etc.).
But this sequence is not all that important; rather, it is the quotient of the adjacent terms that possesses an amazing proportion, roughly 1.618, or its inverse 0.618. This proportion is known by many names: the golden ratio, the golden mean, PHI and the divine proportion, among others. So, why is this number so important? Well, almost everything has dimensional properties that adhere to the ratio of 1.618, so it seems to have a fundamental function for the building blocks of nature. "
More here www.goldennumber.net

[astropark] MACD & RSI+//******************************************************************************
// Copyright by astropark v2.0
// MACD RSI+
// 24/10/2018 Added RSI with Center line to have clear glue of current trend
// 10/12/2018 Added MACD
// 13/12/2018 Added multiplier for MACD in order to make it clearly visible over RSI graph
//******************************************************************************

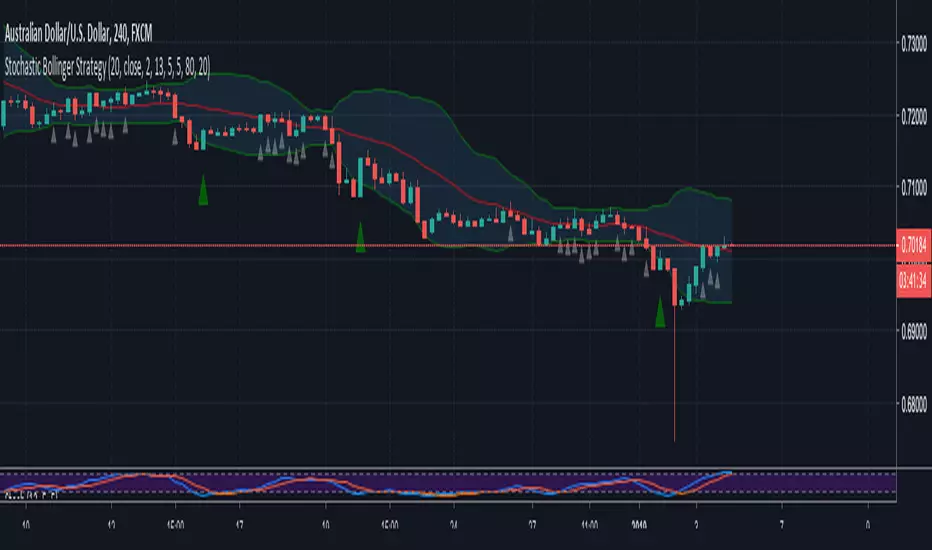
Stochastic Bollinger StrategyBollinger defaults = 20, close, 2
Stochastic defaults = 13, 5, 5
Buy Signal (GREEN triangle):
BULLISH candle formed
Candle OPEN is LESS than LOWER Bollinger Band
Stochastic (K) is LESS than 20
Sell Signal (RED triangle):
BEARISH candle formed
Candle OPEN is GREATER than UPPER Bollinger Band
Stochastic (K) is GREATER than 80
Read more about the strategy and where to set buy stops and sell stops here: swing-trading-strategies.com