"细算江西救护车家长倒赚了四万三+-医疗花费13万(家长视频)++医保报" için komut dosyalarını ara

Weiss Wave Open Interest BarsFirstly :
LazyBear ' s "Weiss Wave " codes are used for open interests.
Original Weiss Wave Volume :
Let's start :
Open Interest vs. Volume: An Overview
Volume and open interest are two key measurements that describe the liquidity and activity of contracts In the options and futures markets. However, their meanings and applications are different. Volume refers to the number of contracts traded in a given period, while open interest denotes the number of active contracts.
Volume
Trading volume measures the number of options or futures contracts being exchanged between buyers and sellers, identifying the level of activity for that particular contract. For every buyer, there is a seller, and the transaction itself counts toward the daily volume.
Open Interest
Open interest indicates the number of options or futures contracts that are held by traders and investors in active positions. These positions have not been closed out, expired, or exercised. Open interest decreases when holders and writers of options (or buyers and sellers of futures) close out their positions. To close out positions, they must take offsetting positions or exercise their options. Open interest increases once again when investors and traders open new long positions or writers/sellers take on new short positions. Open interest also increases when new options or futures contracts are created.
Options or futures contract trading volume can only increase while open interest can either increase or decrease. While trading volume indicates the number of contracts that have been bought or sold, open interest identifies the number of contracts that are currently held.
Reference : www.investopedia.com
*** Worked to define all futures . You can look them in codes (between line : 13 to line 94 )
** CAUTION 1 : Since each instrument in the list has its own unique contract data, you must first enter its name to display it. I recommend you to select OANDA from the markets. Finally, when the COT reports are issued, it may repaints. However, this repaint is usually close to closing or after close .(When COT reports are so sharp ) So use this script only 1W ( 1 week ) or 1 M ( 1 month ) timeframe.
** CAUTION 2 : This data is taken to Tradingview with the help of Quandl. This is a tremendous possibility, but the system will not work if there is a malfunction.
Best regards.

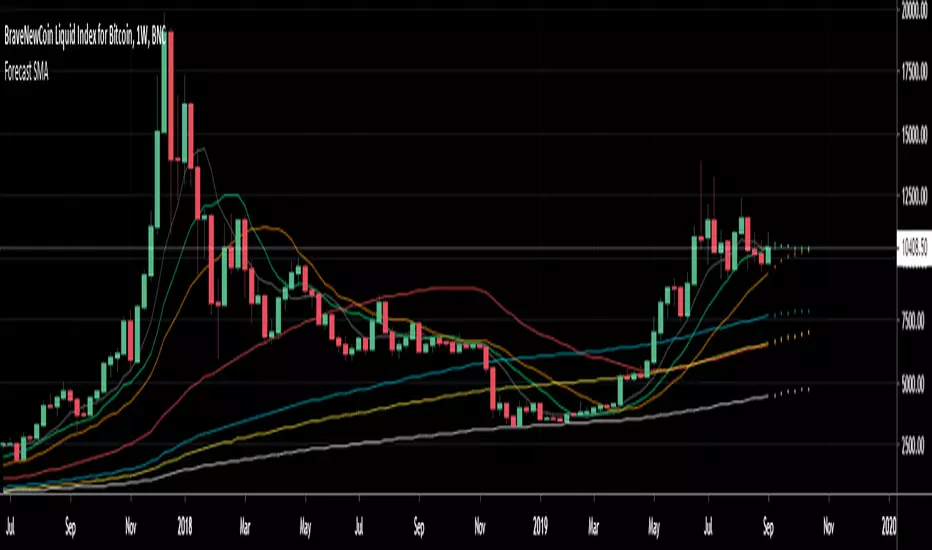
Forecast 7 SMA's 6 periodsForecast 7 SMA's 6 periods
This script is an upgrade of the existing Triple MA Forecast from Yatrader2
To allow the user to display 7 different SMAs and look 6 candles ahead
Default Value
8 SMA
13 SMA
20 SMA
50 SMA
100 SMA
128 SMA
200 SMA
Note:
Best to use on high timeframe, if on low timeframe change the forecast maximum to lower
This was made to forecast the 20 SMA on weekly timeframe on the upcomming Bitcoin price
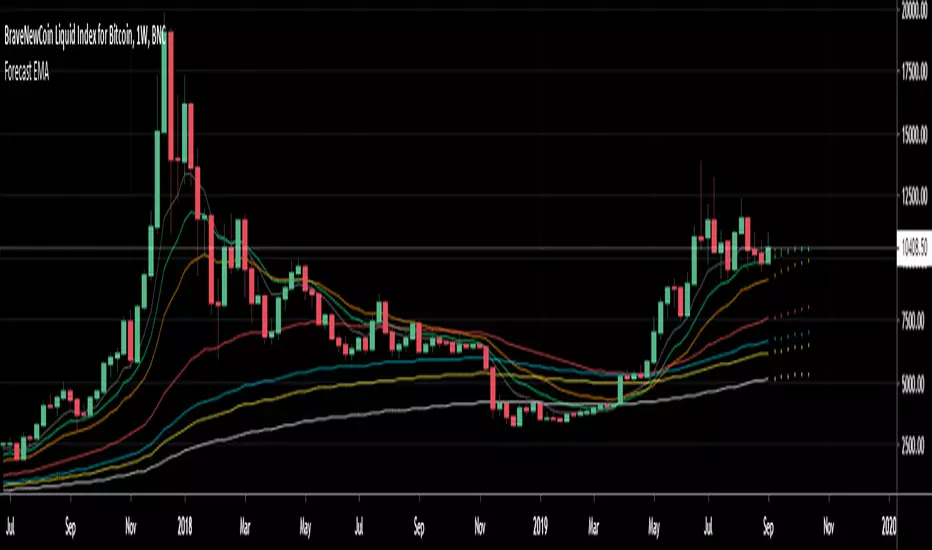
Forecast 7 EMA's 6 periodsForecast 7 EMA's 6 periods
This script is an upgrade of the existing Triple MA Forecast from Yatrader2
To allow the user to display 7 different EMAs and look 6 candles ahead
Default Value
8 ema
13 ema
21 ema
55 ema
100 ema
128 ema
200 ema
Note:
Best to use on high timeframe, if on low timeframe change the forecast maximum to lower
This was made to forecast the 21 ema on weekly timeframe on the upcomming Bitcoin price
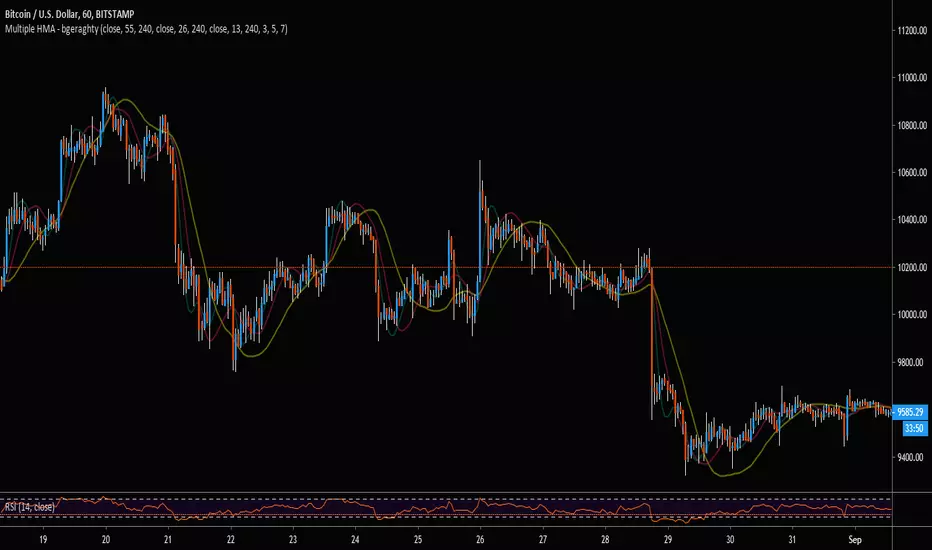
Multiple HMA - bgeraghtyTo save space on a chart's maximum indicator count, this single indicator includes:
- Three Hull Moving Averages, Defaulted to 13, 26, and 55 Periods.
- Customizable Time-Frame for Each HMA.
- Customizable Triple Weighted MA Smoothing for Jagged Lines from Higher Time-Frame
- Alert Conditions for Price Cross Over/Under the HMAs.

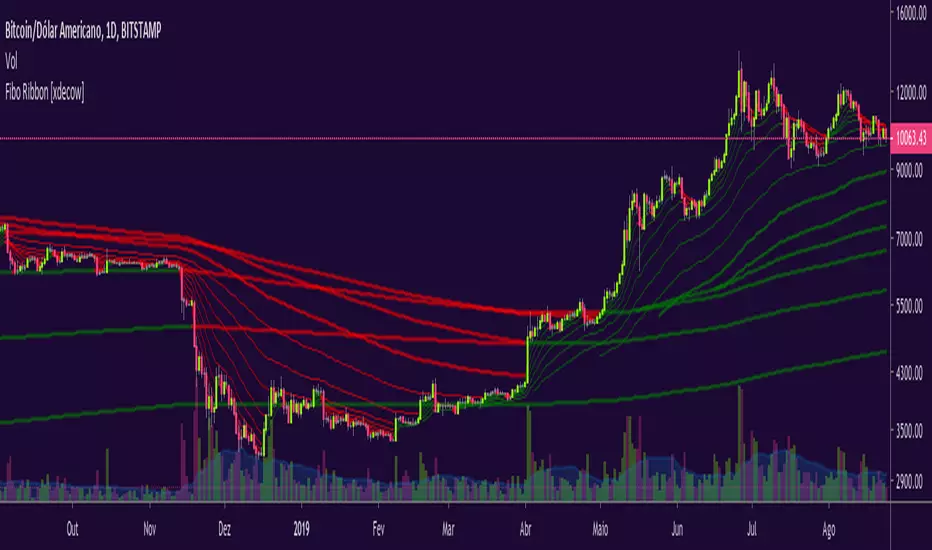
Fibo Ribbon [xdecow]Fibonacci emas sequence:
2, 3, 5, 8, 13, 21, 34, 55, 89, 144, 233, 377, 610, 987, 1597
EMA 21,13,8 - scalping3 EMAs will help identify and predict uptrends and downtrends
-If EMAs are all above the candles it a sign to sell & if the EMAs are below its a sign to buy
- If the Green-8 EMA crosses or touches red candle then flips under the other EMAs & candles then it's time to sell
-If the Green-8 EMA crosses or touches green candle then flips above the other EMAs & candles then it's time to buy
- how far is the EMAs from the candle it'll show how strong the trend. combine this strategy with the stochastic oscillator & RSI to get the maximum benefit


Scaled Normalized Vector StrategyThis is a scaled Normalized Vector Strategy with a Karobein Oscillator
Original: Drkhodakarami (www.tradingview.com)
Repainting: in general there two types of repainting:
* when the last candle is constantly being redrawn
* when the indicator draws a different configuration after it has been deactivated/reactivated, i.e. refreshed.
The former is a natural behaviour, which presents a constant source of frustration, when a signal directly depends on the current market situation and can be overcome with various indirect techniques like divergence.
The latter suggests a flaw in the indicator design.
Unfortunately, the Normalized Vector Strategy is repainting in the latter sense, although being really promising. Would be nice if our community suggests a solution to this problem ))
As it is this strat should be refreshed each time a decision is being taken.
This strat consistently performs with high accuracy, showing up to 96% scores. Here are some of the best parameters:
TF Lookback Performance (ca.)
1m 13 92%
3m 34 92%
5m 85 92%
15m 210 90%
30m 360 89%
1H 1440, 720 94%, 87%
The Karobein Oscillator has an intrinsic sinusoidal behaviour that helps in determining direction and timing. It does not repaint.
Original: alexgrover (www.tradingview.com)
CESCARLATO - ANALISE COMPRA E VENDAMeu primeiro script de análise de compra e venda atravéz de medias moveis 13, 26 e 52 períodos.

Fibonacci Moving Average FBMAEs una media movil exponencia basada en Fibonnaci, el peso del valor del precio decrece exponencialmente según la proporcion áurea, así por ejemplo en un rango de 10 valores los dos primeros o más antiguos tienen un valor de uno, el siguiente de 2, luego 3,5,8,13,21,34 y 55 el más reciente.

Fibonacci EMAsI use this to find the match between the EMAs and Stocks for finding the support and resistance area. For instance, certain stocks work well with 8,13, 21 setup and others work well with 8,21,55.. so on and so forth...


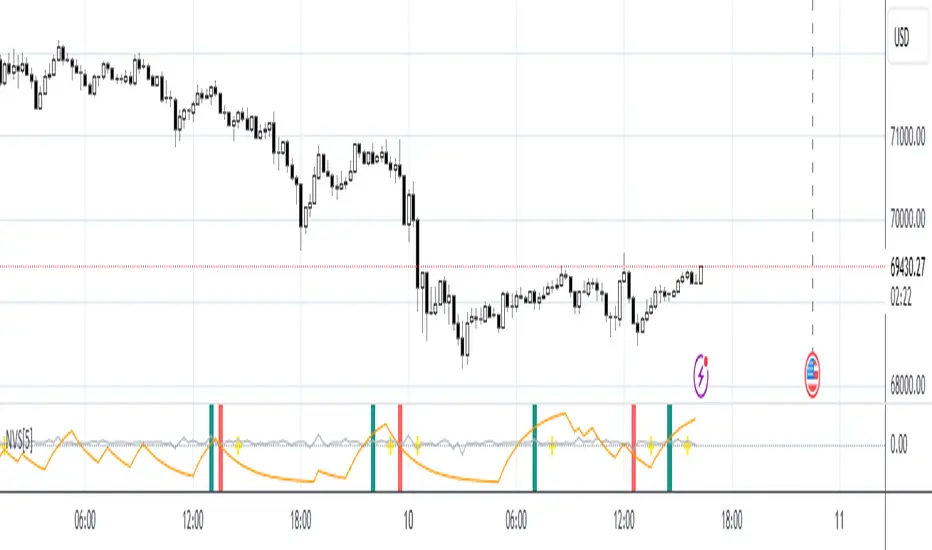
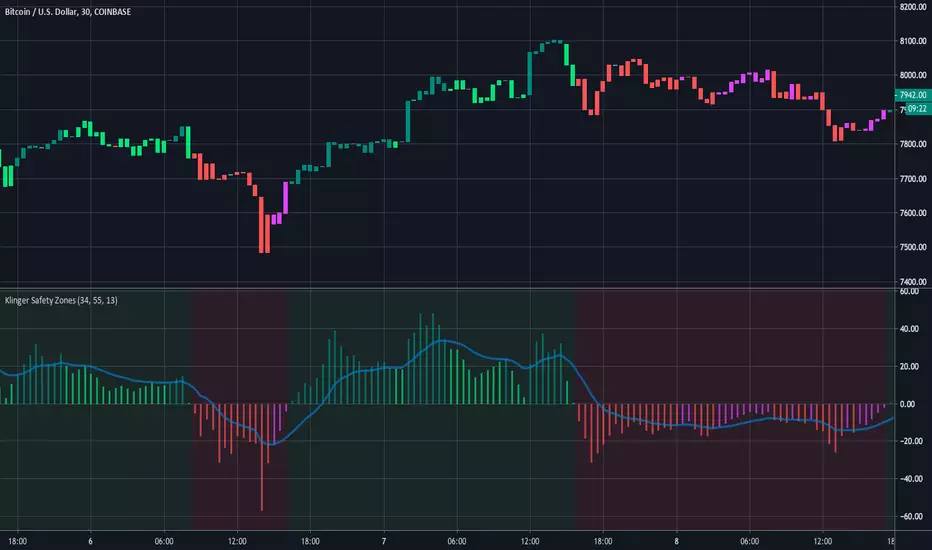
Klinger Safety ZonesThis indicator is based on the Klinger Volume Oscillator, or KVO. The KVO is pretty cool since it can track long-term changes in money flow (both into and out of a market), as well as respond and predict short term price fluctuations.
The Klinger Oscillator determines the direction (or trend) of money flow based on the high, low, and closing price of the security. It then compares all three values (HLC/3) to the previous period’s values to determine how volume should be factored into the KVO. If the current period’s price is greater than that of the previous period, then volume is added. It is subtracted, however, if the price is less than the previous period. This utilization of volume is what makes it an accurate tracker of money flow and a valuable confirmation indicator. This value is often called volume force or the “trend” line.
A fast and slow EMA of the volume force are then calculated. The fast EMA has a smaller window length, while the slow EMA has a larger window. Traders can adjust the lengths of each EMA in the input option menu, but we chose the standard 55 and 34 period lengths as the default settings. We are finally left with the actual KVO value after subtracting the slow EMA from the fast EMA.
The Klinger Oscillator uses a signal line similar to the MACD and many other indicators. The default length for it is 13, but that length can also be adjusted in the input menu. A shorter length will result in more responsiveness but possibly more false signals and whipsaws.
The Chart and Interpretation:
The histogram shows the KVO series. Remember, since the Oscillator represents the difference between the fast and slow EMA, the KVO is bullish when it is greater than zero and bearish when it is less than zero.
When the KVO is greater than zero, the background on the chart is green, meaning that the trend is bullish and traders should look to go long. On the flip side, the background is red when the KVO is less than zero meaning traders should look to go short.
The aqua line plotted on top of the histogram is the signal line.
Here is a quick summary of the histogram colors:
(if KVO > 0 and KVO > signal)
then (color = teal)
if (KVO > 0 and KVO < signal)
then (color = lime)
if (KVO < 0 and KVO < signal)
then (color = red)
if (KVO < 0 and KVO > signal)
then (color = pink)
Users can choose to have the candles change color to match the KVO histogram color by adjusting the setting in the input menu.
~Happy (and safe) trading~
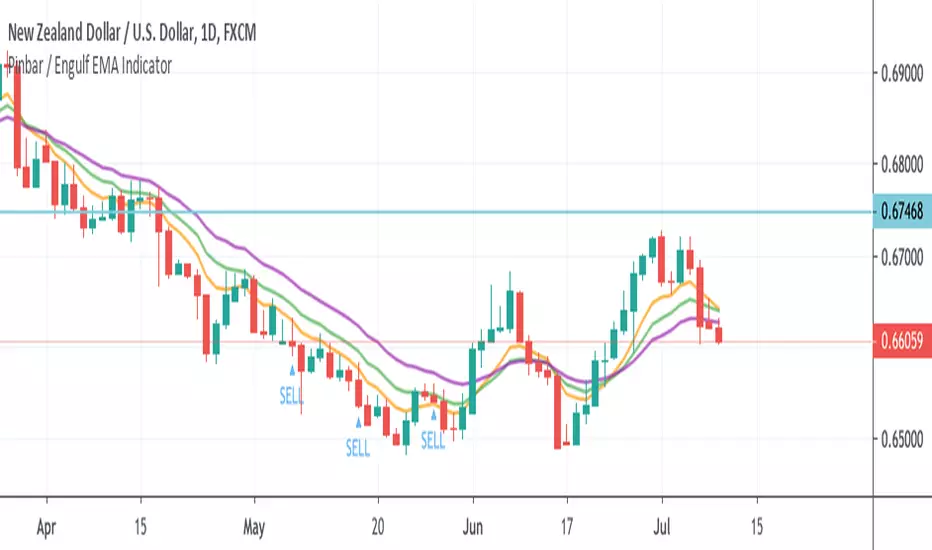
Pinbar / Engulf EMA IndicatorThis indicator is built based on the video by ForexSignals TV (no association on my part with them), published on July 5th, 2019 titled "SIMPLE & PROFITABLE Trend-following Forex Trading Strategy!"
The basic premiss is to use the 8,13,21 EMAs, make sure they have not crossed in the previous 3 bars, then look for engulfing bars or pinbars for the current direction. Meaning if the trend is up, look for bullish engulfer or pinbars, and bearish ones if the trend is down. Also, the pin must have crossed the 8EMA but not the 21EMA.
When determining to act on the signal, the video recommends only executing a buy/sell if the the current trend in the anchor chart is trending in the same direction (trending up only enter buys, trending down, only enter sells).
The script overlays a BUY or SELL tag under the bar that meets the above criteria.


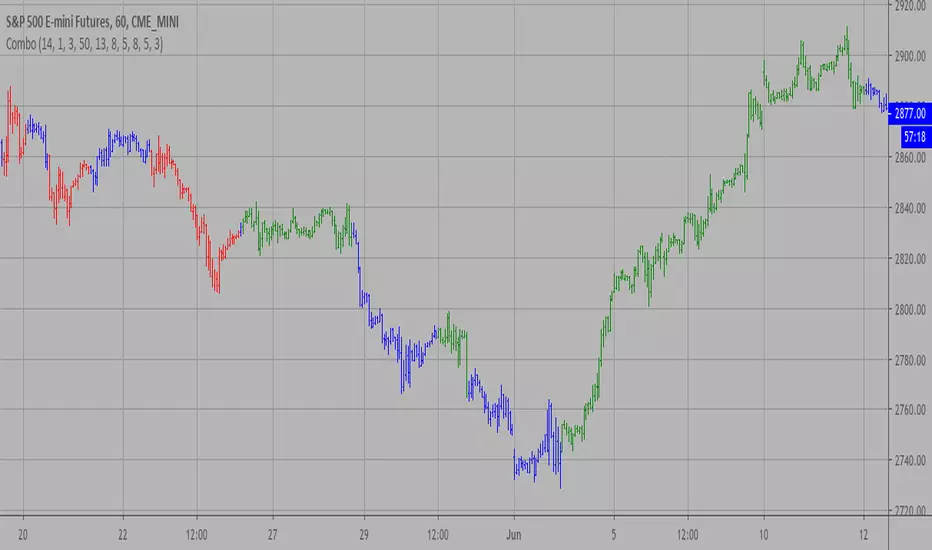
Combo Backtest 123 Reversal & Bill Williams Averages. 3Lines This is combo strategies for get
a cumulative signal. Result signal will return 1 if two strategies
is long, -1 if all strategies is short and 0 if signals of strategies is not equal.
First strategy
This System was created from the Book "How I Tripled My Money In The
Futures Market" by Ulf Jensen, Page 183. This is reverse type of strategies.
The strategy buys at market, if close price is higher than the previous close
during 2 days and the meaning of 9-days Stochastic Slow Oscillator is lower than 50.
The strategy sells at market, if close price is lower than the previous close price
during 2 days and the meaning of 9-days Stochastic Fast Oscillator is higher than 50.
Second strategy
This indicator calculates 3 Moving Averages for default values of
13, 8 and 5 days, with displacement 8, 5 and 3 days: Median Price (High+Low/2).
The most popular method of interpreting a moving average is to compare
the relationship between a moving average of the security's price with
the security's price itself (or between several moving averages).
WARNING:
- For purpose educate only
- This script to change bars colors.

Combo Strategy 123 Reversal & Bill Williams Averages. 3Lines This is combo strategies for get
a cumulative signal. Result signal will return 1 if two strategies
is long, -1 if all strategies is short and 0 if signals of strategies is not equal.
First strategy
This System was created from the Book "How I Tripled My Money In The
Futures Market" by Ulf Jensen, Page 183. This is reverse type of strategies.
The strategy buys at market, if close price is higher than the previous close
during 2 days and the meaning of 9-days Stochastic Slow Oscillator is lower than 50.
The strategy sells at market, if close price is lower than the previous close price
during 2 days and the meaning of 9-days Stochastic Fast Oscillator is higher than 50.
Second strategy
This indicator calculates 3 Moving Averages for default values of
13, 8 and 5 days, with displacement 8, 5 and 3 days: Median Price (High+Low/2).
The most popular method of interpreting a moving average is to compare
the relationship between a moving average of the security's price with
the security's price itself (or between several moving averages).
WARNING:
- For purpose educate only
- This script to change bars colors.
TN MA Cross Potential entry when the MA 5 crosses the MA 13 on an uptrend. This indicator is not meant for a you to buy and sell. It is a way to see if your fav coins are heading in an uptrend.

Nine Fibonacci EMAsAre you running short on available indicators in your chart?
Here you get 9 EMAs of the fibonacci sequence in one ;)
EMAs 8, 13, 21, 34, 55, 89, 144, 233 and 377.
