SMC Pre-Trade Checklist (Mozzys)Here is a **clean, professional description** you can use when publishing your TradingView script.
It clearly explains what the indicator does and why traders use it—perfect for the public library.
---
# **📌 Script Description (for Publishing)**
**SMC Pre-Trade Checklist (Compact Edition)**
This indicator provides a **smart, compact on-chart checklist** designed for traders who use **Smart Money Concepts (SMC)**.
Instead of guessing or rushing entries, the checklist helps you confirm the essential SMC conditions *before* taking a trade.
The checklist displays as a **small 3-column panel** in the corner of your chart, making it easy to scan without covering price action.
All items are controlled through indicator settings, where you can tick each condition as you validate it in your analysis.
---
## **🔥 What This Tool Helps You Do**
This script helps you stay disciplined by verifying the core components of an SMC setup:
### **1. Higher-Timeframe (HTF) Bias**
* Market direction clarity
* Premium vs. discount zones
* HTF POIs and liquidity targets
### **2. Liquidity Conditions**
* Liquidity sweeps
* Liquidity-based take-profit targets
### **3. Market Structure**
* BOS/CHOCH confirmation
* Displacement
* Clean pullback into POI
### **4. Entry Validation**
* Quality POI
* LTF confirmation
* Logical SL/TP and RR
### **5. Risk Management**
* Correct position sizing
* Avoiding high-impact news
* Spread/volatility conditions
### **6. Trader Discipline**
* Trade matches your model
* No revenge or emotional trading
---
## **🎯 Why Traders Love This**
Most losses come from **breaking rules**, not market randomness.
This checklist forces consistency, clarity, and patience—especially in fast environments like FX, indices, and crypto.
* Prevents emotional entries
* Reduces impulsive trades
* Keeps you aligned with your SMC plan
* Works with any strategy or SMC style
* Clean, minimal, non-intrusive layout
---
## **📌 Features**
* Compact 3-column layout
* Customizable from the indicator settings
* Works on all timeframes and assets
* Zero chart clutter
* Perfect for rule-based traders
---
## **🚀 Who This Indicator Is For**
* SMC traders
* ICT-style traders
* Liquidity-based traders
* Anyone who wants more discipline & consistency
* Backtesters who want structured trade evaluation
--
"纳斯达克期货cfd" için komut dosyalarını ara

Daily Dual Pivots (Std + Fib) Extended by Jackel
簡介: 這個指標旨在為日內交易者提供最強大的支撐與阻力參考。它將市場上最常用的兩種 Pivot Points 計算方式——標準 (Standard) 與 斐波那契 (Fibonacci)——結合在同一個圖表中,讓你一眼就能看出關鍵的價格匯聚點 (Confluence Areas)。
主要特色:
雙重系統並存:
標準 Pivot (Standard):以 實線 (Solid Lines) 顯示。這是機構與大部分交易者使用的傳統支撐阻力位。
斐波那契 Pivot (Fibonacci):以 圓點/虛線 (Dotted Lines) 顯示。利用 Fib 黃金比例 (0.382, 0.618) 計算出的潛在反轉位。
清晰的視覺區分:標準版使用暖色系 (紅/綠/橙),Fib 版使用冷色系 (藍/紫),互不干擾,清晰易讀。
可選擴展關卡 (S4-S5 / R4-R5):預設顯示 P, R1-R3, S1-S3。如果市場波動劇烈,你可以在設定中開啟 "Show Extra Levels" 來顯示 R4/R5 及 S4/S5。
自動隱藏歷史:預設只顯示「當日」的線條,保持圖表整潔。如需回測,可開啟「顯示歷史數據」選項。
如何使用:
當 實線 (Standard) 與 虛線 (Fib) 重疊或非常接近時,該區域通常具有更強的支撐或阻力效力。
適用於 15分鐘、1小時或 4小時圖表操作日內交易。
Introduction: This indicator is designed for intraday traders who need precise Support & Resistance levels. It combines the two most popular Pivot Point calculation methods—Standard (Traditional) and Fibonacci—into a single chart, allowing you to easily identify key areas of confluence.
Key Features:
Dual System Strategy:
Standard Pivots: Displayed as Solid Lines. These represent the traditional structural levels used by most traders and institutions.
Fibonacci Pivots: Displayed as Dotted/Circle Lines. These use key Fibonacci ratios (0.382, 0.618) to identify potential reversal zones.
Visual Clarity: Different line styles and color groups allow you to distinguish between Standard and Fib levels instantly without chart clutter.
Extended Levels (Optional): By default, it shows P, R1-R3, and S1-S3. In highly volatile markets, you can enable "Show Extra Levels" in the settings to reveal S4/S5 and R4/R5.
Clean Chart: By default, it only shows levels for the current day. You can enable "Show History" in the settings if you need to backtest.
How to Use:
Look for Confluence: When a Solid Line (Standard) and a Dotted Line (Fib) overlap or are very close to each other, it indicates a very strong Support or Resistance zone.
Best used on 15m, 1H, or 4H charts for intraday analysis.

KING 2 Super Trend Hull (Multi MA)KING supertrend MA nın multi time frame eklenmiş hali alexsander ma gibi ortalamalar da var içinde

KING Super Trend Hull (Multi MA)super trende ortalamalar eklendi. alexander ma degisken ortalama gibi..

Interactive Compound Interest ProjectorThis indicator is an interactive tool designed for long-term investors and analysts who want to compare an asset's performance against a theoretical compound interest growth curve.
Unlike static tools, this script utilizes the Interactive Anchor feature. This allows you to click on any specific point on the chart (e.g., a market bottom, a specific entry date, or a previous all-time high) to serve as the starting point ("Principal") for the projection.
How to use
Add the indicator to your chart.
Important: Because confirm=true is enabled, the script will wait for you to click on the chart. Click on the specific candle you want to use as the "Start Date".
The Yellow Line will appear starting from that candle.
Open the indicator settings to adjust:
Annual Interest Rate: (Default 6.0%).
Project until Year: (Default 2050).
Use this to visualize if an asset is "beating" a standard benchmark (like a 10% S&P500 average or a 4% risk-free rate) from a specific moment in time.
Disclaimer: This tool is for educational and comparative analysis purposes only and does not guarantee future results.

Linda Raschke 5 SMA Reversal [LuciTech]How This Indicator Works:
-5 SMA Tracking: Calculates a 5-period simple moving average and plots it on the chart.
-Extension Counter: Counts consecutive bars where price closes above or below the 5 SMA.
-BUY Signals (Green Up Arrow): Triggers when price closes BELOW the 5 SMA after 7+ consecutive closes ABOVE it—indicates a reversal opportunity into dynamic support.
-SELL Signals (Red Down Arrow): Triggers when price closes ABOVE the 5 SMA after 7+ consecutive closes BELOW it—indicates a reversal bounce setup.
-No Repainting: Signals only plot on confirmed bar closes; no repainting issues.
Linda Raschke's Core Principles:
-Extended Run = Imbalance: When price stays above/below the 5 SMA for 7+ bars, it's a one-sided market; mean reversion is likely.
-First Cross = Trigger: The first close back across the SMA after an extension is the reversal signal, not every touch.
-No Setup? No Trade: Without a prior extension or "three-bar balance" filter, a 5 SMA tag is noise. The model requires the prior momentum condition.
-Uptrend Buys: In uptrends, buy dips to the SMA (dynamic support) as long as the weekly/monthly trend is intact.
-Downtrend Fades: In downtrends, treat first rallies above the SMA as bounce fades into lower lows (especially after 14+ bars below).

Aydan ScalperBy when EMA 8 cross EMA 21 from Below to Abouve and SELL when EMA 21 cross EMA 8 from Abouve to Belove

MTF Trend Dashboard (PSAR, SuperTrend, 200EMA, 9/30 EMA)This script is a multi–timeframe trend dashboard designed to quickly show the market bias across several timeframes in one place.
It does not generate buy/sell signals – it is a visual decision tool to support your own strategy.
What it shows
For up to 5 selectable timeframes, the table displays:
Parabolic SAR – whether PSAR is below (bullish) or above (bearish) the candle.
Supertrend – whether the Supertrend line is below or above the price.
200 EMA status – whether price is trading above (bullish trend) or below (bearish trend) the 200 EMA.
9 / 30 EMA crossover – whether 9 EMA is above (bullish) or below (bearish) the 30 EMA.
Green cells represent bullish conditions, red cells represent bearish conditions.
How to use
Quickly check higher–timeframe trend alignment before entering trades.
Use it as a trend filter for scalping or intraday entries on lower timeframes.
Combine with your own price action / SMC / support–resistance rules for actual entries and exits.

HTCTS - Session & Time LiquidityHTCTS - Session & Time Liquidity
1. ภาพรวมการทำงาน (Overview)
อินดิเคเตอร์ตัวนี้ทำหน้าที่ 4 อย่างหลักพร้อมกัน:
Auto DST (ปรับเวลาตามฤดูอัตโนมัติ): คุณไม่ต้องมานั่งแก้เวลาเมื่อตลาดต่างประเทศเปลี่ยนเวลา (Daylight Saving Time) เพราะโค้ดอ้างอิง Timezone ของตลาดนั้นๆ โดยตรง (เช่น NY ใช้ America/New_York)
Session Bars: แสดงแถบสีเล็กๆ ด้านล่างจอเพื่อบอกว่าตอนนี้อยู่ใน Session ไหน (Asia, London, NY AM, NY PM, Thai) แทนการถมสีพื้นหลังซึ่งอาจจะรกตา
High/Low Levels & Sweeps: เมื่อจบ Session โปรแกรมจะตีเส้น High และ Low ของช่วงเวลานั้นทิ้งไว้ ถ้ากราฟวิ่งไปชนเส้นเหล่านั้น (Breakout/Sweep) เส้นจะเปลี่ยนเป็นเส้นประและขึ้นข้อความว่า "(Swept)"
1. Indicator Overview and Purpose (ICT/SMC Framework)
This custom Pine Script indicator is designed specifically for traders utilizing ICT (Inner Circle Trader) or SMC (Smart Money Concepts) methodologies. Its primary function is to simplify the analysis of Time & Price by automatically defining and tracking key market sessions, their resulting liquidity levels (High/Low), and detecting liquidity sweeps (Stop Hunts).
The indicator is designed to be Zero-Maintenance regarding time zones, as it automatically adjusts for Daylight Saving Time (DST) changes in major financial centers (London, New York).
2. Key Features and Logic
A. Automatic DST Handling (Auto-DST)
The script uses specific, location-based time zones for global markets instead of a fixed GMT/UTC offset.
Asia: Uses Asia/Tokyo.
London: Uses Europe/London (Automatically adjusts for BST).
New York (AM/PM): Uses America/New_York (Automatically adjusts for EST/EDT).
This guarantees that the session times displayed on your chart (regardless of your local time, e.g., Thailand GMT+7) always align with the actual opening and closing moments of the corresponding financial market.

UM VIX30-rolling/VIX Ratio oscillatorSUMMARY
A forward-looking volatility tool that often signals VIX spikes and market reversals before they happen. MA direction flips spotlight the moment volatility pressure shifts.
DESCRIPTION
This indicator compares spot VIX to a synthetic 30-day constant-maturity volatility estimate (“VIX30”) built from VX1 and VX2 futures. The VIX30/VIX Ratio reveals short-term volatility pressure and regime shifts that traditional VX1/VX2 roll-yield alone often misses.
VIX30 is constructed using true calendar-day interpolation between VX1 and VX2, with VX1% and VX2% showing the real-time weights behind the 30-day volatility anchor. The table displays the volatility regime, the VX1/VX2 weights, spot-term roll yield (VIX30/VIX), and futures-term roll yield (VX2/VX1), giving a complete, front-of-the-curve perspective on volatility dynamics.
Use this to spot early vol expansions, collapsing contango, and regime transitions that influence VXX, UVXY, SVIX, VX options, and VIX futures.
⸻
HOW IT WORKS
The script calculates the exact calendar days to expiration for the front two VIX futures. It then applies linear interpolation to blend VX1 and VX2 into a 30-day constant-maturity synthetic volatility measure (“VIX30”). Comparing VIX30 to spot VIX produces the VIX30/VIX Ratio, which highlights short-term volatility pressure and regime direction. A full term-structure table summarizes regime, VX1%/VX2% weights, and both spot-term and futures-term roll yields.
⸻
DEFAULT SETTINGS
VX1! and VX2! are used by default for front-month and second-month futures. These may be manually overridden if TradingView rolls contracts early. The default timeframe is 30 minutes, and the VIX30/VIX Ratio uses a 21-period EMA for regime smoothing. The historical threshold is set to 1.08, reflecting the long-run average relationship between VIX30 and VIX. All settings are user-configurable.
⸻
SUGGESTED USES
• Identify early volatility expansions before they appear in VX1/VX2 roll yield.
• Confirm contango/backwardation shifts with front-of-curve context.
• Time long/short volatility trades in VXX, UVXY, SVIX, and VX options.
• Monitor regime transitions (Low → Cautionary → High) to anticipate trend inflections.
• Combine with price action, NW trends, or MA color-flip systems for higher-confidence entries.
• MA red → green flips may signal opportunities to short volatility or increase equity exposure.
• MA green → red flips may signal opportunities to go long volatility, reduce equity exposure, or even take short-equity positions.
⸻
ALERTS
Alerts trigger when the ratio crosses above or below the historical threshold or when the moving-average slope flips direction. A green flip signals rising volatility pressure; a red flip signals fading or collapsing volatility. These can be used to automate long/short volatility bias shifts or trade-entry notifications.
⸻
FURTHER HINTS
• Increasing orange/red in the table suggests an emerging higher-volatility environment.
• SVIX (inverse volatility ETF) can trend strongly when volatility decays; on a 6h chart, MA green flips often align with attractive short-volatility opportunities.
• For long-volatility trades, consider shrinking to a 30-minute chart and watching for MA green → red flips as early entry cues.
• Experiment with different timeframes and smoothing lengths to match your trading style.
• Higher VIX30/VIX and VX2/VX1 roll yields generally imply faster decay in VXX, UVXY, and UVIX — or stronger upside momentum in SVIX.

TMT EMA Bundle - Hitesh NimjeTMT EMA Bundle - Multi Timeframe EMA Indicator
Created by: Hitesh Nimje | Contact: 8087192915
Overview
The TMT EMA Bundle is a comprehensive multi-EMA indicator designed for traders who rely on multiple exponential moving averages for trend analysis and trading decisions. This powerful tool displays 10 essential EMAs on your chart, providing complete visibility of short, medium, and long-term trends.
Key Features
🔹 10 Essential EMAs Included:
• EMA 9 (Blue) - Ultra Short-term trend
• EMA 11 (Red) - Short-term momentum
• EMA 15 (Yellow) - Quick trend changes
• EMA 21 (Black) - Swing trading reference
• EMA 50 (Gray) - Medium-term bias
• EMA 51 (Orange) - Alternative medium-term
• EMA 55 (Brown) - Extended medium-term
• EMA 100 (Purple) - Long-term trend
• EMA 200 (Maroon) - Major support/resistance
• EMA 400 (Green) - Primary trend direction
🔹 Customizable Settings
• Source selection for each EMA (Open, High, Low, Close, HL2, HLC3, OHLC4)
• Independent length adjustment for each moving average
• Color-coded lines for easy identification
🔹 Professional Features
• Clean, overlay display on price charts
• Optimized performance with max limits set
• Compatible with all timeframes
• Works on all instruments (Forex, Stocks, Crypto, Commodities)
How to Use
1. Trend Identification: All EMAs aligned = Strong trend
2. Support/Resistance: EMAs act as dynamic support/resistance levels
3. Entry Signals: Price reactions at key EMAs
4. Trend Confirmation: EMA crossovers indicate potential trend changes
5. Risk Management: Use EMAs for stop-loss placement
Best Practices
• Use higher timeframes (1H, 4H, Daily) for clearer signals
• Combine with price action and volume analysis
• Watch for EMA clusters and divergences
• Consider trend strength by EMA separation
Perfect For
✓ Swing Traders
✓ Day Traders
✓ Trend Followers
✓ Scalpers (shorter timeframes)
✓ Position Traders
Technical Specifications
• Version: Pine Script v6
• Overlay: Yes
• Multi-timeframe compatible
• No repainting
• Lightweight and efficient
This indicator is part of the Thought Magic Trading collection, designed to provide professional-grade technical analysis tools for serious traders.
Happy Trading! 📈
TRADING DISCLAIMER
RISK WARNING
Trading involves substantial risk of loss and is not suitable for all investors. Past performance is not indicative of future results. You should carefully consider whether trading is suitable for you in light of your circumstances, knowledge, and financial resources.
NO FINANCIAL ADVICE
This indicator is provided for educational and informational purposes only. It does not constitute:
* Financial advice or investment recommendations
* Buy/sell signals or trading signals
* Professional investment advice
* Legal, tax, or accounting guidance
LIMITATIONS AND DISCLAIMERS
Technical Analysis Limitations
* Pivot points are mathematical calculations based on historical price data
* No guarantee of accuracy of price levels or calculations
* Markets can and do behave irrationally for extended periods
* Past performance does not guarantee future results
* Technical analysis should be used in conjunction with fundamental analysis
Data and Calculation Disclaimers
* Calculations are based on available price data at the time of calculation
* Data quality and availability may affect accuracy
* Pivot levels may differ when calculated on different timeframes
* Gaps and irregular market conditions may cause level failures
* Extended hours trading may affect intraday pivot calculations
Market Risks
* Extreme market volatility can invalidate all technical levels
* News events, economic announcements, and market manipulation can cause gaps
* Liquidity issues may prevent execution at calculated levels
* Currency fluctuations, inflation, and interest rate changes affect all levels
* Black swan events and market crashes cannot be predicted by technical analysis
USER RESPONSIBILITIES
Due Diligence
* You are solely responsible for your trading decisions
* Conduct your own research before using this indicator
* Verify calculations with multiple sources before trading
* Consider multiple timeframes and confirm levels with other technical tools
* Never rely solely on one indicator for trading decisions
Risk Management
* Always use proper risk management and position sizing
* Set appropriate stop-losses for all positions
* Never risk more than you can afford to lose
* Consider the inherent risks of leverage and margin trading
* Diversify your portfolio and trading strategies
Professional Consultation
* Consult with qualified financial advisors before trading
* Consider your tax obligations and legal requirements
* Understand the regulations in your jurisdiction
* Seek professional advice for complex trading strategies
LIMITATION OF LIABILITY
Indemnification
The creator and distributor of this indicator shall not be liable for:
* Any trading losses, whether direct or indirect
* Inaccurate or delayed price data
* System failures or technical malfunctions
* Loss of data or profits
* Interruption of service or connectivity issues
No Warranty
This indicator is provided "as is" without warranties of any kind:
* No guarantee of accuracy or completeness
* No warranty of uninterrupted or error-free operation
* No warranty of merchantability or fitness for a particular purpose
* The software may contain bugs or errors
Maximum Liability
In no event shall the liability exceed the purchase price (if any) paid for this indicator. This limitation applies regardless of the theory of liability, whether contract, tort, negligence, or otherwise.
REGULATORY COMPLIANCE
Jurisdiction-Specific Risks
* Regulations vary by country and region
* Some jurisdictions prohibit or restrict certain trading strategies
* Tax implications differ based on your location and trading frequency
* Commodity futures and options trading may have additional requirements
* Currency trading may be regulated differently than stock trading
Professional Trading
* If you are a professional trader, ensure compliance with all applicable regulations
* Adhere to fiduciary duties and best execution requirements
* Maintain required records and reporting
* Follow market abuse regulations and insider trading laws
TECHNICAL SPECIFICATIONS
Data Sources
* Calculations based on TradingView data feeds
* Data accuracy depends on broker and exchange reporting
* Historical data may be subject to adjustments and corrections
* Real-time data may have delays depending on data providers
Software Limitations
* Internet connectivity required for proper operation
* Software updates may change calculations or functionality
* TradingView platform dependencies may affect performance
* Third-party integrations may introduce additional risks
MONEY MANAGEMENT RECOMMENDATIONS
Conservative Approach
* Risk only 1-2% of capital per trade
* Use position sizing based on volatility
* Maintain adequate cash reserves
* Avoid over-leveraging accounts
Portfolio Management
* Diversify across multiple strategies
* Don't put all capital into one approach
* Regularly review and adjust trading strategies
* Maintain detailed trading records
FINAL LEGAL NOTICES
Acceptance of Terms
* By using this indicator, you acknowledge that you have read and understood this disclaimer
* You agree to assume all risks associated with trading
* You confirm that you are legally permitted to trade in your jurisdiction
Updates and Changes
* This disclaimer may be updated without notice
* Continued use constitutes acceptance of any changes
* It is your responsibility to stay informed of updates
Governing Law
* This disclaimer shall be governed by the laws of the jurisdiction where the indicator was created
* Any disputes shall be resolved in the appropriate courts
* Severability clause: If any part of this disclaimer is invalid, the remainder remains enforceable
REMEMBER: THERE ARE NO GUARANTEES IN TRADING. THE MAJORITY OF RETAIL TRADERS LOSE MONEY. TRADE AT YOUR OWN RISK.
Contact Information:
* Creator: Hitesh_Nimje
* Phone: Contact@8087192915
* Source: Thought Magic Trading
© HiteshNimje - All Rights Reserved
This disclaimer should be prominently displayed whenever the indicator is shared, sold, or distributed to ensure users are fully aware of the risks and limitations involved in trading.

Range Deviations PRO | Trade SymmetryRange Deviations PRO — Extended Session Levels
An enhanced version of the original Range Deviations by @joshuuu, retaining the full core logic while adding a key upgrade:
🔹 All session ranges, midlines, and deviation levels now extend into the next trading session, giving seamless multi-session context.
Supports Asia, CBDR, Flout, ONS, and Custom Sessions — with options for half/full standard deviations, equilibrium, and range boxes exactly as in the original.
Extending these levels helps identify:
• Liquidity sweeps
• Trap moves / false breaks
• Daily high/low projections
• Premium–discount behavior across sessions
Ideal for traders using ICT concepts who want clearer continuation of session structure into the next day.
Credit: Original logic by @joshuuu — enhancements by TradeSymmetry.
Disclaimer: Educational use only. Not financial advice.

Auto Trend Channels OXEThis indicator automatically detects and draws trend channels based on swing highs and lows.
How it works:
It identifies pivot points (swing highs/lows) using your chosen lookback period, then connects consecutive pivots to form channels:
Descending channels connect lower highs (resistance line), with a parallel support line projected from the lowest low between those highs
Ascending channels connect higher lows (support line), with a parallel resistance line projected from the highest high between those lows
Key features:
Channels extend forward so you can see where price might interact with them
Broken channels automatically switch to dashed lines and show "✗" labels
Fill shading helps visualize the channel zone
Info table shows current pivot counts
Trading application:
You'd use this for identifying trend direction and potential reversal zones. Price bouncing off channel boundaries = continuation. Price breaking through = potential trend change or acceleration. The "break detection" highlighting makes it easy to spot when a channel has been invalidated.
The pivot length setting is your main control - higher values find longer-term, more significant channels; lower values catch shorter-term moves.

Session, Weekly, Daily LevelsScroll down for hungarian description!
Magyar leíráshoz görgess lejjebb!
Overview
This script provides a unified market structure mapping tool that automatically identifies and visualizes key intraday, daily, and weekly reference levels. It helps traders contextualize price action throughout the trading week by marking true session opens, previous day highs/lows, weekly highs/lows, and weekday opens, all with accurate historical anchoring and correct timezone handling.
What This Script Does
1. Intraday Session Opens (Tokyo, London, New York)
- Detects the exact candle where each session opens.
- Draws horizontal rays with labels.
- Automatically clears lines at the start of each new day.
- Uses a custom local-to-exchange timezone conversion system.
2. Weekly Levels
- Last week high and low (precise bar anchoring, not HTF aggregation)
- Current week open (also Monday open)
- Auto-reset on new week
- Levels are always drawn from the true candle where they formed.
3. Previous Day High & Low
- Continuously tracks intraday highs and lows.
- On a new day, stores yesterday’s values and anchors rays to the exact bars.
- Levels remain visible for the full current day and reset the next day.
4. Weekday Opens (Tue–Fri)
- Captures the exact opening price of Tuesday–Friday.
- Monday open = Week open, so it is not shown separately.
- Auto-reset on new week.
Timezone Logic (Original Feature)
The script converts:
local session times → exchange timezone → chart timestamps
It works correctly regardless of chart timezone or instrument exchange location.
Line Drawing Logic
- Finds the exact bar_index where each level forms.
- Draws rays extending to the right.
- Labels are placed ahead of price.
- Safe updating prevents “bar index too far” errors.
How to Use
- Identify daily/weekly structure.
- Track bias relative to session opens.
- Observe reactions around weekday opens.
- Compare price action to last week's range.
Originality
- Custom timezone conversion engine.
- True historical bar anchoring.
- Fully automated weekly/daily structural resets.
- Independent styling for each level type.
- Not a mashup; all components follow one unified logic.
Limitations
- Does not predict trend or direction.
- Structural tool only.
Summary
A precise and reliable market structure tool that unifies weekly, daily, and intraday reference levels with full timezone automation and true-candle anchoring.
MAGYAR LEÍRÁS
--------------
Áttekintés
Ez az indikátor egy összetett piaci szerkezet-feltérképező eszköz, amely automatikusan megjeleníti a legfontosabb intraday, napi és heti referenciaértékeket. A célja, hogy a kereskedő tisztán lássa a piac aktuális környezetét: hol nyíltak a főbb devizapiaci szekciók, hogyan alakult a tegnapi tartomány, hol volt a múlt heti csúcs/mélypont, és hogyan nyitottak az egyes hétköznapok.
Mit tud a script?
1. Szekciónyitások (Tokyo, London, New York)
- Megkeresi a pontos gyertyát, amely a szekciónyitáskori árat tartalmazza.
- Vízszintes vonalat és címkét rajzol.
- Minden nap elején automatikusan törli a korábbi nap szintjeit.
- Egyedi időzóna-konverziós rendszerrel működik (helyi idő → tőzsdei idő → chart idő).
2. Heti szintek
- Múlt heti maximum és minimum (pontos gyertyapontra horgonyozva)
- Aktuális heti nyitóár (egyben a hétfői nyitó is)
- Új hét kezdetekor automatikusan frissül.
- A múlt heti high/low nem fix időpontra, hanem a valódi gyertyára kerül.
3. Előző napi High és Low
- Folyamatosan követi a napi maximumot és minimumot.
- Napváltáskor elmenti és pontos gyertyáról indítja a ray-t.
- A szintek a teljes nap folyamán megmaradnak, majd a következő nap törlődnek.
4. Hétköznapok nyitóárai (Kedd–Péntek)
- A kedd, szerda, csütörtök és péntek nyitóárát rögzíti és megjeleníti.
- A hétfői nyitó a Week Open, ezért külön nem jelenik meg.
- Heti váltáskor automatikusan törlődnek.
Időzóna-kezelés (egyedi megoldás)
A script a felhasználó helyi idejét átszámítja az instrumentum tőzsdei időzónájára, majd a chartra vetíti.
Ez biztosítja, hogy minden szekciónyitás helyesen jelenik meg, bármely chart vagy instrumentum esetén.
Vonalrajzolási logika
- A szintek a valódi bar_index alapján kerülnek rögzítésre.
- Jobbra nyúló ray-eket rajzol.
- A címkék mindig a jobb oldalon, előre helyezve jelennek meg.
- Biztonságos frissítési rendszer akadályozza meg a hibákat (pl. “bar index too far”).
Használat
- Napi/heti szerkezet meghatározása.
- Bias követése a session openekhez viszonyítva.
- Reakciók figyelése a hétköznapok nyitóárai körül.
- Összevetés a múlt heti tartománnyal.
Eredetiség
- Egyedi időzóna-kezelő motor.
- Igazi gyertyapont-alapú horgonyzás.
- Automatikus napi/heti reset.
- Minden szint külön stílusban konfigurálható.
- Nem mashup; egységes rendszer.
Összegzés
Professzionális, pontos eszköz a piaci szerkezet feltérképezésére, amely egyesíti a heti, napi és intraday szinteket, teljes időzóna-automatizálással és gyertyapontra horgonyzott kijelölésekkel.

Multi-TF Candle Gap DetectorHigh timeframe gap detector, these work well to identify key levels to trade from

10% and 23.6% support bandsWhen a share is in momentum and showing lot of strength that relative strength it takes breather at 10% band from new 52 week high and and tends to consolidate at 23.6% from new 52 week high. This forms a higher low and gives opportunity to get in the rally. The volume bars should be taken into consideration as low volume and dry up at the bottom indicate reversal is coming. The stoploss for all entry is 1% below recent base low and entry pont is crossing of weekly high with greater than 20 days volume average.

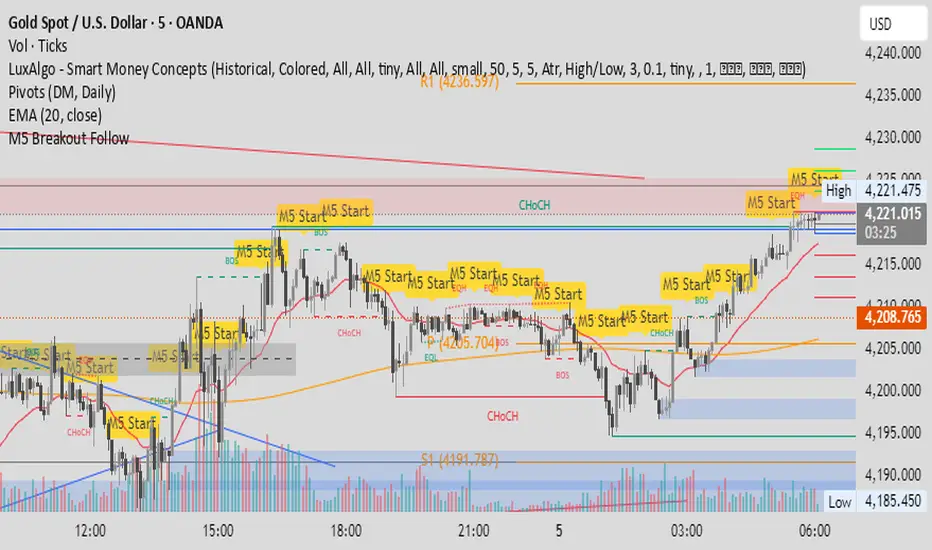
M5 Candle Follow Breakout - Teknik Gold Fanatic V2 This technique is entirely the property of Prof Sastra Gold Fanatic.
This technique uses a strategy of following breakouts from the first M5 of each hour.


Range Lattice## RangeLattice
RangeLattice constructs a higher-timeframe scaffolding on any intraday chart, locking in structural highs/lows, mid/quarter grids, VWAP confluence, and live acceptance/break analytics. It provides a non-repainting overlay that turns range management into a disciplined process.
HOW IT WORKS
Structure Harvesting – Using request.security() , the script samples highs/lows from a user-selected timeframe (default 240 minutes) over a configurable lookback to establish the dominant range.
Grid Construction – Midpoint and quarter levels are derived mathematically, mirroring how institutional traders map distribution/accumulation zones.
Acceptance Detection – Consecutive closes inside the range flip an acceptance flag and darken the cloud, signaling balanced auction conditions.
Break Confirmation – Multi-bar closes outside the structure raise break labels and alerts, filtering the countless fake-outs that plague breakout traders.
VWAP Fan Overlay – Session VWAP plus ATR-based bands provide a live measure of flow centering relative to the lattice.
HOW TO USE IT
Range Plays : Fade taps of the outer rails only when acceptance is active and VWAP sits inside the grid—this is where mean-reversion works best.
Breakout Plays : Wait for confirmed break labels before entering expansion trades; the dashboard's Width/ATR metric tells you if the expansion has enough fuel.
Market Prep : Carry the same lattice from pre-market into regular trading hours by keeping the structure timeframe fixed; alerts keep you notified even when managing multiple tickers.
VISUAL FEATURES
Range Tap and Mid Pivot markers provide a tape-reading breadcrumb trail for journaling.
Cloud fill opacity tightens when acceptance persists, visually signaling balance compressions ready to break.
Dashboard displays absolute width, ATR-normalized width, and current state (Balanced vs Transitional) so you can glance across charts quickly.
Acceptance Flag toggle: Keep the repeated acceptance squares hidden until you need to audit balance.
PARAMETERS
Structure Timeframe (default: 240): Choose the timeframe whose ranges matter most (4H for indices, Daily for stocks).
Structure Lookback (default: 60): Bars sampled on the structure timeframe.
Acceptance Bars (default: 8): How many consecutive bars inside the range confirm balance.
Break Confirmation Bars (default: 3): Bars required outside the range to validate a breakout.
ATR Reference (default: 14): ATR period for width normalization.
Show Midpoint Grid (default: enabled): Display the midpoint and quarter levels.
Show Adaptive VWAP Fan (default: enabled): Toggle the VWAP channel for assets where volume distribution matters most.
Show Acceptance Flags (default: disabled): Turn the acceptance markers on/off for maximum visual control.
Show Range Dashboard (default: enabled): Disable if screen space is limited, re-enable during prep sessions.
ALERTS
The indicator includes five alert conditions:
Range High Tap: Price interacted with the RangeLattice high
Range Low Tap: Price interacted with the RangeLattice low
Range Mid Tap: Price interacted with the RangeLattice mid
Range Break Up: Confirmed upside breakout
Range Break Down: Confirmed downside breakout
Where it works best
This indicator works best on liquid instruments with clear structural levels. On very low timeframes (1-minute and below), the structure may update too frequently to be useful. The acceptance/break confirmation system requires patience—faster traders may find the multi-bar confirmation too slow for scalping. The VWAP fan is session-based and resets daily, which may not suit all trading styles.

CharisTrend Indicatorthis trading indicator uses the following parameters EMA LOW (25 34 89 110 355 and 480) SMA(14 and 28) and Supertrend(14 3) for trading analysis and BUY/SELL Signals when the trade aligns.

Daily Range Zones: PDH/PDL with SL/TPThis indicator automatically plots the previous day's High and Low levels and projects dynamic Stop Loss (SL) and Take Profit (TP) zones based on the daily range percentage.
It is designed for traders focusing on daily range breakouts or mean reversion strategies around the Previous Day High (PDH) and Previous Day Low (PDL).
Key Features:
Level 0 & 1: Visualizes the exact High and Low of the reference timeframe (Daily).
Inner Zone (Orange): Calculated inside the range. Acts as a buffer for Stop Loss placement or entry zones for mean reversion.
Outer Zone (Purple): Calculated outside the range (extension). Acts as a primary Take Profit target for breakout trades.
Settings:
Fully customizable percentages for inner and outer zones.
Option to toggle between current day or previous day data.
Works on any timeframe (intraday charts recommended).

Shezab AlgoLabs EMA Trend UtilityOverview
This tool is a clean and practical EMA trend utility built to help traders quickly understand market direction, trend regime, and momentum shifts. It plots a fast EMA and slow EMA using a branded color theme and highlights transitions between bullish and bearish conditions. The script also includes optional visual crossover markers to make regime changes easier to spot.
How it works
The relationship between the fast and slow EMA is used to classify the trend environment:
When the fast EMA is above the slow EMA, the market is considered in a bullish phase.
When the fast EMA is below the slow EMA, the market is considered in a bearish phase.
The script also provides optional:
Colored bars reflecting trend direction
Crossover labels to highlight momentum shifts
Background cloud to visually emphasize trending or neutral conditions
Optional alerts for crossover events
These visual features help traders recognize potential trend transitions without implying a complete trading system.
How to use it
This tool is designed as a supplemental decision aid. Traders can combine it with their preferred structure analysis, volume tools, oscillators, or confirmation methods. The crossover markers and alerts highlight shifts in trend behavior but are informational rather than mechanical buy/sell signals. Users should apply their own risk-management and entry criteria.
Originality
This script goes beyond a standard EMA by combining multiple elements into a single, cohesive trend-clarification tool:
• regime coloring
• optional cloud regions
• crossover markers
• visual dynamic styling using a unified aesthetic palette
It is not a mashup of existing scripts; all components are integrated specifically to support traders who prefer a simple-yet-clear visual framework for understanding trend behavior.
