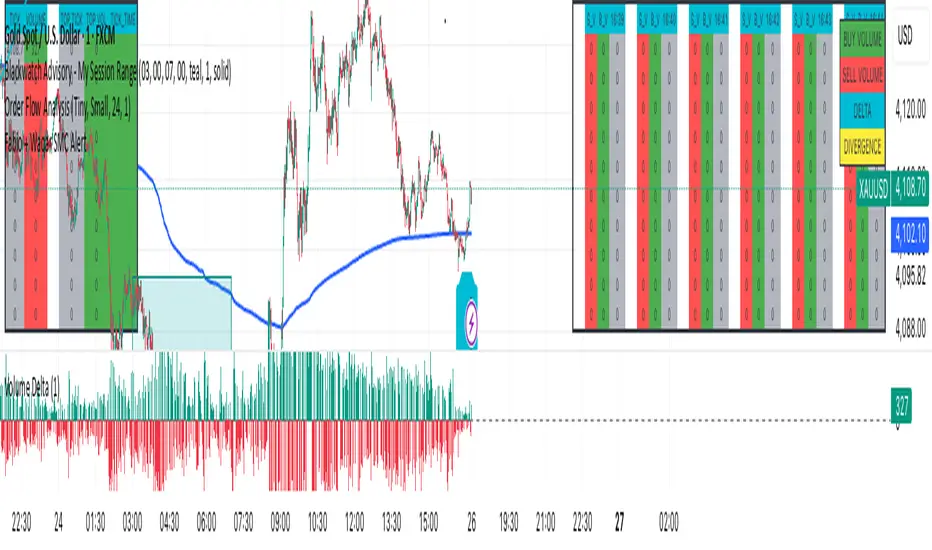
F & W SMC Alerthis script is a custom TradingView indicator designed to combine elements of a trend‑following VWAP approach (inspired by the “Fabio” strategy) with a smart‑money‑concepts framework (inspired by Waqar Asim). Here’s what it does:
* **Directional bias:** It calculates a 15‑minute VWAP and compares the current 15‑minute close to it. When price is above the 15‑minute VWAP, the script assumes a long bias; when below, a short bias. This reflects the trend‑following aspect of the Fabio strategy.
* **Liquidity sweeps:** Using recent pivot highs and lows on the current timeframe, it identifies when price takes out a recent high (for potential longs) or low (for potential shorts). This represents a “liquidity sweep” — a fake breakout that collects stops and signals a possible reversal or continuation.
* **Break of structure (BOS):** After a sweep, the script confirms that price is breaking away from the swept level (i.e., higher than recent highs for longs or lower than recent lows for shorts). This BOS confirmation helps avoid false signals.
* **Entry filters:** For a long setup, the bias must be long, there must be a liquidity sweep followed by a BOS, and price must reclaim the current‑timeframe VWAP. For a short setup, the opposite conditions apply (short bias, sweep + BOS to the downside, and price rejecting the VWAP).
* **Alerts and plot:** It provides two alert conditions (“Fabio‑Waqar Long Setup” and “Fabio‑Waqar Short Setup”) that you can attach to notifications. It also plots the intraday VWAP on your chart for visual reference.
In short, this script watches for a confluence of trend direction, liquidity sweeps, structural shifts, and VWAP reclaim/rejection, and then notifies you when those conditions align. You can use it as an alerting tool to identify high‑probability setups based on these combined strategies.
"纳斯达克期货cfd" için komut dosyalarını ara

Fabio + Waqar SMC AlertThis script is a custom TradingView indicator designed to combine elements of a trend‑following VWAP approach (inspired by the “Fabio” strategy) with a smart‑money‑concepts framework (inspired by Waqar Asim). Here’s what it does:
* **Directional bias:** It calculates a 15‑minute VWAP and compares the current 15‑minute close to it. When price is above the 15‑minute VWAP, the script assumes a long bias; when below, a short bias. This reflects the trend‑following aspect of the Fabio strategy.
* **Liquidity sweeps:** Using recent pivot highs and lows on the current timeframe, it identifies when price takes out a recent high (for potential longs) or low (for potential shorts). This represents a “liquidity sweep” — a fake breakout that collects stops and signals a possible reversal or continuation.
* **Break of structure (BOS):** After a sweep, the script confirms that price is breaking away from the swept level (i.e., higher than recent highs for longs or lower than recent lows for shorts). This BOS confirmation helps avoid false signals.
* **Entry filters:** For a long setup, the bias must be long, there must be a liquidity sweep followed by a BOS, and price must reclaim the current‑timeframe VWAP. For a short setup, the opposite conditions apply (short bias, sweep + BOS to the downside, and price rejecting the VWAP).
* **Alerts and plot:** It provides two alert conditions (“Fabio‑Waqar Long Setup” and “Fabio‑Waqar Short Setup”) that you can attach to notifications. It also plots the intraday VWAP on your chart for visual reference.
In short, this script watches for a confluence of trend direction, liquidity sweeps, structural shifts, and VWAP reclaim/rejection, and then notifies you when those conditions align. You can use it as an alerting tool to identify high‑probability setups based on these combined strategies.
MACD with Smart Entry Signals & Trend Filter
This advanced MACD indicator combines traditional MACD analysis with intelligent entry signal detection and an optional EMA trend filter. It identifies high-probability entry points by analyzing histogram patterns, consolidation phases, and trend continuation setups.
### Key Features
**🎯 Smart Entry Detection**
- **Consolidation Breakouts**: Identifies exits from consolidation zones (weak bars) with strong momentum
- **Trend Reversals**: Detects potential trend changes after extended weak phases
- **Correction/Continuation Patterns**: Recognizes brief corrections within strong trends that offer continuation opportunities
**📊 Enhanced MACD Visualization**
- Color-coded histogram showing four distinct states:
- Strong Bullish (dark green): Rising histogram above zero
- Weak Bullish (light green): Falling histogram above zero
- Weak Bearish (light red): Rising histogram below zero
- Strong Bearish (dark red): Falling histogram below zero
**🔍 Multi-Layer Filtering System**
- **Candle Size Filter**: Eliminates signals during high volatility/large candle ranges
- **EMA Trend Filter**: Optional filter ensuring entries align with the dominant trend direction
- Visual markers for rejected signals (orange X for candle size, blue E for EMA trend)
**⚙️ Customizable Parameters**
- Adjustable MACD periods (default: 34/144/9)
- Configurable consolidation bar requirements
- Flexible correction pattern detection
- EMA trend filter with adjustable sensitivity
- Multiple alert types for all signal conditions
### How to Use
1. **Enable/disable filters** based on your trading style and market conditions
2. **Green triangles (L)**: Long entry signals when all conditions are met
3. **Red triangles (S)**: Short entry signals when all conditions are met
4. **Rejected signal markers**: Help you understand why certain setups were filtered out
5. **Background coloring**: Provides visual confirmation of signal zones and correction patterns
### Alert System
Comprehensive alerts for:
- Long and short entry signals
- Specific pattern types (consolidation, reversal, continuation)
- Rejected signals (helps refine strategy)
- Traditional MACD histogram crossovers
### Best Practices
- Use the EMA trend filter in trending markets to avoid counter-trend trades
- Adjust candle size filter based on your instrument's typical volatility
- Consider combining with support/resistance levels for confirmation
- Test different consolidation bar settings for your timeframe
### Parameters Summary
- Fast/Slow Length: MACD calculation periods
- Signal Smoothing: Signal line period
- Consolidation Bars: Minimum weak bars before breakout
- Max Candle Range: Filter for oversized candles
- EMA Period & Sensitivity: Trend filter configuration
---
*This indicator is designed for traders who want a systematic approach to identifying MACD-based entry opportunities with built-in risk management through filtering.*


3 EMA Breakout + RSI Pro3in 1 will mostly tell yuo the direction of the trend and tell you to buy and sell but it is not a guarantee that you will take the trade this is only a technical analysis.

3 EMA Breakout + RSI Pro3in 1 will mostly tell yuo the direction of the trend and tell you to buy and sell but it is not a guarantee that you will take the trade this is only a technical analysis.

3 EMA Breakout + RSI Pro3in 1 will mostly tell yuo the direction of the trend and tell you to buy and sell but it is not a guarantee that you will take the trade this is only a technical analysis.

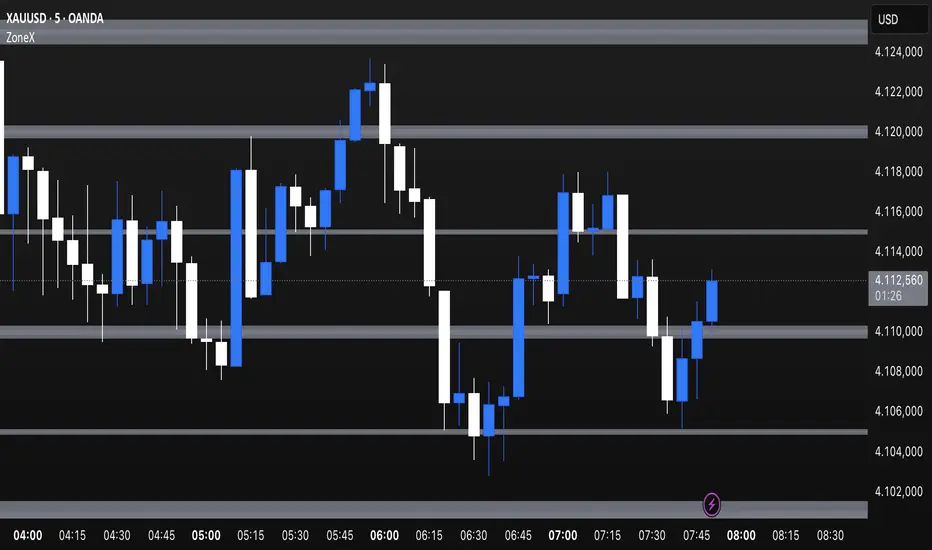
XAUUSD Family Scalping (5min)🟡 XAUUSD Family Scalping 5-Min — Momentum Precision Indicator
Overview
This indicator is built for XAUUSD (Gold) on the 5-minute timeframe and is designed for short-term momentum scalping.
It helps traders identify early reversal zones, confirm momentum direction, and detect exhaustion points during high-volatility market moves.
Core Concept
The indicator measures momentum strength and price acceleration using a smoothed oscillator.
It features two adjustable thresholds:
Overbought level: 58
Oversold level: -58
When the momentum line crosses above or below these zones, it signals potential trend continuation or reversal opportunities.
Features
Detects short-term momentum shifts on XAUUSD 5M.
Works with EMA-based trend confirmation (optional).
Adaptive smoothing reduces noise and false reversals.
Highlights overbought/oversold areas visually.
Can be combined with price action or other oscillators for confluence.
Usage
Instrument: XAUUSD (Gold)
Best timeframe: 5-minute (scalping setup)
Use case: Detecting momentum exhaustion and reversal entries.
Sessions: London & New York recommended.
Disclaimer
This indicator is for market analysis and educational purposes.
No indicator guarantees profit — use proper risk management and test before live trading.

Min_Position_Size_ALLLibrary "Min_Position_Size_ALL"
getMinPositionSize(symbol_, type_, broker_)
Parameters:
symbol_ (string)
type_ (string)
broker_ (string)

VIX Overnight Unch or Up AlertThis indicator alerts when VIX opens the day unchanged or higher on the day. If in fact VIX opens up unchanged or higher, it will display near the first bar of the day, previous day's close time and level and the opening time and level. The close time is typically 16:15 New York Time and the opening time is 09:30 or the first print a few minutes later. I use TVC:VIX instead of CBOT because TVC for me is real time. I also use the 1 minute chart and the script is coded as 1 minute.

Midnight Lines for Tokyo, London, New Yorkممتاز 👌 إليك **تعريفًا محدثًا وكاملًا للمؤشر باللغتين العربية والإنجليزية**، مع إدراج توضيح دقيق لتعامل المؤشر مع **تغيّر التوقيت الصيفي والشتوي (DST)** في لندن ونيويورك:
---
## 🇬🇧 **English Description (with DST behavior)**
**Indicator name:** *Midnight Lines for Tokyo, London, and New York*
**Purpose:**
This indicator automatically draws **vertical lines** on the chart at **midnight (00:00)** for the three major global trading sessions:
* **Tokyo**
* **London**
* **New York**
### 🔹 How it works:
1. The script checks each candle’s time using the built-in TradingView time zone function:
* `"Asia/Tokyo"`
* `"Europe/London"`
* `"America/New_York"`
2. When it detects **00:00** in any of these zones, it draws:
* A **vertical dotted line** that extends from the top to the bottom of the chart.
* A **label** at the top with the session name (e.g., “Tokyo Midnight”).
3. Each session has its own color for clarity:
* **Blue** → Tokyo Midnight
* **Green** → London Midnight
* **Red** → New York Midnight
### 🕒 Automatic Daylight Saving Time (DST) Adjustment:
The indicator automatically adapts to **Daylight Saving Time changes** in both **London** and **New York**:
* When London switches between **GMT and GMT+1**, the midnight line shifts automatically to remain accurate.
* When New York switches between **EST and EDT**, the script also updates accordingly.
* Tokyo does **not** observe DST, so its timing stays constant year-round.
### 🎯 Purpose:
Helps traders visually track the start of each new trading day in the major sessions and analyze:
* Session overlaps (e.g., London–New York overlap)
* Session-based trading strategies
* Price movement behavior at each new day open
---
## 🇸🇦 **الوصف بالعربية (مع إدراج تغير التوقيت)**
**اسم المؤشر:** خطوط منتصف الليل لجلسات طوكيو، لندن، ونيويورك
**الهدف:**
يقوم هذا المؤشر تلقائيًا برسم **خطوط عمودية** على الرسم البياني عند **منتصف الليل (00:00)** لكل من الجلسات الثلاث الرئيسية:
* **جلسة طوكيو**
* **جلسة لندن**
* **جلسة نيويورك**
### 🔹 كيفية العمل:
1. يستخدم المؤشر دوال TradingView لحساب الوقت الفعلي لكل مدينة:
* `"Asia/Tokyo"` لطوكيو
* `"Europe/London"` للندن
* `"America/New_York"` لنيويورك
2. عند وصول الساعة إلى **00:00** بتوقيت أي مدينة، يرسم المؤشر:
* **خطًا عموديًا متقطعًا** يمتد من أعلى إلى أسفل الرسم البياني.
* **تسمية (Label)** أعلى الخط باسم الجلسة (مثل “Tokyo Midnight”).
3. كل جلسة لها لون مختلف:
* **أزرق** → منتصف طوكيو
* **أخضر** → منتصف لندن
* **أحمر** → منتصف نيويورك
### 🕒 التعامل مع تغيّر التوقيت الصيفي والشتوي (DST):
يتكيّف المؤشر تلقائيًا مع تغيّر التوقيت في لندن ونيويورك:
* عندما تنتقل لندن بين **التوقيت الشتوي (GMT)** و**التوقيت الصيفي (GMT+1)**، يتحرك الخط تلقائيًا ليبقى في الساعة 00:00 المحلية.
* وعندما تنتقل نيويورك بين **EST** و**EDT**، يتم تعديل الخط كذلك تلقائيًا.
* أما طوكيو فلا تعتمد التوقيت الصيفي، لذا يبقى وقتها ثابتًا دائمًا على الساعة **00:00 JST**.
### 🎯 الفائدة:
يساعد المتداولين على تحديد **بداية كل جلسة تداول رئيسية**، ومراقبة:
* **تداخل الجلسات** مثل لندن ونيويورك
* **تحركات السعر عند بداية اليوم الجديد**
* **استراتيجيات التداول الزمنية حسب الجلسة**
---

SPX / Silver (XAGUSD) RatioThis script visualizes the S&P 500 Index to Silver ratio (SPX/Silver) — a powerful tool for monitoring the relative strength of equities vs. precious metals over time.
📊 Use Case:
Helps traders assess macro sentiment shifts between risk-on (equities) and risk-off (commodities).
A rising ratio indicates equity outperformance vs Silver, often in growth-driven bull markets.
A falling ratio suggests Silver is outperforming — potentially due to inflation, geopolitical risk, or weakening equities.
⚙️ Data & Calculation:
SPX: SP:SPX (S&P 500 Index)
Silver: TVC:SILVER
Formula:
SPX / Silver
(Both are spot/index prices, updated on daily timeframe)
📈 Interpretation:
📈 Ratio Rising → SPX outperforming Silver → Risk-on sentiment
📉 Ratio Falling → Silver outperforming SPX → Possible flight to safety or inflation hedge
🧠 Ideal For:
Macro trend analysis
Intermarket strategy development
Asset rotation decision-making
Spotting Silver bottoms during SPX/Silver peak zones

WAD : Whale Activity Detector🐋 WAD: Whale Activity Detector
WAD (Whale Activity Detector) automatically detects periods of abnormally high trading volume compared to the average, identifying potential whale (institutional) buy or sell activity and visualizing it directly on the chart.
🔍 How It Works
1. Buy/Sell Volume Separation
Each candle’s trading volume is categorized based on its direction:
Bullish candle → Buy volume
Bearish candle → Sell volume
This separation helps distinguish the actual strength of buying vs. selling pressure, rather than looking at total volume alone.
2. Average Volume Calculation
Over a user-defined lookback period (default: 34 bars), the indicator calculates the moving average of both buy and sell volumes, establishing a baseline for what constitutes “normal” activity.
3. Whale Activity Detection
When the current volume exceeds n times the average volume (default: 4×), the indicator flags it as a Whale Zone — a potential sign of large player involvement.
Volume surge on a bullish candle → Whale Buy
Volume surge on a bearish candle → Whale Sell
4. Visual Display
🟢 Green bars: Whale buy activity
🔴 Red bars: Whale sell activity
BUY/SELL labels: Appear above the chart when an anomaly is detected
Average line toggle: Users can turn the average volume lines on or off for clarity
5. Alerts
Whenever whale buy/sell signals are detected, real-time alerts are triggered.
Example: 🐋 Whale Buy – NVDA! 🟢
⚙️ Indicator Meaning
Rather than showing raw volume, WAD tracks “abnormal volume relative to the average.”
It filters out noise and highlights the moments where large entities begin to move.
Essentially, it visualizes intentional and impactful trades hidden within standard volume activity.
🚀 Example Use Cases
Whale accumulation tracking – Repeated strong buy signals may indicate sustained institutional accumulation.
Short-term breakout confirmation – Price often rallies shortly after whale buy signals appear.
Support/resistance analysis – Whale sell zones frequently align with short-term resistance areas.
In short:
WAD identifies when trading volume exceeds its historical norm to highlight where big money enters or exits the market.
===============================================================================
🐋 WAD : 세력 매매거래 추적기
WAD(Whale Activity Detector) 는 특정 종목의 거래량 패턴 속에서
‘평균 대비 비정상적으로 큰 거래량이 발생한 구간’을 자동으로 감지해
세력(Whale)의 매수·매도 활동을 시각화하는 지표입니다.
🔍 작동 원리
매수·매도 거래량 분리
각 캔들이 양봉인지, 음봉인지에 따라 거래량을 분리합니다.
양봉 시 발생한 거래량 → 매수 거래량(buy volume)
음봉 시 발생한 거래량 → 매도 거래량(sell volume)
이렇게 분리함으로써 단순 거래량이 아닌,
실제 매수세/매도세의 힘을 구분할 수 있습니다.
평균 거래량 계산
사용자가 지정한 기간(기본 34봉)을 기준으로
매수·매도 거래량의 이동평균선을 각각 계산합니다.
이는 ‘정상적인 거래량 수준’을 판단하는 기준선으로 활용됩니다.
이상치 탐지 (Whale Activity Detection)
현재 거래량이 평균 거래량의 n배(기본 4배)를 초과할 경우,
그 구간을 세력 개입 구간(Whale Zone) 으로 판단합니다.
양봉에서 급증 → 세력 매수 (Whale Buy)
음봉에서 급증 → 세력 매도 (Whale Sell)
시각적 표시
초록색 기둥 : 세력 매수 거래량
빨간색 기둥 : 세력 매도 거래량
라벨 표시 (BUY / SELL) : 이상치 발생 시 차트 상단에 표시
평균선 표시 옵션 : 사용자가 원할 때 평균선을 켜거나 끌 수 있음
알림(Alerts)
세력의 매수·매도 신호가 감지되면,
알림 메시지를 통해 실시간으로 통보받을 수 있습니다.
(예: 🐋 Whale Buy - NVDA! 🟢)
⚙️ 지표의 의미
단순 거래량이 아니라, ‘평균 대비 비정상적 거래량’ 을 추적합니다.
즉, “세력이 본격적으로 움직이기 시작한 구간” 만 걸러내는 지표입니다.
노이즈가 많은 거래량 차트 속에서 의도 있는 거래의 흔적을 포착할 수 있습니다.
🚀 활용 예시
세력 매집 구간 포착 : 큰 매수 시그널이 반복적으로 발생하는 구간은 세력의 누적 매집 가능성을 의미함
단기 급등 신호 확인 : 매수 이상치가 발생한 직후 가격이 급등하는 경우가 많음
지지/저항 분석과 병행 활용 : 세력 매도 구간은 단기 저항으로 작용하는 경향이 있음
copyright @invest_hedgeway

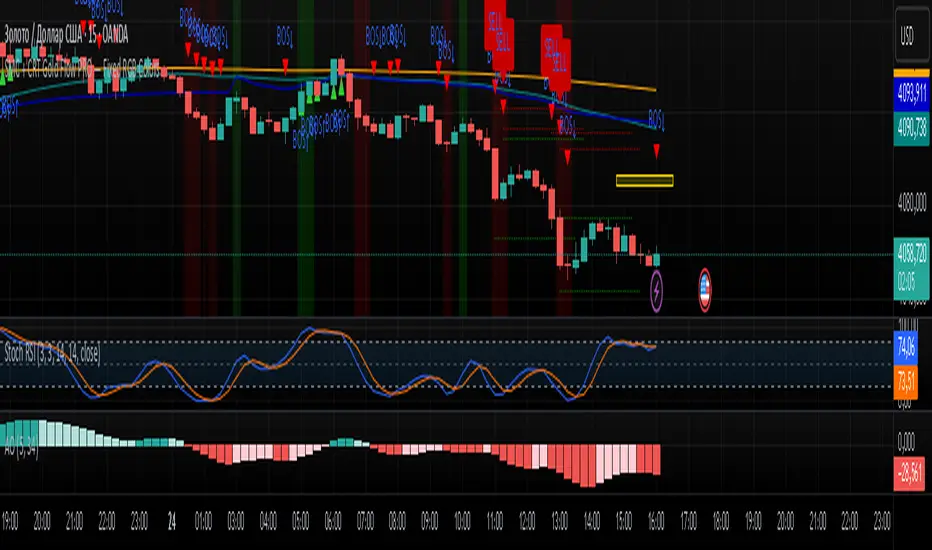
SMC + CRT Gold Flow PRO — Fixed RGB ColorsSCRIPT FOR GOLD. I used SMC + CRT strategies. I analyze in H4 timeframe and enter in m15 time frame.
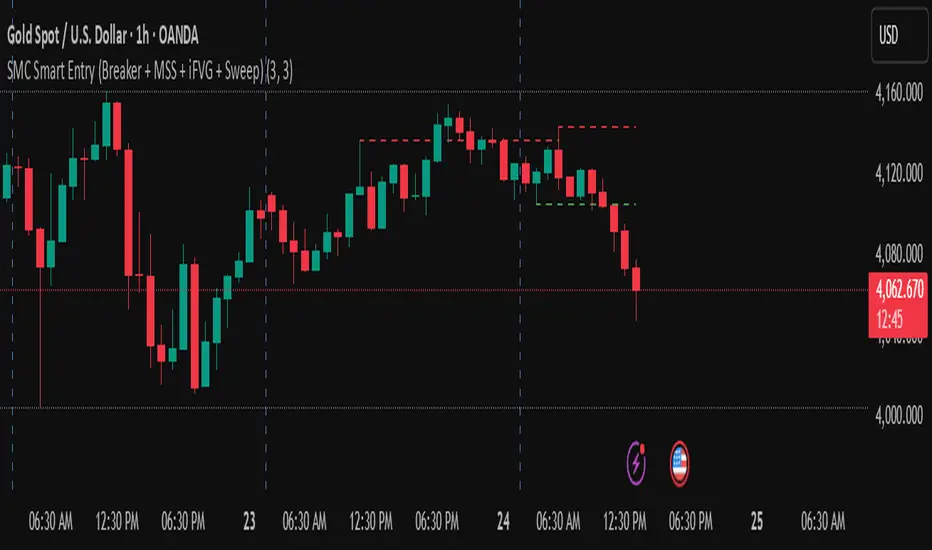
golden smart entrySmart Money Concepts (SMC) is a trading methodology that focuses on understanding and following the behavior of institutional investors—often referred to as "smart money." The goal is to identify high-probability trade setups by analyzing how these large players move the market.
Bollinger Bands Breakout StrategyHey guys check out this strategy script.
Chart plotting:
I use a classic plot of Bollinger Bands to define a consolidation zone, I also use a separate Trend Filter (SMA).
Logic:
When the price is above the SMA and above the Bollinger Upper Band the strategy goes Long. When the price is below the SMA and below the Bollinger Lower Band the strategy goes Short. Simple.
Exits:
TP and SL are a percentage of the price.
Notes: This simple strategy can be used at any timeframe (I prefer the 15min for day trading). It avoids consolidation, when the price is inside the Bollinger Bands, and has a good success rate. Adjust the Length of the BB to suit your style of trading (Lower numbers=more volatile, Higher numbers=more restrictive). Also you can adjust the Trend Filter SMA, I presonally chose the 50 SMA. Finally the SL/TP can be also adjusted from the input menu.
Test it for yourself!
Have great trades!

Dynamic Length RSI (DRSI)Dynamic Length RSI (DRSI)
This indicator is an advanced tool that seeks to improve the sensitivity and adaptability of the traditional Relative Strength Index (RSI).
Its main feature is that it uses a variable length calculation instead of a fixed length (like the standard 14), automatically adjusting to market volatility conditions. The length used to calculate the RSI dynamically adjusts between a predefined minimum and maximum, based on volatility (ATR).
The change in length is indicated by the candlestick background. Gray candles represent ascending Dyn (weakness/consolidation/declining volatility), blue or white candles represent descending Dyn (strength, trend, rising volatility).

Liquidity Swap Detector Ultimate - Cedric JeanjeanAdvanced Smart Money Concepts indicator designed to detect high-probability liquidity sweeps and institutional order flow reversals. This professional-grade tool combines multiple ICT (Inner Circle Trader) strategies to identify optimal entry points.
═══════════════════════════════════════════════════════
📊 KEY FEATURES:
✅ Smart Swing Detection
- Identifies confirmed swing highs and lows using adaptive lookback periods
- Eliminates false signals through double-confirmation logic
- Detects liquidity grabs at key market structure points
✅ Fair Value Gap (FVG) Analysis
- Multi-timeframe FVG detection for enhanced accuracy
- Filters imbalances by minimum size threshold
- Combines current timeframe and higher timeframe FVGs
✅ Advanced Volatility Filter
- ATR-based volatility analysis to avoid low-quality setups
- Adjustable volatility threshold (default 0.35%)
- Ensures entries during optimal market conditions
✅ Precision Signal Generation
- LONG signals: Confirmed swing lows + FVG + volatility confirmation
- SHORT signals: Confirmed swing highs + FVG + volatility confirmation
- Clear visual markers with price labels
✅ Comprehensive Alert System
- Three alert types: Simple, Detailed, JSON (for webhooks)
- Separate LONG/SHORT alert controls
- Compatible with MT5 integration via webhooks
- TradingView native alertcondition support
✅ Professional Dashboard
- Real-time ATR monitoring
- Volatility percentage display
- FVG status indicator
- Alert status tracker
═══════════════════════════════════════════════════════
⚙️ CUSTOMIZABLE PARAMETERS:
🔹 Lookback Swing (1-50): Defines swing detection sensitivity
🔹 ATR Multiplier: Controls wick filter strength
🔹 Volatility Filter: Minimum required market volatility (%)
🔹 FVG Filter: Minimum fair value gap size (%)
🔹 FVG Timeframe: Higher timeframe for multi-TF analysis
🔹 Visual Options: Toggle swing marks, FVG zones, labels
🔹 Alert Controls: Enable/disable LONG/SHORT notifications
═══════════════════════════════════════════════════════
📈 HOW IT WORKS:
1. The indicator scans for confirmed swing points using a robust double-confirmation algorithm
2. Simultaneously analyzes Fair Value Gaps on both current and higher timeframes
3. Validates market volatility to ensure sufficient price movement
4. Generates precise entry signals when all conditions align
5. Triggers customizable alerts for instant notification
═══════════════════════════════════════════════════════
🎯 BEST PRACTICES:
- Use on liquid markets (Forex majors, indices, crypto)
- Recommended timeframes: 15m, 1H, 4H
- Combine with support/resistance for confirmation
- Adjust lookback period based on market volatility
- Test alert settings before live trading
- Use JSON alerts for automated trading integration
═══════════════════════════════════════════════════════
⚡ ALERT CONFIGURATION:
1. Click the Alert icon (bell) in TradingView
2. Select "Liquidity Swap Detector Ultimate - TITAN v6"
3. Choose your preferred alert condition:
- LONG Signal: Only bullish setups
- SHORT Signal: Only bearish setups
- ANY Signal: All trading opportunities
4. Set expiration and notification preferences
5. For MT5 integration: Select "JSON" message type and configure webhook URL

Hidden Impulse═══════════════════════════════════════════════════════════════════
HIDDEN IMPULSE - Multi-Timeframe Momentum Detection System
═══════════════════════════════════════════════════════════════════
OVERVIEW
Hidden Impulse is an advanced momentum oscillator that combines the Schaff Trend Cycle (STC) and Force Index into a comprehensive multi-timeframe trading system. Unlike standard implementations of these indicators, this script introduces three distinct trading setups with specific entry conditions, multi-timeframe confirmation, and trend filtering.
═══════════════════════════════════════════════════════════════════
ORIGINALITY & KEY FEATURES
This indicator is original in the following ways:
1. DUAL-TIMEFRAME STC ANALYSIS
Standard STC implementations work on a single timeframe. This script
simultaneously analyzes STC on both your trading timeframe and a higher
timeframe, providing trend context and filtering out low-probability signals.
2. FORCE INDEX INTEGRATION
The script combines STC with Force Index (volume-weighted price momentum)
to confirm the strength behind price moves. This combination helps identify
when momentum shifts are backed by genuine buying/selling pressure.
3. THREE DISTINCT TRADING SETUPS
Rather than generic overbought/oversold signals, the indicator provides
three specific, rule-based setups:
- Setup A: Classic trend-following entries with multi-timeframe confirmation
- Setup B: Divergence-based reversal entries (highest probability)
- Setup C: Mean-reversion bounce trades at extreme levels
4. INTELLIGENT FILTERING
All signals are filtered through:
- 50 EMA trend direction (prevents counter-trend trades)
- Higher timeframe STC alignment (ensures macro trend agreement)
- Force Index confirmation (validates volume support)
═══════════════════════════════════════════════════════════════════
HOW IT WORKS - TECHNICAL EXPLANATION
SCHAFF TREND CYCLE (STC) CALCULATION:
The STC is a cyclical oscillator that combines MACD concepts with stochastic
smoothing to create earlier and smoother trend signals.
Step 1: Calculate MACD
- Fast MA = EMA(close, Length1) — default 23
- Slow MA = EMA(close, Length2) — default 50
- MACD Line = Fast MA - Slow MA
Step 2: First Stochastic Smoothing
- Apply stochastic calculation to MACD
- Stoch1 = 100 × (MACD - Lowest(MACD, Smoothing)) / (Highest(MACD, Smoothing) - Lowest(MACD, Smoothing))
- Smooth result with EMA(Stoch1, Smoothing) — default 10
Step 3: Second Stochastic Smoothing
- Apply stochastic calculation again to the smoothed stochastic
- This creates the final STC value between 0-100
The dual stochastic smoothing makes STC more responsive than MACD while
being smoother than traditional stochastics.
FORCE INDEX CALCULATION:
Force Index measures the power behind price movements by incorporating volume:
Force Raw = (Close - Close ) × Volume
Force Index = EMA(Force Raw, Period) — default 13
Interpretation:
- Positive Force Index = Buying pressure (bulls in control)
- Negative Force Index = Selling pressure (bears in control)
- Force Index crossing zero = Momentum shift
- Divergences with price = Weakening momentum (reversal signal)
TREND FILTER:
A 50-period EMA serves as the trend filter:
- Price above EMA50 = Uptrend → Only LONG signals allowed
- Price below EMA50 = Downtrend → Only SHORT signals allowed
This prevents counter-trend trading which accounts for most losing trades.
═══════════════════════════════════════════════════════════════════
THE THREE TRADING SETUPS - DETAILED
SETUP A: CLASSIC MOMENTUM ENTRY
Concept: Enter when STC exits oversold/overbought zones with trend confirmation
LONG CONDITIONS:
1. Higher timeframe STC > 25 (macro trend is up)
2. Primary timeframe STC crosses above 25 (momentum turning up)
3. Force Index crosses above 0 OR already positive (volume confirms)
4. Price above 50 EMA (local trend is up)
SHORT CONDITIONS:
1. Higher timeframe STC < 75 (macro trend is down)
2. Primary timeframe STC crosses below 75 (momentum turning down)
3. Force Index crosses below 0 OR already negative (volume confirms)
4. Price below 50 EMA (local trend is down)
Best for: Trending markets, continuation trades
Win rate: Moderate (60-65%)
Risk/Reward: 1:2 to 1:3
───────────────────────────────────────────────────────────────────
SETUP B: DIVERGENCE REVERSAL (HIGHEST PROBABILITY)
Concept: Identify exhaustion points where price makes new extremes but
momentum (Force Index) fails to confirm
BULLISH DIVERGENCE:
1. Price makes a lower low (LL) over 10 bars
2. Force Index makes a higher low (HL) — refuses to follow price down
3. STC is below 25 (oversold condition)
Trigger: STC starts rising AND Force Index crosses above zero
BEARISH DIVERGENCE:
1. Price makes a higher high (HH) over 10 bars
2. Force Index makes a lower high (LH) — refuses to follow price up
3. STC is above 75 (overbought condition)
Trigger: STC starts falling AND Force Index crosses below zero
Why this works: Divergences signal that the current trend is losing steam.
When volume (Force Index) doesn't confirm new price extremes, a reversal
is likely.
Best for: Reversal trading, range-bound markets
Win rate: High (70-75%)
Risk/Reward: 1:3 to 1:5
───────────────────────────────────────────────────────────────────
SETUP C: QUICK BOUNCE AT EXTREMES
Concept: Catch rapid mean-reversion moves when price touches EMA50 in
extreme STC zones
LONG CONDITIONS:
1. Price touches 50 EMA from above (pullback in uptrend)
2. STC < 15 (extreme oversold)
3. Force Index > 0 (buyers stepping in)
SHORT CONDITIONS:
1. Price touches 50 EMA from below (pullback in downtrend)
2. STC > 85 (extreme overbought)
3. Force Index < 0 (sellers stepping in)
Best for: Scalping, quick mean-reversion trades
Win rate: Moderate (55-60%)
Risk/Reward: 1:1 to 1:2
Note: Use tighter stops and quick profit-taking
═══════════════════════════════════════════════════════════════════
HOW TO USE THE INDICATOR
STEP 1: CONFIGURE TIMEFRAMES
Primary Timeframe (STC - Primary Timeframe):
- Leave empty to use your current chart timeframe
- This is where you'll take trades
Higher Timeframe (STC - Higher Timeframe):
- Default: 30 minutes
- Recommended ratios:
* 5min chart → 30min higher TF
* 15min chart → 1H higher TF
* 1H chart → 4H higher TF
* Daily chart → Weekly higher TF
───────────────────────────────────────────────────────────────────
STEP 2: ADJUST STC PARAMETERS FOR YOUR MARKET
Default (23/50/10) works well for stocks and forex, but adjust for:
CRYPTO (volatile):
- Length 1: 15
- Length 2: 35
- Smoothing: 8
(Faster response for rapid price movements)
STOCKS (standard):
- Length 1: 23
- Length 2: 50
- Smoothing: 10
(Balanced settings)
FOREX MAJORS (slower):
- Length 1: 30
- Length 2: 60
- Smoothing: 12
(Filters out noise in 24/7 markets)
───────────────────────────────────────────────────────────────────
STEP 3: ENABLE YOUR PREFERRED SETUPS
Toggle setups based on your trading style:
Conservative Trader:
✓ Setup B (Divergence) — highest win rate
✗ Setup A (Classic) — only in strong trends
✗ Setup C (Bounce) — too aggressive
Trend Trader:
✓ Setup A (Classic) — primary signals
✓ Setup B (Divergence) — for entries on pullbacks
✗ Setup C (Bounce) — not suitable for trending
Scalper:
✓ Setup C (Bounce) — quick in-and-out
✓ Setup B (Divergence) — high probability scalps
✗ Setup A (Classic) — too slow
───────────────────────────────────────────────────────────────────
STEP 4: READ THE SIGNALS
ON THE CHART:
Labels appear when conditions are met:
Green labels:
- "LONG A" — Setup A long entry
- "LONG B DIV" — Setup B divergence long (best signal)
- "LONG C" — Setup C bounce long
Red labels:
- "SHORT A" — Setup A short entry
- "SHORT B DIV" — Setup B divergence short (best signal)
- "SHORT C" — Setup C bounce short
IN THE INDICATOR PANEL (bottom):
- Blue line = Primary timeframe STC
- Orange dots = Higher timeframe STC (optional)
- Green/Red bars = Force Index histogram
- Dashed lines at 25/75 = Entry/Exit zones
- Background shading = Oversold (green) / Overbought (red)
INFO TABLE (top-right corner):
Shows real-time status:
- STC values for both timeframes
- Force Index direction
- Price position vs EMA
- Current trend direction
- Active signal type
═══════════════════════════════════════════════════════════════════
TRADING STRATEGY & RISK MANAGEMENT
ENTRY RULES:
Priority ranking (best to worst):
1st: Setup B (Divergence) — wait for these
2nd: Setup A (Classic) — in confirmed trends only
3rd: Setup C (Bounce) — scalping only
Confirmation checklist before entry:
☑ Signal label appears on chart
☑ TREND in info table matches signal direction
☑ Higher timeframe STC aligned (check orange dots or table)
☑ Force Index confirming (check histogram color)
───────────────────────────────────────────────────────────────────
STOP LOSS PLACEMENT:
Setup A (Classic):
- LONG: Below recent swing low
- SHORT: Above recent swing high
- Typical: 1-2 ATR distance
Setup B (Divergence):
- LONG: Below the divergence low
- SHORT: Above the divergence high
- Typical: 0.5-1.5 ATR distance
Setup C (Bounce):
- LONG: 5-10 pips below EMA50
- SHORT: 5-10 pips above EMA50
- Typical: 0.3-0.8 ATR distance
───────────────────────────────────────────────────────────────────
TAKE PROFIT TARGETS:
Conservative approach:
- Exit when STC reaches opposite level
- LONG: Exit when STC > 75
- SHORT: Exit when STC < 25
Aggressive approach:
- Hold until opposite signal appears
- Trail stop as STC moves in your favor
Partial profits:
- Take 50% at 1:2 risk/reward
- Let remaining 50% run to target
───────────────────────────────────────────────────────────────────
WHAT TO AVOID:
❌ Trading Setup A in sideways/choppy markets
→ Wait for clear trend or use Setup B only
❌ Ignoring higher timeframe STC
→ Always check orange dots align with your direction
❌ Taking signals against the major trend
→ If weekly trend is down, be cautious with longs
❌ Overtrading Setup C
→ Maximum 2-3 bounce trades per session
❌ Trading during low volume periods
→ Force Index becomes unreliable
═══════════════════════════════════════════════════════════════════
ALERTS CONFIGURATION
The indicator includes 8 alert types:
Individual setup alerts:
- "Setup A - LONG" / "Setup A - SHORT"
- "Setup B - DIV LONG" / "Setup B - DIV SHORT" ⭐ recommended
- "Setup C - BOUNCE LONG" / "Setup C - BOUNCE SHORT"
Combined alerts:
- "ANY LONG" — fires on any long signal
- "ANY SHORT" — fires on any short signal
Recommended alert setup:
- Create "Setup B - DIV LONG" and "Setup B - DIV SHORT" alerts
- These are the highest probability signals
- Set "Once Per Bar Close" to avoid false alerts
═══════════════════════════════════════════════════════════════════
VISUALIZATION SETTINGS
Show Labels on Chart:
Toggle on/off the signal labels (green/red)
Disable for cleaner chart once you're familiar with the indicator
Show Higher TF STC:
Toggle the orange dots showing higher timeframe STC
Useful for visual confirmation of multi-timeframe alignment
Info Panel:
Cannot be disabled — always shows current status
Positioned top-right to avoid chart interference
═══════════════════════════════════════════════════════════════════
EXAMPLE TRADE WALKTHROUGH
SETUP B DIVERGENCE LONG EXAMPLE:
1. Market Context:
- Price in downtrend, below 50 EMA
- Multiple lower lows forming
- STC below 25 (oversold)
2. Divergence Formation:
- Price makes new low at $45.20
- Force Index refuses to make new low (higher low forms)
- This indicates selling pressure weakening
3. Signal Trigger:
- STC starts turning up
- Force Index crosses above zero
- Label appears: "LONG B DIV"
4. Trade Execution:
- Entry: $45.50 (current price at signal)
- Stop Loss: $44.80 (below divergence low)
- Target 1: $47.90 (STC reaches 75) — risk/reward 1:3.4
- Target 2: Opposite signal or trail stop
5. Trade Management:
- Price rallies to $47.20
- STC reaches 68 (approaching target zone)
- Take 50% profit, move stop to breakeven
- Exit remaining at $48.10 when STC crosses 75
Result: 3.7R gain
═══════════════════════════════════════════════════════════════════
ADVANCED TIPS
1. MULTI-TIMEFRAME CONFLUENCE
For highest probability trades, wait for:
- Primary TF signal
- Higher TF STC aligned (>25 for longs, <75 for shorts)
- Even higher TF trend in same direction (manual check)
2. VOLUME CONFIRMATION
Watch the Force Index histogram:
- Increasing bar size = Strengthening momentum
- Decreasing bar size = Weakening momentum
- Use this to gauge signal strength
3. AVOID THESE MARKET CONDITIONS
- Major news events (Force Index becomes erratic)
- Market open first 30 minutes (volatility spikes)
- Low liquidity instruments (Force Index unreliable)
- Extreme trending days (wait for pullbacks)
4. COMBINE WITH SUPPORT/RESISTANCE
Best signals occur near:
- Key horizontal levels
- Fibonacci retracements
- Previous day's high/low
- Psychological round numbers
5. SESSION AWARENESS
- Asia session: Use lower timeframes, Setup C works well
- London session: Setup A and B both effective
- New York session: All setups work, highest volume
═══════════════════════════════════════════════════════════════════
INDICATOR WINDOWS LAYOUT
MAIN CHART:
- Price action
- 50 EMA (green/red)
- Signal labels
- Info panel
INDICATOR WINDOW:
- STC oscillator (blue line, 0-100 scale)
- Higher TF STC (orange dots, optional)
- Force Index histogram (green/red bars)
- Reference levels (25, 50, 75)
- Background zones (green oversold, red overbought)
═══════════════════════════════════════════════════════════════════
PERFORMANCE OPTIMIZATION
For best results:
Backtesting:
- Test on your specific instrument and timeframe
- Adjust STC parameters if win rate < 55%
- Record which setup works best for your market
Position Sizing:
- Risk 1-2% per trade
- Setup B can use 2% risk (higher win rate)
- Setup C should use 1% risk (lower win rate)
Trade Frequency:
- Setup B: 2-5 signals per week (be patient)
- Setup A: 5-10 signals per week
- Setup C: 10+ signals per week (scalping)
═══════════════════════════════════════════════════════════════════
CREDITS & REFERENCES
This indicator builds upon established technical analysis concepts:
Schaff Trend Cycle:
- Developed by Doug Schaff (1996)
- Original concept published in Technical Analysis of Stocks & Commodities
- Implementation based on standard STC formula
Force Index:
- Developed by Dr. Alexander Elder
- Described in "Trading for a Living" (1993)
- Classic volume-momentum indicator
The multi-timeframe integration, three-setup system, and specific
entry conditions are original contributions of this indicator.
═══════════════════════════════════════════════════════════════════
DISCLAIMER
This indicator is a technical analysis tool and does not guarantee profits.
Past performance is not indicative of future results. Always:
- Use proper risk management
- Test on demo account first
- Combine with fundamental analysis
- Never risk more than you can afford to lose
═══════════════════════════════════════════════════════════════════
SUPPORT & QUESTIONS
If you find this indicator helpful, please:
- Leave a like and comment
- Share your feedback and results
- Report any bugs or issues
For questions about usage or optimization for specific markets,
feel free to comment below.
═════════════════════════════════════════════════════════════

Trend Alignment TableThe Trend Alignment Table is a clean, visual tool designed to quickly assess trend direction and alignment across multiple moving averages — without cluttering your chart.
Instead of plotting moving average lines, this indicator displays a compact on-chart table showing each selected MA and its corresponding trend status using color-coded circles.
🧩 How It Works
Each circle represents the relationship between price and its corresponding moving average (MA):
Price vs. MA MA Direction Circle Color Meaning
Above Rising 🟢 Green Bullish continuation
Above Falling 🟡 Yellow Weakening bullishness
Below Falling 🔴 Red Bearish continuation
Below Rising 🟡 Yellow Weakening bearishness
⚙️ Features
Up to 4 customizable moving averages
Type: SMA, EMA, SMMA (RMA), WMA, VWMA
Source: Any price source (close, open, etc.)
Length: Fully adjustable
Dynamic color-coded circles (green, yellow, red by default — fully customizable)
User-selectable table position (top-left, top-right, bottom-left, bottom-right)
Clean visual layout for quick multi-timeframe trend confirmation
📊 Use Cases
Instantly identify trend alignment across short-, medium-, and long-term averages
Confirm trend strength or weakening momentum
Combine with other indicators or strategies for confirmation signals
🧠 Default Settings
MA Type Length Color
MA #1 SMA 5 Green
MA #2 SMA 20 Gold
MA #3 SMA 50 Orange
MA #4 SMA 150 Red
🧰 Created for traders who value clarity.
Whether you trade trends, reversals, or momentum shifts, the Trend Alignment Table gives you a concise, at-a-glance view of the market’s directional structure.
