Aligned Moving Average IndexMoving averages are considered as aligned when either all faster moving averages are placed above their next slower moving averages or all faster moving averages are placed below their next slower moving averages. In this script, we are considering moving averages of 5, 10, 20, 30, 50, 100 and 200. User can select different moving average types from input : sma, ema, hma, rma, vwma, wma.
Moving average is considered as positively aligned when close > ma5 > ma10 > ma20 > ma30 > ma50 > ma100 > ma200
Moving average is considered as negatively aligned when close < ma5 < ma10 < ma20 < ma30 < ma50 < ma100 < ma200
Whenever there is positively aligned moving average, alignment value is considered as +1 and whenever there is negatively aligned moving average, alignment value is considered as -1. Aligned moving average index is sum of n periods of alignment value.
We can optionally apply another moving average on this index to see the overall direction.
"科创50和科创100区别" için komut dosyalarını ara
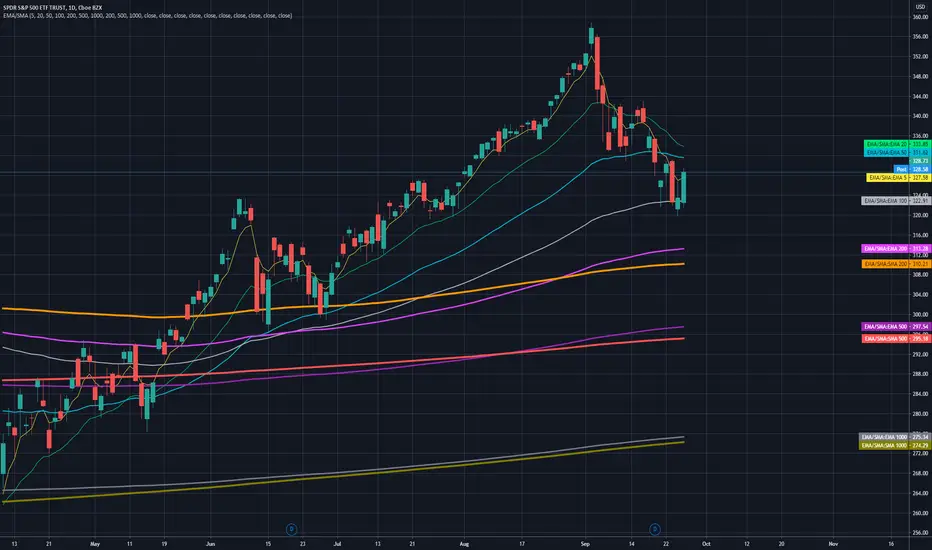
7 EMA 3 SMA with nameplatesScript provides 7 EMA (5 20 50 100 200 500 1000), 3 SMA (200 500 1000) with built-in nameplates for easier navigation. Different colors and widths from the start just to make your initial tuning a bit easier.
Based on Bubsan and Silkheat multicombo, heavily modified, but still huge kudos to guys for the base code.
Modifications: lengths adjusted, on-chart nameplates added, 2 EMA's added, SMA's reduced, static SMA's deleted.
Multi timeframes 4 SMA'sThis script gives you the possibility to fastly plot 4 SMA's (défault 20, 50, 100 and 200 periods) in the actual TimeFrame and for 4 others timeframes.
In fact, when you're in lower timeframes, you may want to see where highers TF SMA's are without always changing the TF of the chart. This script was created for that.
It's really simply to use, by default only 4 SMA's of the present timeframe are ploted. If you want to check the higher TF SMA's, just tick the lines in the script parameters.
No strategy here, only trying to faster the use of indicators by changing parameters on multiple MA in the same time.
Don't hesitate to leave a comment if you have ideas to improve the script.
Enjoy !

FisherThe Fisher Transform Indicator was created by John Ehlers and the beauty of this indicator is that it provides sharp and clear turning points that are also very early
Histogram to see is the momentum is strong or weak.
Buy when the indicator cross under 0 line and sell when the indicator cross above 0.
Good to use with ema 50-100-200 for trend confirmation and use indicator for entry points.

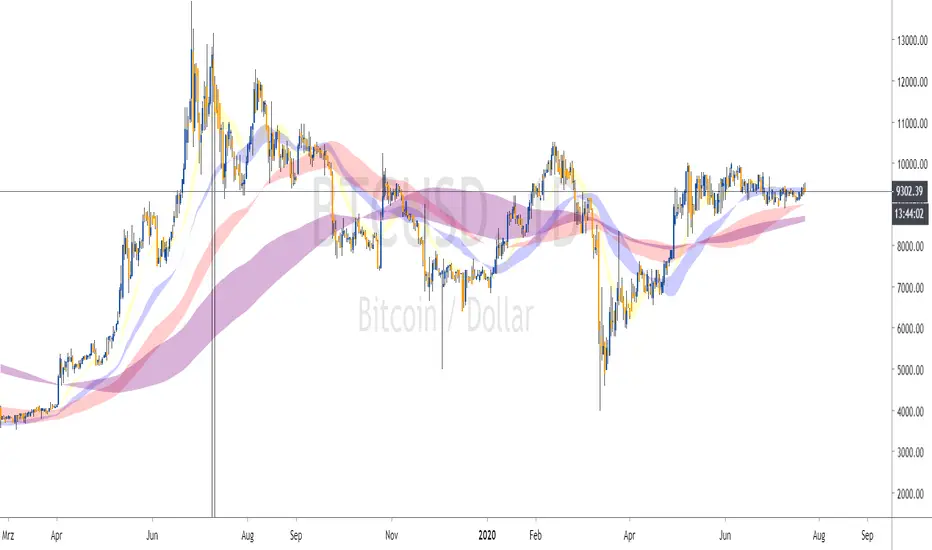
Hyper Frame Fibo MA RibbonsIntroduction
Moving averages are an integral part of the TA world. There are different types of moving averages and each person uses them depending on their strategy and market conditions.
Meanwhile, the main variable in calculating the averages is their LENGTH. This value is optional, but not every value is applicable.
After much experience in the world of financial markets, I came to the conclusion that although the most popular length values are 20, 50, 100, and 200, the Fibonacci number come with surprising results .
Description
The following script calculates seven averages with the length of Fibonacci numbers (34, 55, 89, 144, 233, 377 and 610) with the formula of your choice (SMA, EMA, WMA, HMA) and shows that we named it FiboMa .
You can also have Bollinger Bands with the desired frame at the same time.
This is not the whole story...
You can see the same values from smaller or larger frames at the same time!
We named this feature Hyper Frame Vision .
It is possible to display values for FiboMa up to three hyper frames (with the main frame a total of 4 levels) and in the Bollinger Bands one hyper frame (with the main frame a total of 2 levels).
By default, the display of FiboMa hyper frame values is limited to the last 10 bars, which you can change to an arbitrary value by changing the source code.
The display of hyper frame values is not limited for Bollinger Band.
What is its use? What is it good for?
Support and Resistance
Using dynamic support / resistance is much smarter than static! This protects you from the risk of many fake breaks, and your profit and loss limits will be more flexible and more efficient.
The intersection of FiboMa ribbons are potential points of support / resistance.
We use colors to easily identify supports / resistances.
Any average lower than the price is assumed as support and displayed in green, and any average above the price is assumed as resistance so displayed in red.
So the color of the averages is dynamic.
The color of FiboMa is a range from red to green. Whatever colors get saturated , the lenght is longer and the more power it has as support / resistance.
Volatility
With this script, you also have the ability to monitor the amount of market volatility ! The combination of Bollinger Bands and FiboMa provides a clear view of the market volatility.
The decrease and compression of the FiboMa width is a sign of a decrease in volatility and vice versa.
Trend
I don't see the need for additional explanation, only whenever the price is higher than the middle band , the BB cloud is green , and whenever it is lower , is red .
The wider FiboMa means the stronger trend.
How to use
In the script settings you have the ability to enable or disable anything except.
---------------------------------------------
Similar scripts have been published before and we were inspired by them and tried to improve idea and code uniqe one.
I hope it will be useful .. Support us with your likes and comments .. We have anothers great script .. Just started.

MetalBee Moving Average Set
5 moving average set, consisting of:
9 day simple moving average - provides short-term sentiment
20, 50, 100, 200 day exponential moving - provides entry/exit signals as per standard moving average strategies
I've consolidated this set as this is what I like to use and this consolidates the averages into one indicator.
Original source code obtained from krogsgard and customised to suit personal preferences

All EMA & MA in onDas Script zeigt EMA sowie MA 21, 50 ,100, 200
Es sind alle Farben einstellbar sowie die bereiche zwischen EMA und MA als Zone einfärbbar.

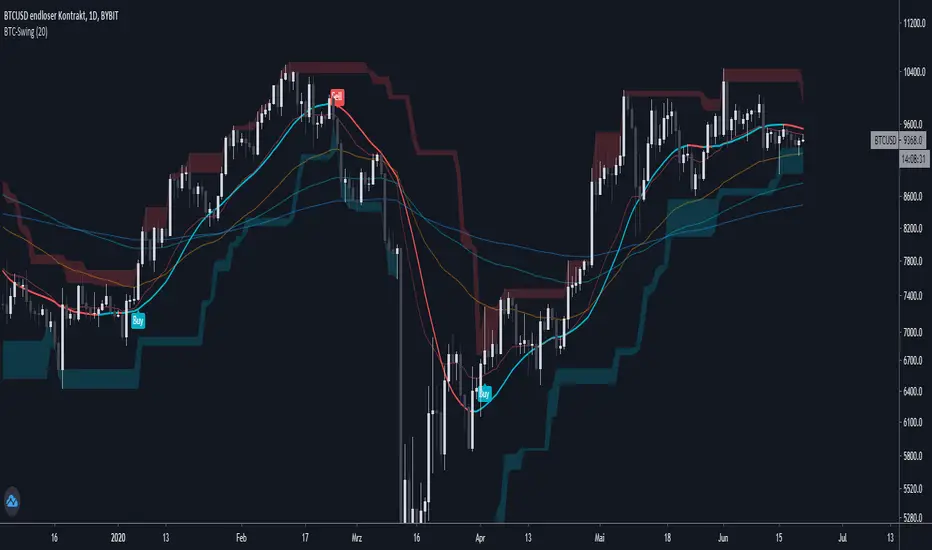
BTC-SwingScript is based on SuperRange - evo @EvoCrypto
It's based on highest and lowest candle close from a few bars back.
Removed + added some minor stuff, added alerts and signals
dded a signal line (ALMA)
added options to display EMA 20/50/100/200
use higher timeframe (1D)
HTF Candlestick Patterns [TradingView] vX by DGTCandlesticks are graphical representations of price movements for a given period of time. They are commonly formed by the opening, high, low, and closing prices of a financial instrument. They have their origins in the centuries-old Japanese rice trade and have made their way into modern day price charting.
It’s important to note that candlestick patterns aren’t necessarily a buy or sell signal by themselves. They are instead a way to look at market structure and a potential indication of an upcoming opportunity. It is always useful to look at candlestick patterns in context like any other market analysis tool and candlestick patterns are most useful when used in combination with other techniques. There are countless candlestick patterns that traders can use to identify areas of interest on a chart, where some candlestick patterns may provide insights into the balance between buyers and sellers, others may indicate a reversal, continuation, or indecision.
Reversal patterns are quite useful when used in context. Reversal patterns should form at the bottom of a downtrend or at the top of an uptrend. Otherwise, they are not a reversal patterns, but continuation patterns. Most reversal patterns require confirmation such as price move in the direction of reversal accompanied by appropriate trading volume. The reversal patterns can further be confirmed through other means of traditional technical analysis—like trend lines, momentum, oscillators, or volume indicators—to reaffirm buying or selling pressure. The patterns themselves do not guarantee that the trend will reverse. Investors should always confirm reversal by the subsequent price action before initiating a trade.
This study implements some of the most commonly used candlestick patterns in a context with directional movement indicator. On request users can adjust the strong trend threshold from dialog box, eighter can disabled correlation with directional movement indicator. To add additional sight to analysis the simple moving averages of 20, 50, 100 and 200 periods are added (configurable)
You may add additional indicators of your choice. Colored DMI, BB Cloud or Price Distance to its MAs may help
Enjoy it!
Disclaimer: The script is for informational and educational purposes only. Use of the script does not constitutes professional and/or financial advice. You alone the sole responsibility of evaluating the script output and risks associated with the use of the script. In exchange for using the script, you agree not to hold dgtrd tradingview user liable for any possible claim for damages arising from any decision you make based on use of the script

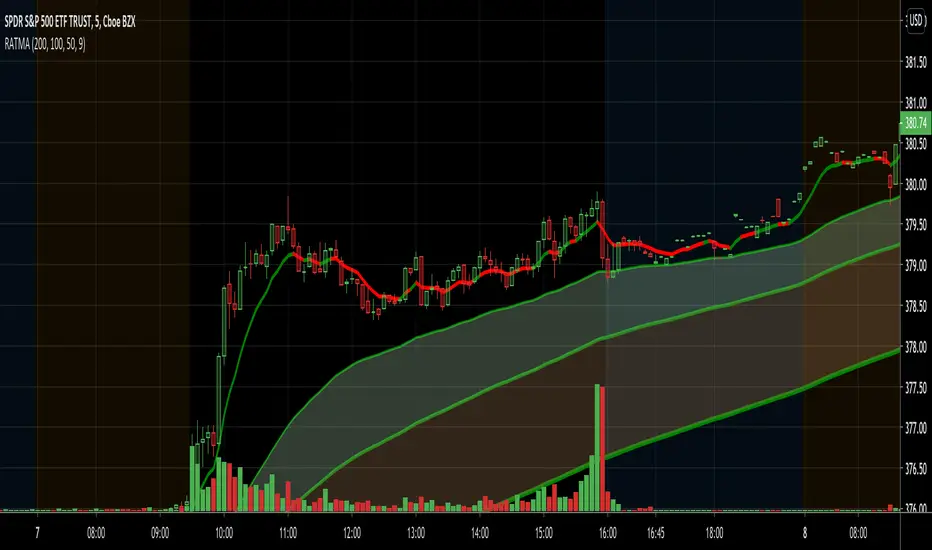
RAT Momentum Squeeze BETAV1.0
MAs are a great tool to measure the market's momentum. I created this indicator to graphically depict bullish and banishment movements with the moving averages.
Using the 50, 100, & 200 day MA in conjunction with the RSI we are able to find great swing setups. This is used best on the 30min & up to the daily chart.
Hello VWAP "Beta"This is my 1st indicator, and my attention is to plot the VWAP "Volume-weighted average price" using the SMA "Simple Moving Average" over time... IE over the last 50,100,200 bars and just the VWAP... All of them in just one line... I have made it when I have been using the BTC/US chart, but it should work for stocks/forex or any other chart that you want to use...
I am not completely sure about this indicator and I do want to add more to this, that is how come I am posting to the community to show what I have done and people can use it and if they are open to it give me feedback or tips to make it better...
Happy trading...

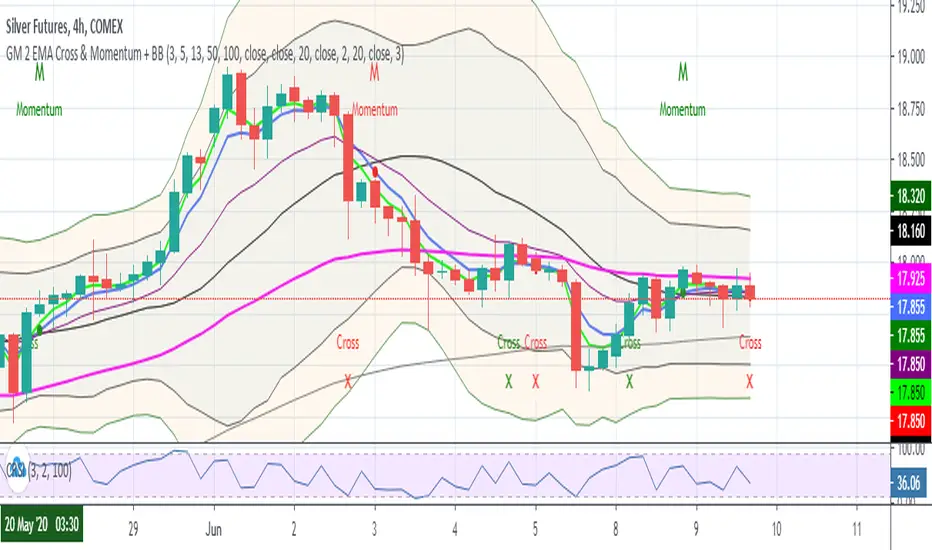
GM 2 EMA Cross + BBScript for seeing the below EMAs
3
5
13
50
100
This also plots a red cross when -ve crossover of 3 by 5 EMA & green cross when +ve crossover of 3 by 5 EMA
Bollinger Bands
2
3
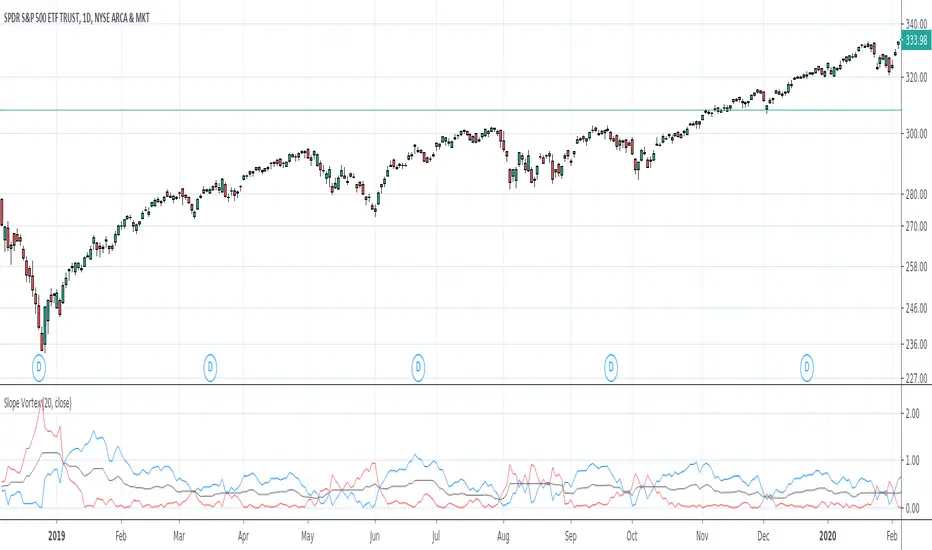
Slope VortexI stumbled upon creating this and thought it was cool and worth sharing. If anyone has ever dabbled with the Aroon or Vortex Indicators, there is some similarity to how it can be used visually.
The indicator basically takes two slopes from the trailing time period you indicate- one from the highest point in that time period, and one from the lowest point. It then plots both.
Here are some of the ways I think this indicator can be used--
Crossover This is the most obvious way, visually. If the blue line crosses under the red, an uptrend has ended or is testing support here. The opposite can be used as well. When the blue line crosses above the red an uptrend is starting or it is testing resistance.
Trending or Ranging If the two bands are moving away from each other/increasing the width between them, there is definite trending action going on. If the two are very narrow or keep crossing each other, whatever symbol you're looking at is likely ranging or consolidating. The black "midpoint" line can also be used to help identify-- if this line is moving up, regardless of if the blue or red band is above, the trend has momentum; if it is going down or flat the previous trend is either slowing greatly or we are ranging.
Support & Resistance Crosses can identify meaningful support and resistance. Having both lines kiss or get very close to the black midpoint line but not cross can also indicate S/R or confirm trend strength.
Here are some snippets of examples I outlined-
I purposely kept this indicator as clean and simple as possible for publication. But I already have tinkered around with taking the output and putting it through the likes of RSI, Stoch, etc. and I think the outcomes are pretty intriguing as well for something so simple. I think dropping the length too much makes it too noisy, so 20, 50, 100 look most useful.
EMA 5/15/50/100/150/200 Strategy Alert By BDStrategy warns with minor alert conditions for the user. T-Do not trust just buy signal Confirm with MACD. EMA values are selectable optional for the user.Thanks to Nezir for his helps.

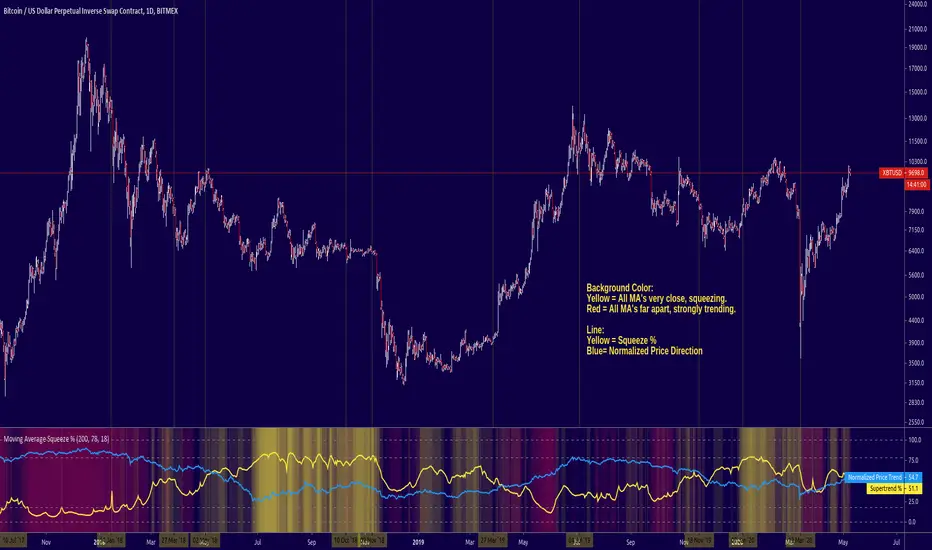
Moving Average Squeeze %A new indicator for you guys to try out, it measured the squeeze % of several MA's and combines them in a super trend-% (where 0 is low squeeze and 100% is where all MA's are crossing on same price)
You can use different period lengths and enable the composite-% for display if you want to see all the data that makes up the super trend.
The indicator uses the 10, 20, 50, 100, and 200 SMA.

Triple SMA/EMAThis indicator displays the 50, 100 and 200 period SMA and EMA and shades the area between the corresponding SMAs and EMAs

Ribbon_Arshiin this indicator
moving average 20-25-30-35-40-50-100-200 with fractal added to the chart.

7/20EMA 50/100/200SMAsThese are approximately the same moving averages shown in the E-book "The candlestick trading bible"

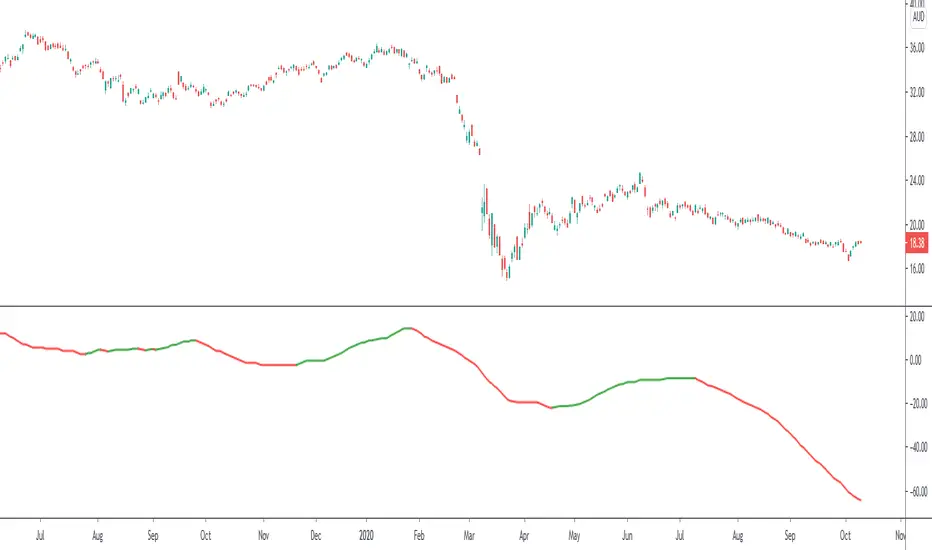
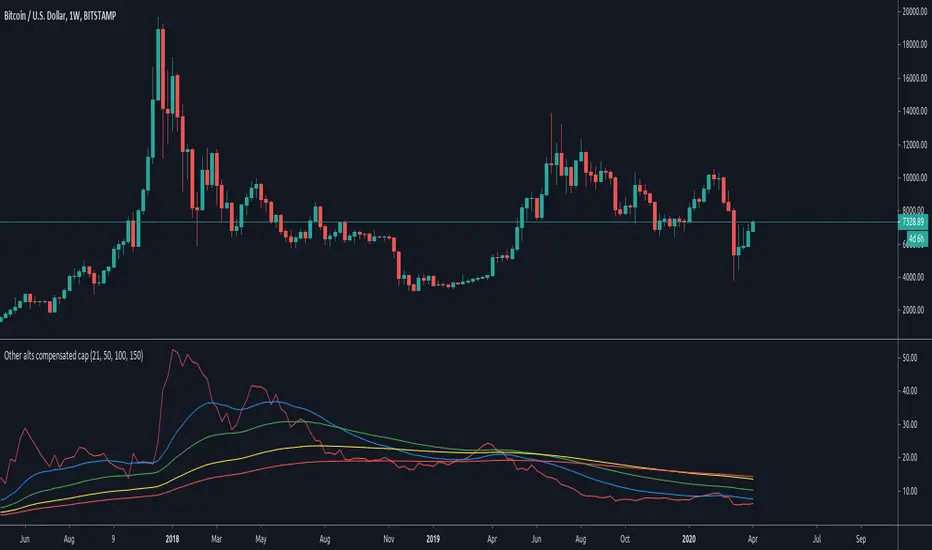
Other alts compensated capitalization [Peregringlk]DISCLAIMER: I'm not a native English speaker, so let me know please about mistakes in my wording.
Introduction
==========
This indicator (the middle one in the image) shows how the "others altcoins" (all altcoins except coins with high capitalization) are adding own value to its capitalization by removing BTC price changes. By "own value" I mean USD value gaining by actual buys in BTC markets beyong arbitrage effects of BTC price changes.
The main idea is that, if bitcoin has increased is value by 20%, and the other altcoins has increased its capitalization by 30%, the chart will only plot an increased of 10%. In other words, it will show its increased capitalization measured in BTC (the combined altcoin/BTC market is uptrending). Its purpose is to try to identify altseasons. A bit more concisely, the graph will only grow when both USD and BTC capitalization are growing. If any of them are going down, the graph will go down as well.
Rationale
========
- Altseasons are characterized by an incresed in BTC value of almost every altcoin during some period of time, although not all at once, but distributed over the altseason. For example, in the crazy altseason of Dec17/Jan18, almost every (low capitalized) altcoin increased its BTC value by a minimum of +300%, some at the beginning of the season, some at the end.
- When this happens, BTC loss capitalization dominance, but this also can happen if BTC is downtrending while altcoins are being bought in BTC markets but its USD value doesn't change too much. This happens when altcoins are uptrending in BTC price, but there are actually no gain of USD value because the BTC gain in value is not enough to compensate the BTC fall in price. Since BTC is losing USD price, but altcoins are not, dominance falls. So, looking at BTC dominance is not enough to spot possible beginnings of altseasons, because of arbitrage of other effects.
- The "big altcoins" are removed from the counting because one single big capitalized altcoin that grows, let's say, a 20%, will have an observable effect on the total altcoin capitalization, even if the rest of the altcoins are stagnated in price. For example, at today's date (8th April 2020), Ethereum by itself has the 23.89% of the total altcoins capitalization. A +10% in Ethereum price will increase the total altcoin capitalization by a +2.38%. I wanted to remove that effect to focus on generalized price changes of all altcoins. Remember that there are only 9 big altcoins 9 coins representing the 71% of the alts capitalization, while there are exists more than 5000 altcoins in total.
- Another key factor is that I want to focus on what happens in alt/BTC markets, because almost every altcoin can be traded against BTC, and most of them can only be traded against BTC. However, big altcoins can usually be traded against USD or other alt coins or fiat currencies as well. Removing the big alts from the equation helps (just a bit) to simplify the interpretation of the chart because arbitrage effects of those "impactfull" alts are limited (although not removed, because arbitrage also happens cross-markets).
- There are situations where BTC price is going up, alts USD capitalization is going up as well, but alts BTC capitalization is going down because altcoins are being sold in BTC markets, it just happens that the speed of the selling is not high enough as to compensated the increased in BTC price. That makes the USD capitalization grows, while alts are really being dumped in BTC markets. I wanted to reflect that effect as well by making sure that the graph is growing only when both USD and BTC capitalization of alts are growing.
Interpretation
============
If you want, you can see this chart as if plotting the Other alts capitalization as if priced against a fictional coin FCOIN, that start by having a price of 1, that combines the up and downs of both BTC price and alts USD capitalization in a very conservative way: if FCOIN price goes up, means that the other alts are gained USD value but only when they have overcome BTC price changes. Otherwise, it goes down.
If this fictional FCOIN has went up during some days straight with a total gain of maybe, greater than 10%, we are maybe in front of the start of an altseason. Sometimes, maybe (it requires some more years to extract a theory out of here), it can be used as proxy of the BTC near future (trend changes or continuations): if this FCOIN goes up, while BTC is doing nothing relevant or even is going down, it could signal that "people" is getting prepared and a generalized altcoin accumulation process has started, because of a combined people's assumption that BTC will start to have an stable uptrend, or will continue the current trend soon. There's some matches in the past about that, but there are also false positives, as usual.
Additionally, four customizable EMAs are added to the script, by default 21, 50, 100 and 150.
Definitions
=========
- Let's call `altcap_btc` the altcoin capitalization in USD, divided by BTC price. In other words, `altcap_btc` is the capitalization in terms of BTC.
- Let's call `x` the BTC price change rate as `btc_price_current_candle / btc_price_previous_candle`. So, if BTC has grown a +20%, `x = 1.20`, and if BTC has gone down a -20%, `x = 0.80`.
- Let's call `y` the `altcap_btc` price change rate, calculated as before but for `altcap_btc`.
- For pure math equivalence, `x * y` is thus the USD capitalization change rate.
Calculation
=========
For plotting the graph, for each candle, I choose a change rate, and then I plot the total accumulated change rate as by `ch0 * ch1 * ch2 * .... * ch_today`, where each `chX` is the choosen change rate of each candle since the beginning of the chart. So, if the "alts compensated value" has grown yesterday +20% and today's -10%, `1.20 * 0.9 = 1.08`, which means that in two days the compensated value has grown an 8% in total.
- If `x * y > 1` (USD cap is growing), I take `y` as change rate (alt/btc change rate).
- If both `x` and `y` are `> 1`, then the graph grows because I'm taking `y`.
- If `x > 1` and `y < 1`, the graph goes down because I'm taking `y`, reflecting the BTC markets are dumping.
- If `x < 1` and `y > 1`, the graph goes up because I'm taking `y`, reflecting the BTC markets are pumping so much that it overcomes the btc fall.
- `x < 1` and `y < 1` is impossible here because `x * y` must be `> 1` by precondition.
- If `x * y < 1` (USD cap is going down), I take `y` or `x * y` depending on the individual change rates:
- If `x` and `y` go in different directions (one up and the other down), I take `x * y` to reflect that USD capitalization has gone down. I don't take `y` here because it could be `> 1`, and I don't want to make the graph grow if alts are lossing USD value. Also, if `y < 1` and I take `y` the graph will go down faster than USD capitalization and I want to show that "alts compensated value is gown down slower than BTC because some boughts are happening". I don't take `x` either here for the same reasons.
- If both `x` and `y` are `< 1`, I take `y`, because otherwise the graph would be less than 0.000001 today after two years of bleeding, making literally impossible to see if alts "grow tomorrow".
- `x > 1` and `y > 1` is impossible here because `x * y` must be `< 1` by precondition.
Custom EMA AngleThis script shows the angle of 6 EMAs to perform trade analysis. The EMA angle is also known as its Rate Of Change ( ROC ). The 6 EMAs (I, II, III , IV, V and VI ) default lengthes come from one of the Fibonacci Phi^3 and Phi^3/2 sub series (17, 34, 72, 144, 305 and 610), but can be changed to any values, particularly to the traditionally used 20, 40, 50, 100, 200 and 300. Up to my knowledge, Fibonacci Phi^3 and Phi^3/2 sub series lengthes were first proposed by Bo Williams.
Angle calculation is performed by calculating the tangent over a delta interval. Normalization is required to make the angle independent of the price range.
This script is meant to be used together with the corresponding EMAs on the candle pane. Non normalized view shows a more realistic angle condition but, if intended to be used with the CEMAS indicator, normalized view should be used.

Custom EMA + FIBOThis script combines 6 EMAs with 3 Donchian Channel 78.6% and 21.4% intermediary level lines to perform trade analysis. The 6 EMAs (I, II, III , IV, V and VI ) default lengthes come from one of the Fibonacci Phi^3 and Phi^3/2 sub series (17, 34, 72, 144, 305 and 610), but can be changed to any values, particularly to the traditionally used 20, 40, 50, 100, 200 and 300. Up to my knowledge, Fibonacci Phi^3 and Phi^3/2 sub series lengthes were first proposed by Bo Williams.
The 3 Donchian Channels used have default lengthes 72, 305 and 1292, calculated after the first length default value of 72. For each of the 3 Donchian Channels only an upper line, set by default at 78.6%, is plotted in green and its complement, set to 21.4%, is plotted in red. When the closing price is above 3 green lines, we say it is Forbidden to Sell ( PV ), and when the closing price is below 3 red lines, we say it is Forbidden to Buy ( PC ). Those conditions are flagged on the chart. These PV-PC conditions were, up to my knowledge, first proposed by Bo Williams.
