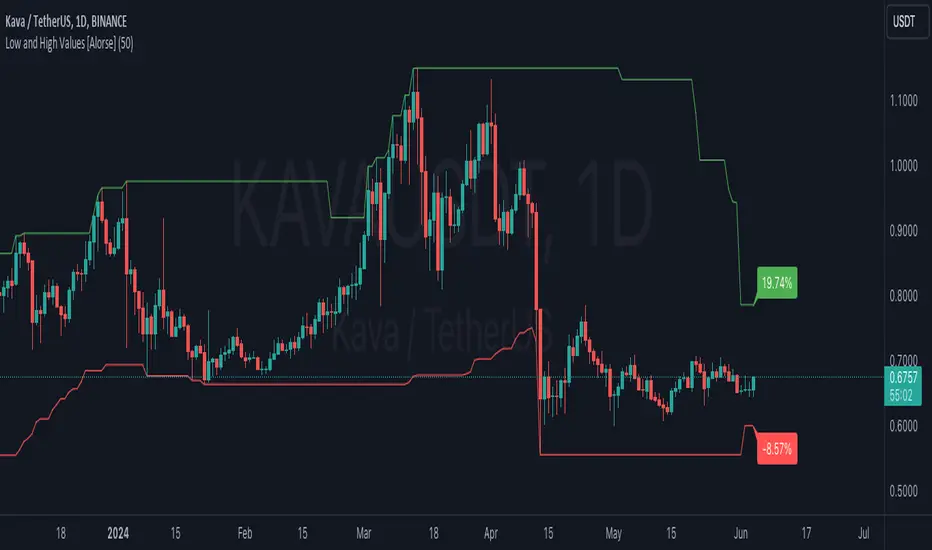
Low and High Values [Alorse]🌟 What does this indicator do?
This magical indicator shows you the lowest (Low) and highest (High) values of the last X candles directly on your chart. Not only that, but it also tells you how much the price has changed from the opening price of the current candle to these key points, all in percentage format. You'll have a clear and precise view of market movement!
🔧 Customize to your liking
Want to adjust the number of candles to consider? No problem! You can easily change this parameter to suit your preference. Whether you like short-term strategies with just a few candles or prefer more extensive analysis with many candles, our indicator adapts to you.
🚀 How can this indicator help you?
Identify Support and Resistance: By showing the lowest and highest points, it helps you identify key support and resistance levels. Perfect for planning your entries and exits!
Trend Analysis: With the percentage labels, you can quickly see how the price has moved relative to recent extremes, helping you confirm trends or anticipate possible reversals.
Trading Strategies: Imagine the price is near a recent low, but the percentage indicates a significant drop from the opening. This could be a buy signal if you expect a rebound. Conversely, if the price is near a recent high with a large percentage increase, you might consider selling.
Calculate Stop Loss: Use this indicator to determine your Stop Loss levels by leaving a bit of margin between the indicator value and your desired SL. This helps protect your positions while allowing for some price fluctuation.
📊 Examples of Use
Intraday Trader: Use the indicator with 10-20 candles to capture quick moves and capitalize on daily fluctuations.
Mid-term Trader: Set the indicator to consider 50 candles for a broader view of trends and reversal points.
Long-term Strategist: Adjust the indicator to 100 candles or more to identify highs and lows over larger time frames.
🛠️ Customizable Parameters
Number of Candles: Define the number of candles the indicator will analyze to calculate the lowest and highest values. It's all up to you!
Komut dosyalarını "用户自选股中各股票的均线排列状态(5日、10日、20日均线)" için ara
Backtest any Indicator v5Happy Trade,
here you get the opportunity to backtest any of your indicators like a strategy without converting them into a strategy. You can choose to go long or go short and detailed time filters. Further more you can set the take profit and stop loss, initial capital, quantity per trade and set the exchange fees. You get an overall result table and even a detailed, scroll-able table with all trades. In the Image 1 you see the provided info tables about all Trades and the Result Summary. Further more every trade is marked by a background color, Labels and Levels. An opening Label with the trade direction and trade number. A closing Label again with the trade number, the trades profit in % and the total amount of $ after all past trades. A green line for the take profit level and a red line for the stop loss.
Image 1
Example
For this description we choose the Stochastic RSI indicator from TradingView as it is. In Image 2 is shown the performance of it with decent settings.
Timeframe=45, BTCUSD, 2023-08-01 - 2023-10-20
Stoch RSI: k=30, d=40, RSI-length=140, stoch-length=140
Backtest any Indicator: input signal=Stoch RSI, goLong, take profit=9.1%, stop loss=2.5%, start capital=1000$, qty=5%, fee=0.1%, no Session Filter
Image 2
Usage
1) You need to know the name of the boolean (or integer) variable of your indicator which hold the buy condition. Lets say that this boolean variable is called BUY. If this BUY variable is not plotted on the chart you simply add the following code line at the end of your pine script.
For boolean (true/false) BUY variables use this:
plot(BUY ? 1:0,'Your buy condition hold in that variable BUY',display = display.data_window)
And in case your script's BUY variable is an integer or float then use instate the following code line:
plot(BUY ,'Your buy condition hold in that variable BUY',display = display.data_window)
2) Probably the name of this BUY variable in your indicator is not BUY. Simply replace in the code line above the BUY with the name of your script's trade condition variable.
3) Save your changed Indicator script.
4) Then add this 'Backtest any Indicator' script to the chart ...
5) and go to the settings of it. Choose under "Settings -> Buy Signal" your Indicator. So in the example above choose .
The form is usually: ' : BUY'. Then you see something like Image 2
6) Decide which trade direction the BUY signal should trigger. A go Long or a go Short by set the hook or not.
Now you have a backtest of your Indicator without converting it into a strategy. You may change the setting of your Indicator to the best results and setup the following strategy settings like Time- and Session Filter, Stop Loss, Take Profit etc. More of it below in the section Settings Menu.
Appereance
In the Image 2 you see on the right side the List of Trades . To scroll down you go into the settings again and decrease the scroll value. So you can see all trades that have happened before. In case there is an open trade you will find it at the last position of the list.
Every Long trade is green back grounded while Short trades are red.
Every trade begins with a label that show goLong or goShort and its number. And ends with another label again with its number, Profit in % and the resulting total amount of cash.
If activated you further see the Take Profit as a green line and the Stop Loss as a orange line. In the settings you can set their percentage above or below the entry price.
You also see the Result Summary below. Here you find the usual stats of a strategy of all closed trades. The profit after total amount of fees , amount of trades, Profit Factor and the total amount of fees .
Settings Menu
In the settings menu you will find the following high-lighted sections. Most of the settings have a question mark on their right side. Move over it with the cursor to read specific explanation.
Input Signal of your Indicator: Under Buy you set the trade signal of your Indicator. And under Target you set the value when a trade should happen. In the Example with the Stochastic RSI above we used 20. Below you can set the trade direction, let it be go short when hooked or go long when unhooked.
Trade Settings & List of Trades: Take Profit set the target price of any trade. Stop Loss set the price to step out when a trade goes the wrong direction. Check mark the List of Trades to see any single trade with their stats. In case that there are more trades as fits in the list you can scroll down the list by decrease the value Scroll .
Time Filter: You can set a Start Time or deactivate it by leave it unhooked. The same with End Time .
Session Filter: here you can choose to activate it on weekly base. Which days of the week should be trading and those without. And also on daily base from which time on and until trade are possible. Outside of all times and sessions there will be no new trades if activated.
Invest Settings: here you can choose the amount of cash to start with. The Quantity percentage define for every trade how much of the cash should be invested and the Fee percentage which have to be payed every trade. Open position and closing position.
Other Announcements
This Backtest script don't use the strategy functions of TradingView. It is programmed as an indicator. All trades get executed at candle closing. This script use the functionality "Indicator-on-Indicator" from TradingView.
Conclusion
So now it is your turn, take your promising indicators and connect it to that Backtest script. With it you get a fast impression of how successful your indicator will trade. You don't have to relay on coders who maybe add cheating code lines. Further more you can check with the Time Filter under which market condition you indicator perform the best or not so well. Also with the Session Filter you can sort out repeating good market conditions for your indicator. Even you can check with the GoShort XOR GoLong check mark the trade signals of you indicator in opposite trade direction with one click. And compare your indicators under the same conditions and get the results just after 2 clicks. Thanks to the in-build fee setting you get an impression how much a 0.1% fee cost you in total.
Cheers

Williams %R with EMA'sThe provided Pine Script code presents a comprehensive technical trading strategy on the TradingView platform, incorporating the Williams %R indicator, exponential moving averages (EMAs), and upper bands for enhanced decision-making. This strategy aims to help traders identify potential buy and sell signals based on various technical indicators, thereby facilitating more informed trading decisions.
The key components of this strategy are as follows:
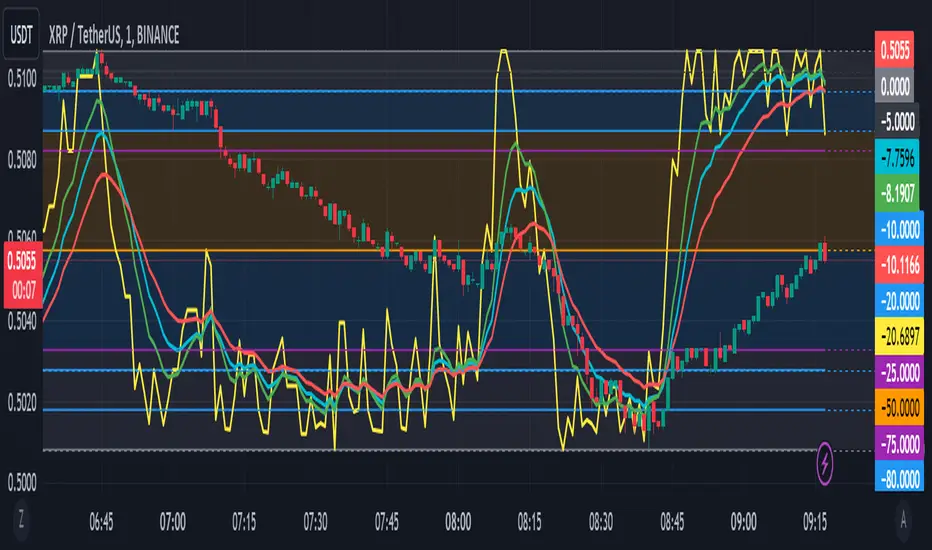
**Williams %R Indicator:** The Williams %R, also known as the "Willy," is a momentum oscillator that measures overbought and oversold conditions. In this code, the Williams %R is calculated with a user-defined period (default 21) and smoothed using an exponential moving average (EMA).
**Exponential Moving Averages (EMAs):** Two EMAs are computed on the Williams %R values. The "Fast" EMA (default 8) responds quickly to price changes, while the "Slow" EMA (default 21) provides a smoother trend-following signal. Crossovers and divergences between these EMAs can indicate potential buy or sell opportunities.
**Candle Color Detection:** The code also tracks the color of candlesticks, distinguishing between green (bullish) and red (bearish) candles. This information is used in conjunction with other indicators to identify specific trading conditions.
**Additional Upper Bands:** The script introduces upper bands at various levels (-5, -10, -20, -25) to create zones for potential buy and sell signals. These bands are visually represented on the chart and can help traders gauge the strength of a trend.
**Alert Conditions:** The code includes several alert conditions that trigger notifications when specific events occur, such as %R crossing certain levels, candle color changes within predefined upper bands, and EMA crossovers.
**Background Highlighting:** The upper bands and the zero line are visually highlighted with different colors, making it easier for traders to identify critical price levels.
This code is valuable for traders seeking a versatile technical strategy that combines multiple indicators to improve trading decisions. By incorporating the Williams %R, EMAs, candlestick analysis, and upper bands, it offers a holistic approach to technical analysis. Traders can customize the parameters to align with their trading preferences and risk tolerance. The use of alerts ensures that traders are promptly notified of potential trade setups, allowing for timely execution and risk management. Overall, this code serves as a valuable tool for traders looking to make more informed decisions in the dynamic world of financial markets.
SMA 10/20/50 by Bull Bear Investing BabyThis script basically is a combination of 3 different simple moving averages line to determine the trend of the assets
The colour indicating which moving averages are as per following:
1) Green- 10MA
2) Red- 20MA
3) Blue- 50MA
When the moving averages are aligned as per following, the trend is indicating towards an uptrend:
---> 10ma > 20ma > 50ma
Likewise when the moving averages are aligned as per following, the trend is indicating towards a downtrend:
---> 10ma < 20ma < 50ma

Parkinson's Historical Volatility Bands [Loxx]Parkinson's Historical Volatility Bands are constructed using:
Average as the middle line.
Upper and lower bands using the Parkinson's historical volatility (instead of "regular" Historical Volatility) for bands calculation.
What is Parkinson's Historical Volatility?
The Parkinson's number, or High Low Range Volatility developed by the physicist, Michael Parkinson in 1980, aims to estimate the Volatility of returns for a random walk using the High and Low in any particular period. IVolatility.com calculates daily Parkinson values. Prices are observed on a fixed time interval: n = 10, 20, 30, 60, 90, 120, 150, 180 days.
SH is stock's High price in t day.
SL is stock's Low price in t day.
High/Low Return (xt^HL) is calculated as the natural logarithm of the ratio of a stock's High price to stock's Low price.
Return:
And Parkinson's number: 1 / (4 * math.log(2)) * 252 / n * Σ (n, t =1) {math.log(Ht/Lt)^2}
An important use of the Parkinson's number is the assessment of the distribution prices during the day as well as a better understanding of the market dynamics. Comparing the Parkinson's number and periodically sampled volatility helps traders understand the tendency towards mean reversion in the market as well as the distribution of stop-losses.
The color of the middle line, unlike the bands colors, has 3 colors. When colors of the bands are the same, then the middle line has the same color, otherwise it's white.
Included
Alerts
Signals
Loxx's Expanded Source Types
Bar coloring

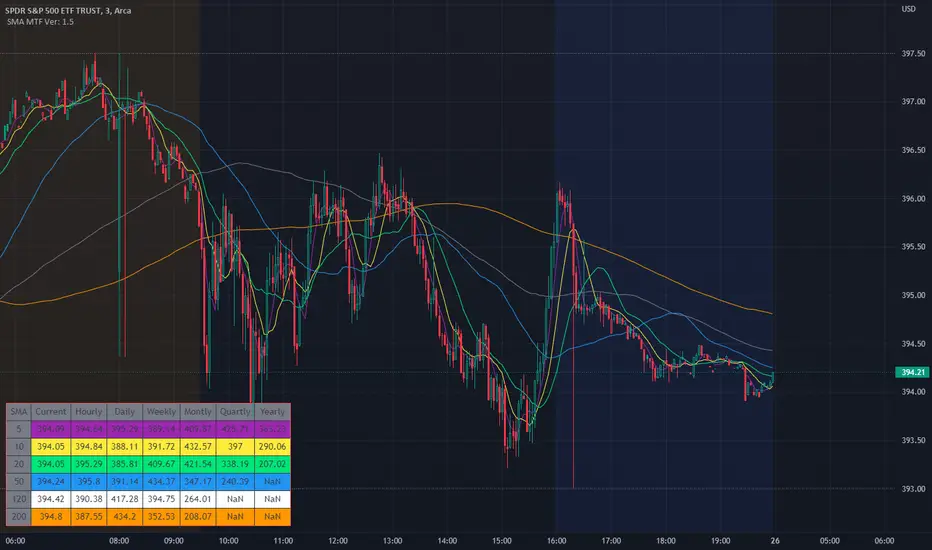
Multiple Moving Avg MTF TableThis script replaces the other script that was just the SMAs that where in a Multi Time Frame Table as this was a redo of that one and this one is SO MUCH MORE!!!!
Not only does this one do the Simple Moving Avg 5, 10, 20, 50, 120, 200 into a table that shows Current/Hourly/Daily/Weekly/Monthly/Quarterly ( 3M )/ Yearly. It now does Exponential Moving Avg , Weighted Moving Avg , and Volume Weight Moving Avg along with Simple Moving Avg.
I still use this script so that you can quickly capture the values so that short-term, and long-term resistance and support can be determined during market hours. Even better now you can select between SMA / EMA / WMA /or VWMA .
imgur.com
The table will change to the values based on the Choice of the type of Moving Avg and if you change the default values.
Now it will take a little bit for the table to show up, so please be patient. I have tested it with stocks, forex, and crypto.

SMA Multi Time Frame Table V1.5Since I couldn't find a script like this I made one so here is what it does.
The script will plot on the chart as well as post the related data into the table.
The default Simple Moving Avg are 5, 10, 20, 50, 120, 200 which can also be changed to whatever SMA you would like. The SMA values are then plotted on the charts so that quickly check to see where they are and how the candles are reacting to the SMAs.
Not only does the script plot the SMAs but it also places higher time frames into the table that is in the script, from current price, to daily, weekly, monthly, quarterly (3 months if you don't have it added) and yearly. The reason why was it price action of the stock does interact and can be rejected or find support from SMA on a higher time frames.
I still use this script so that you can quickly capture the values so that short-term, and long-term resistance and support can be determined during market hours.
Another good thing is that when you change the values in the script settings it also applies those settings to the table as well.
Now it will take a little bit for the table to show up, so please be patient. I have tested it with stocks, forex, and crypto.
I wanted to get this published and I am still working on the background to try and get EMAs. Where you can flip over to EMA to also see the EMA plots and table values for the MTF.
Star niksthis is used with ema macd rsi ema 10/20/30 . you can use in especially in forex and commodity markets

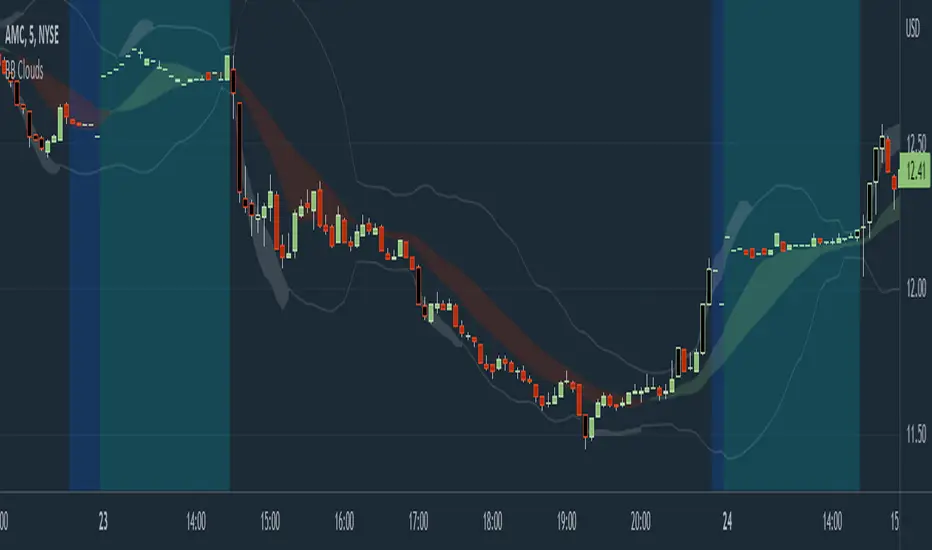
Bollinger Band Clouds [vnhilton]I recommend to turn off 'Labels on price scale' & 'Values in status line' as this indicator's intended use is for visualizing volatility in the form of overextensions & pullbacks only.
Default settings for intraday use - however you can change various settings for your personal use.
Bollinger bands is a volatility indicator which plots X standard deviation bands away from the base moving average. When price isn't volatile, bands are compressed (closer to base moving average), & expand when volatility starts to increase - this makes Bollinger bands a great visual indicator for displaying volatility cycles. Although prices aren't normally distributed (i.e. 2 standard deviation bands won't mean 95% of price will lie within the bands), Bollinger bands can be useful to show strong abnormal trends when price is outside the bands, which can be seen as overextensions & will have to retrace sooner or later, towards the moving averages. Price trends within bands are seen as healthy trends (price grinds fit this description).
This indicator creates clouds (fill) between 2 different moving average standard deviation bands. The idea is to better visualize strong trends/overextensions as the shorter period standard deviation bands will be outside the longer period bands. This indicator also provides bar color changes for when the bar close is outside the longer period standard deviation bands to help illustrate the strong trends/overextensions. The chart snapshot image shows standard deviation clouds for a 10-20 period SMA. This indicator also allows for better visualization on pullbacks to the mean, by giving a MA cloud between the 2 short & long period MAs.
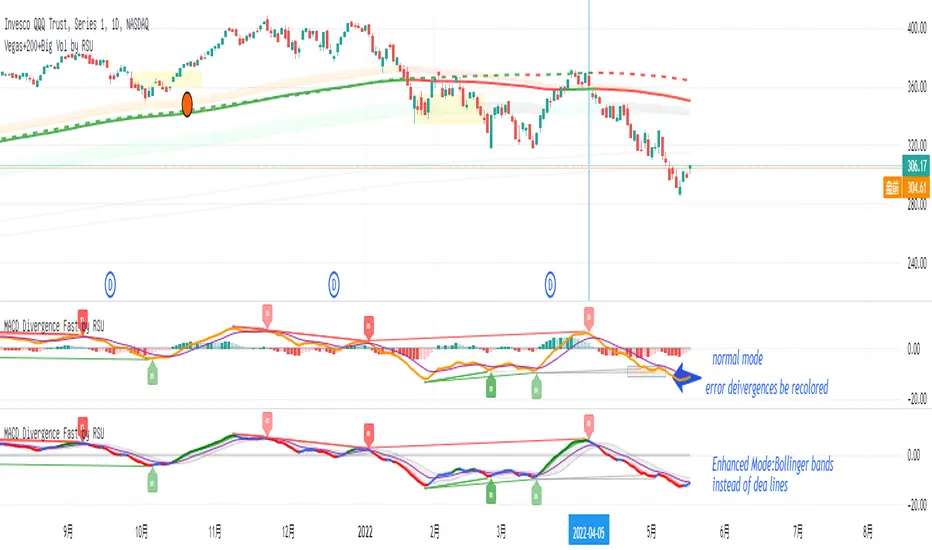
MACD Divergence Fast by RSUAdvantages:
1. When MACD-diff line(orange color) is at a high point, once it falls by 1 k line, it will detect the divergence from the previous high point. This can quickly find the divergence that has taken effect and help you quickly capture the trend before a sharp decline or rise.
2. This indicator detects the previous high and the previous low of 5, 10, 20, 40, 60 lengths at the same time, instead of only detecting a fixed length, so that more divergences can be found.
Notice:
Because it is a quick divergence detection, it is recommended to confirm that the divergence takes effect after the current k is completely closed first. I have identified this state in the indicator as "k not end".
Disadvantages and Risks:
Since it is a quick discovery, there will be error identification. Error divergences will recolor to grey.
Suggestion:
Use “RSI Divergence Fast by RSU” at the same time, because RSI divergence usually occurs before macd, if the position diverges at the same time, the probability of success will increase.
Please do not:
Don't go short in the uptrend, don't go long in the downtrend.
Top divergences that occur because of a strong uptrend are usually only temporary pullbacks. Bottom divergences in persistent declines are also temporary rallies. Do not attempt to trade such low-return trades.
It is recommended to use the divergence indicator when the stock price has made a new high and retraced, and once again made a new high, because this often leads to the end of the trend.
Divergence how to use:
1. After the previous K line was completely closed, a bottom divergence was found.
2. Open an long order at the beginning of the second bar, or as close to the bottom as possible (because the stop loss will be smaller).
3. Break the stop loss price below the previous low where the divergence occurred, which already means that the divergence is wrong.
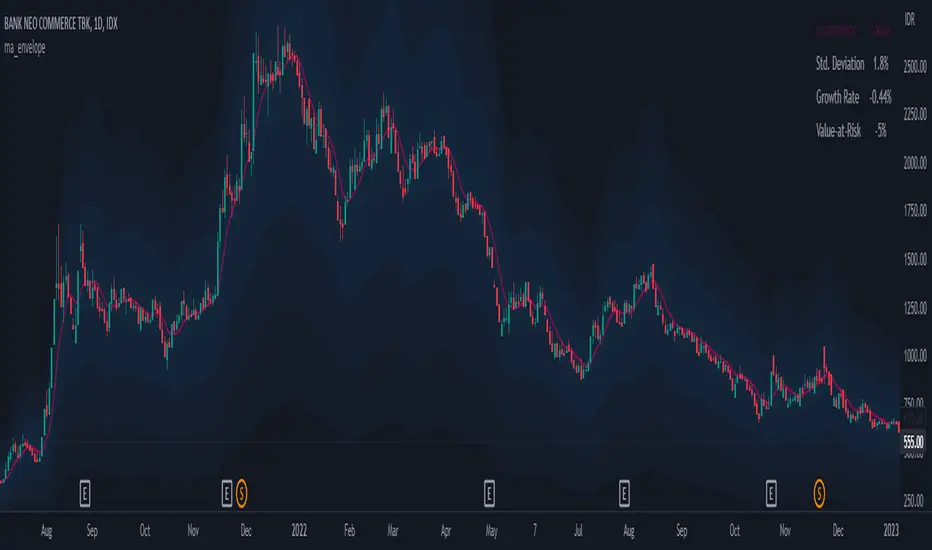
multiple_ma_envelope
Description:
Moving Average is a well-known though simple technical analysis tool, that can be applied in most trading journeys. By adding an envelope (a certain amount above and below the moving averages, cited from Investopedia), the indicator aligned its aim to identify the reversal area i.e. when the price reaches the envelopes, the price tends to have a reverse. In this indicator, the improvement is by adding multiple envelopes at once, thus can identify the further phase of the reverse area when the price apparently continues current direction.
Upper Band = MA * (1 + %envelope)
Lower Band = MA * (1 - %envelope)
Notes:
1). In this indicator, the default value of the moving average utilized is set to 10, 20, 50, 100 respectively
2). The band initial value is set to 0.2, and increases by 0.2 for each increasing MA Length
Feature:
1). Multiple Moving Average Envelope
2). Information Table as displayed Rolling Deviation, Rolling Maximum Drawdown, and Value-at-Risk
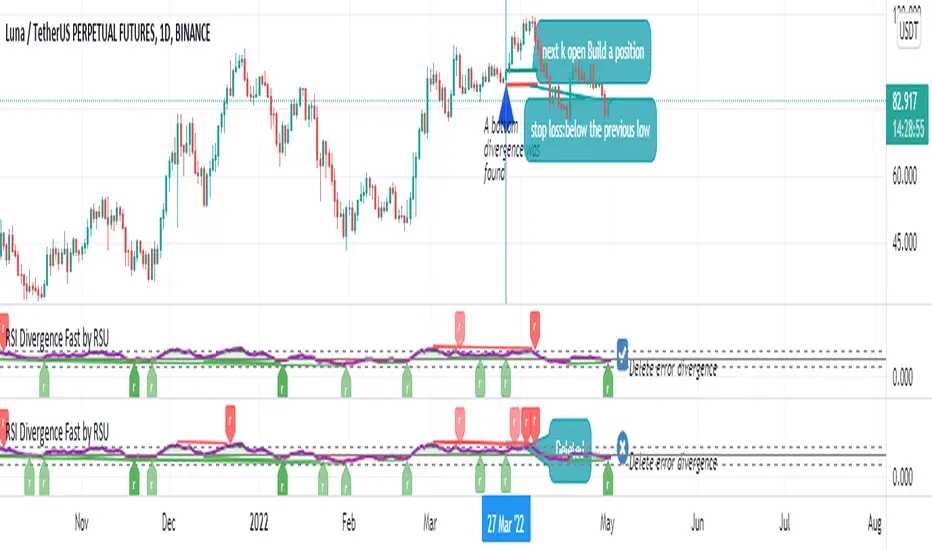
RSI Divergence Fast by RSUAdvantages:
1. When rsi is at a high point, once it falls by 1 k line, it will detect the divergence from the previous high point. This can quickly find the divergence that has taken effect and help you quickly capture the trend before a sharp decline or rise.
The difference between other RSI divergence indicators: the official divergence indicator is to detect the 5 and the k line, which may lead to a large amount of decline.
2. This indicator detects the previous high and the previous low of 5, 10, 20 lengths at the same time, instead of only detecting a fixed length, so that more deviations can be found.
Notice:
Because it is a quick divergence detection, it is recommended to confirm that the divergence takes effect after the current k is completely closed first. I have identified this state in the indicator as "k not end"
Disadvantages and Risks
Since it is a quick discovery, there will be error identification. I listed the difference between the two indicators when deleting errors. The indicator turns off the "delete error" option by default.
Please do not:
Don't go short in the uptrend, don't go long in the downtrend.
Top divergences that occur because of a strong uptrend are usually only temporary pullbacks. Bottom divergences in persistent declines are also temporary rallies. Do not attempt to trade such low-return trades.
It is recommended to use the divergence indicator when the stock price has made a new high and retraced, and once again made a new high, because this often leads to the end of the trend.
Divergence how to use:
1. After the previous K line was completely closed, a bottom divergence was found.
2. Open an long order at the beginning of the second bar, or as close to the bottom as possible (because the stop loss will be smaller).
3. Break the stop loss price below the previous low where the divergence occurred, which already means that the divergence is wrong.
RSI usage:
1. RSI is above the 50 line, in an uptrend, below 50 in a downtrend.
2. Above 70 is overbought, falling below the oversold zone may mean the end of the uptrend.
Below 30 is oversold, above the oversold zone may mean the end of the downtrend.
ADX DI EMA Clouds
EMA clouds colored by DI and ADX indicator:
9 EMA and 21 EMA Cloud turns green in a bull trend and red when in a bull trend...if the trend is half bulll and half bear..the clouds turn white.
I also coded if the momentum in increasing (yellow) or if the momentum is decreasing (blue) or if the momentum is flat (white).
The Clouds are colored based off the Di (+/-)
9 EMA is colored based of ADX momentum strength
ADX:
ADX is used to quantify trend strength. ADX calculations are based on a moving average of price range expansion over a given period of time. The default setting is 14 bars, although other time periods can be used.1
ADX can be used on any trading vehicle such as stocks, mutual funds, exchange-traded funds and futures .
DI (+/-):
The directional movement index (DMI) is an indicator developed by J. Welles Wilder in 1978 that identifies in which direction the price of an asset is moving. The indicator does this by comparing prior highs and lows and drawing two lines: a positive directional movement line ( +DI ) and a negative directional movement line ( -DI ). An optional third line, called the average directional index ( ADX ), can also be used to gauge the strength of the uptrend or downtrend.
This indicator has the length changed from 14 to 9 so you can have more updated price calculation
I also add the 4 levels I use for day trading; the 10, 20, 30, 40-50 are the levels I like to see the Di to break over.
A lot of traders use different levels, but these I have and found most useful. You can set alerts when any Di crosses over the 40 for true trend breakout!
Higher TF Moving AveragesScript showing up to 5 different Moving Averages of a Higher Timeframe.
User can select the MA type (EMA or SMA) and its length.
Default are 10, 20, 50, 100 and 200 period SMAs.
The script will also plot optional labels with price display.
All plots and color are configurable.
SirSeff's EMA RainbowThis strategy uses divergences between three exponential moving averages and their slope directions as well as crosses between the price and these moving averages to switch between a long or short position. The strategy is non-stop in the market and always either long or short.\
This trend trading strategy uses exponential moving averages of 10, 20, 50, 100, 150, 200 to gauge the price action cycle if it is on Stage 2 aka Mark up famously coined by Dr.Wykcoff.
It opens a position when the closing price crosses above the 10ema and all the exponential moving averages are stacked up together. Stacked-up Moving averages are used by Mark Minervini and Oliver Kell.
I close a position at an 8% trailing stop from the opened position which makes the succeeding buy orders as scaling up or averaging up from an established bullish trend.
All trading involves high risk; past performance is not necessarily indicative of future results. Hypothetical or simulated performance results have certain inherent limitations. Unlike an actual performance record, simulated results do not represent actual trading. Also, since the trades have not actually been executed, the results may have under-or over-compensated for the impact, if any, of certain market factors, such as lack of liquidity. Simulated trading programs in general are also subject to the fact that they are designed with the benefit of hindsight. No representation is being made that any account will or is likely to achieve profits or losses similar to those shown.

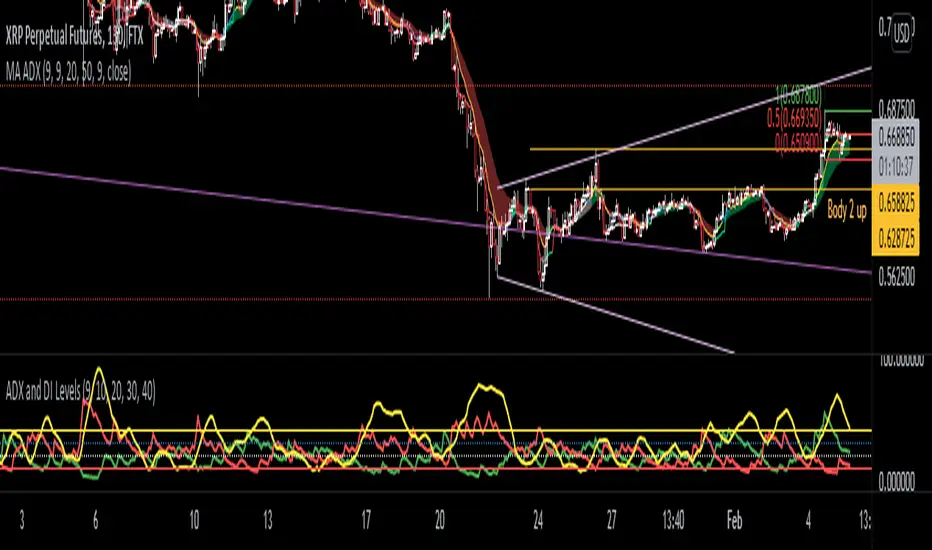
ADX and DI LevelsADX:
ADX is used to quantify trend strength. ADX calculations are based on a moving average of price range expansion over a given period of time. The default setting is 14 bars, although other time periods can be used.1
ADX can be used on any trading vehicle such as stocks, mutual funds, exchange-traded funds and futures.
DI (+/-):
The directional movement index (DMI) is an indicator developed by J. Welles Wilder in 1978 that identifies in which direction the price of an asset is moving. The indicator does this by comparing prior highs and lows and drawing two lines: a positive directional movement line (+DI) and a negative directional movement line (-DI). An optional third line, called the average directional index (ADX), can also be used to gauge the strength of the uptrend or downtrend.
This indicator has the length changed from 14 to 9 so you can have more updated price calculation
I also add the 4 levels I use for day trading; the 10, 20, 30, 40-50 are the levels I like to see the Di to break over.
A lot of traders use different levels, but these I have and found most useful. You can set alerts when any Di crosses over the 40 for true trend breakout!

MAD as a hatter (inspired by J. Ehlers)I just read Ehler's article (Stocks & Commodities V. 39:10 (20–23): Cycle/Trend Analytics And The MAD Indicator) and decided to modify his original idea a bit by taking the volume into account. Ehlers' "MAD indicator" compares two averages of different lengths, but this script compares two different averages (SMA and New WMA, weighted by volume) with the same length. Simple, but seems to be quite efficient on symbols with decent volume. Enjoy.

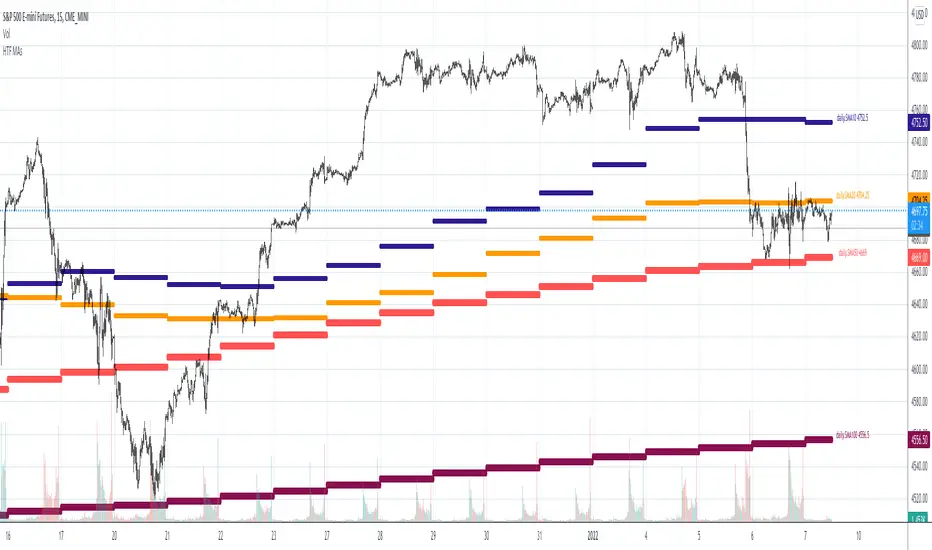
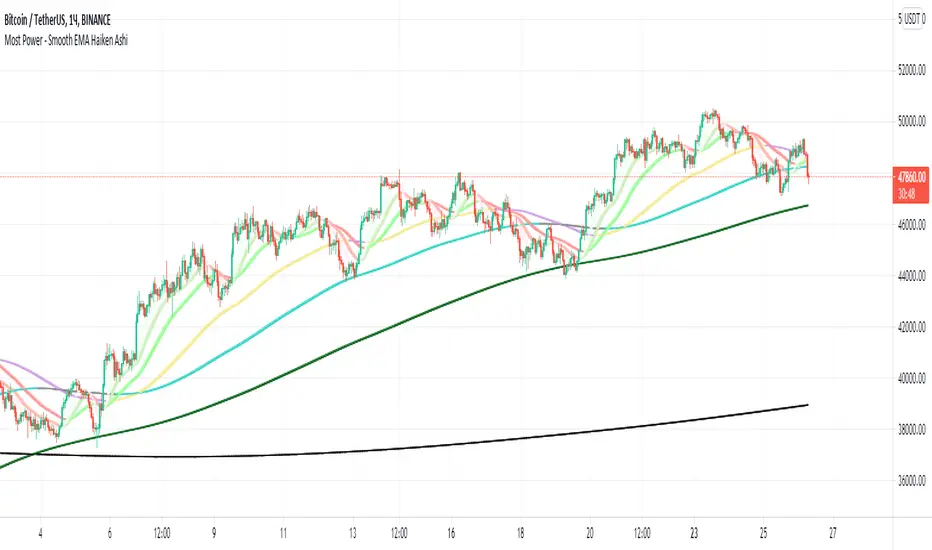
Most Power - Smooth EMA Haiken AshiMost Power - Smooth EMA Haiken Ashi
The indicator displays smoothed EMA (5, 10, 20, 50, 100, 200, 1000). Smoothing occurs through the use of Haiken AShi
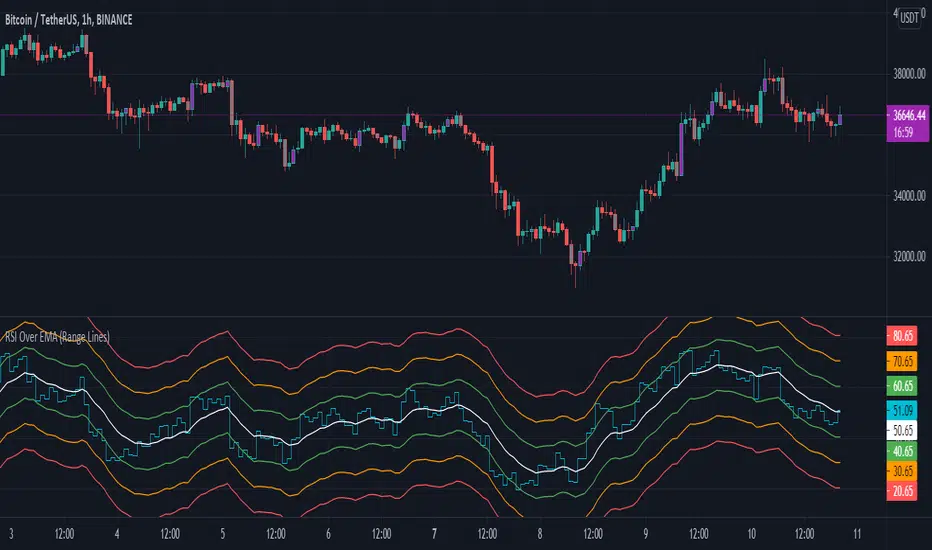
RSI Over EMA (Range Lines)This is another version of the RSI over EMA Trend Sniper script that I released here:
This one gives you better control across pairs wither higher volatility with the extra lines and more alert possibilities.
Here are the useful Alert functions within this indicator:
LONGS:
-Aqua line (RSI Line) - Crossing UP (Long Alert) on the Lower Green line
-Aqua line (RSI Line) - Crossing UP (Long Alert) on the Upper Green line
-Aqua line (RSI Line) - Crossing UP (Long Alert) on the Lower Amber line
-Aqua line (RSI Line) - Crossing UP (Long Alert) on the Upper Amber line
-Aqua line (RSI Line) - Crossing UP (Long Alert) on the Lower Red line
-Aqua line (RSI Line) - Crossing UP (Long Alert) on the Upper Red line
SHORTS:
-Aqua line (RSI Line) - Crossing DOWN (Short Alert) on the Lower Green line
-Aqua line (RSI Line) - Crossing DOWN (Short Alert) on the Upper Green line
-Aqua line (RSI Line) - Crossing DOWN (Short Alert) on the Lower Amber line
-Aqua line (RSI Line) - Crossing DOWN (Short Alert) on the Upper Amber line
-Aqua line (RSI Line) - Crossing DOWN (Short Alert) on the Lower Red line
-Aqua line (RSI Line) - Crossing DOWN (Short Alert) on the Upper Red line
You can setup alerts for the Aqua line (RSI Line) 'crossing up' (Long Alert) or 'crossing down' (Short Alert) on any of the colored EMA lines.
By default the lines are spread out at 10/20/30 and that should cover high volatility charts. But, this is customizable and you can reduce the size of Green/Amber/Red lines to try and get a better more focused setup for whichever coin you are trading on. I have found this version of the RSI over EMA to work better with alt coins that are generally more volatile, but using it on Bitcoin works too.
I am using this for Cryptocurrency alerts, but not for automation to enter or exit a trade. It's important to only use this on normal candles, and only use it as a confirmation of a possible good entry or exit.
BAM's Weighted ROCTraders,
BAM's Weighted ROC is a Momentum indicator. ROC stands for 'Rate of Change' therefor this indicator plots the reading of a weighted average Rate of Change. In its current form it uses 4 periods en 4 weightings. The periods are set to 21/63/126/252 which corresponds to the number of trading days in each 1/3/6/12 months. The weightings are set to emphasize the more recent periods where the 1-month period counts for 40% of the signal, the 3-monthh period for 30%, the 6-month for 20% and the 12-month for 10%. These settings, both periods and weightings, are customizable. The current settings are meant to serve the widely used 1-day time interval chart setting. Feel free to alter the time frame and adjust the parameters accordingly; eg I like trading the weekly chart on a 10/20/30/40 period settings.
BAM's Weighted ROC can be used as a trendfilter for Trend Following trading systems or as an entry signal for Swing trading systems, or both. In the current setting the indicator is set to trend-following; it turns green when positive (above 0), indicating positive momentum. And red when negative (below 0), indicating negative momentum. In the most basic form one can trade a well diversified portfolio of assets using the indicator as guidance for entry and exit signals as it flows back and forth between positive and negative. Another use for the indicator lies in Swing Trading systems. In this approach the transfer from declining momentum into ascending momentum can be interpreted as a shift in momentum from negative to positive, and therefor constitute an entry opportunity. A combination of the 2 signals is of perfectly viable too, wait for positive momentum (reading above 0) in combination with a upward shift from one bar to the other. Use the reverse logic as an exit signal. In these examples the indicator is used in a stand-alone fashion. But off course it can also be used in conjunction with other indicators.
I personally use the two functions, trend-following en swingtrading, in tandem (combined)
for further reading into the rational behind Trend Following trading systems I recommend the following sources:
- Free Read: Google for 'Meb Faber, Global Asset Allocation' he gives out free copies on his website. Meb is a well known character in the Momentum-factor arena.
- Easy read: 'Following the trend' By Andreas Clenow. I don't think there is any Trend Following trader that doesn't know this chaps work.
- sophisticated Read: Trend Following with Managed Futures by A. Greyserman and K. Kaminski. This one is for those who seriously mean business!
Good luck out there, pls consider that the momentum factor holds an edge, at least based on historical performance, but this out-performance (most often) lies in the low single digits.
Pls be aware that use of this indicator is at your own risk. All info provided is solely presented for educational purposes.
Kind regards,
Bam

S73 Colored RSIS73 Colored RSI
Color change is based on above or below 50 mid line.
When RSI is red (below 50), I like to look for shorts, and when RSI is green (above 50), I like to look for longs.
Added extra bands for 10, 20, 80, and 90, so you can easily spot way oversold and way overbought conditions.
I look at taking profit in the overbought, oversold zones.
Hope you like it.
BTC tips - bc1q5eyfentq9mvxmnceh605yd8fted5se5rcta9j7
LTC tips - LXhWhvN86wbLNvacaZpEzhVEcefyMDPtcQ

Swing or scalping GOLD [RickAtwood] Swing or scalping - automatically determine the currently active trends. Various moving averages are used. It is also designed for any type of trader from scalping to swing.
The key 3 moving averages are designed to identify support and resistance. If the price bounces off them, boldly open and place a stop of 10-20 pips(currency pairs)
Functional
buy ---> green candles
sell ----> red candles
There are alerts for buy and sell based on crossovers
If the price is above the cloud then buy. If the price is below the cloud then sell. The main thing is to open deals only at the very beginning when the price starts to leave the cloud. Also, your stops will be minimal.
When testing this system, we opened 750 trades manually. Success rate of 71% for currency pairs and for gold
P.s If you have any questions about how to open, how to close deals. Always write to me, I will help you) Success to all.
