Komut dosyalarını "流通市值在50亿至200亿之间的股票中,成交量持续放大的个股有哪些?" için ara

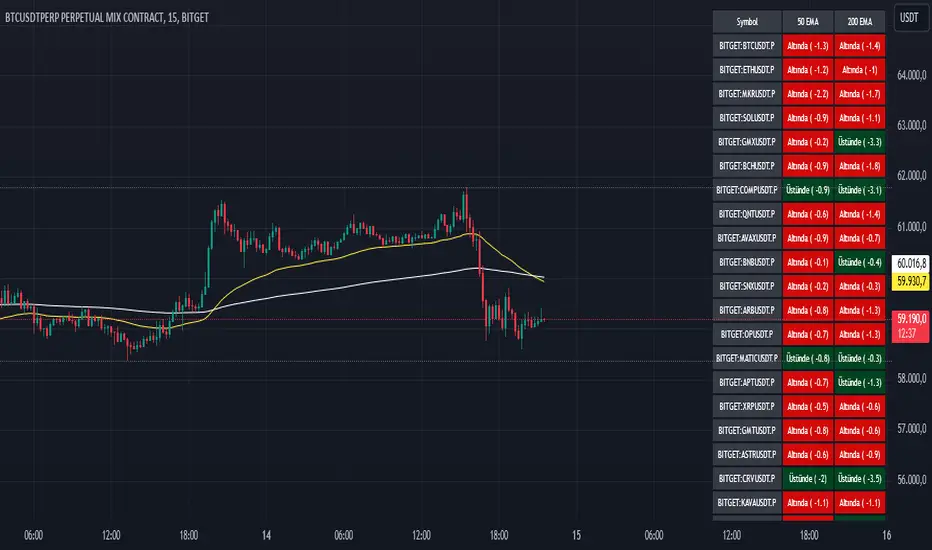
EMA 50 200 Multi-Scanner
EMA 50 200 Multi-Scanner: İndikatör Açıklaması ve Kullanım Kılavuzu
"EMA 50 200 Multi-Scanner" indikatörü, birden fazla kripto para çiftini farklı zaman dilimlerinde tarayan güçlü bir teknik analiz aracıdır. Bu indikatör, 50 periyotluk ve 200 periyotluk Üssel Hareketli Ortalamalar (EMA) arasındaki ilişkiyi analiz ederek, çeşitli zaman dilimlerinde potansiyel alım ve satım fırsatlarını tespit etmenizi sağlar. Hem kısa vadeli trendleri hem de uzun vadeli trendleri gözlemleyerek, piyasa koşullarına uygun stratejiler geliştirmenize yardımcı olur.
Ne İşe Yarar?
Trend Yönünü Belirleme: İndikatör, seçtiğiniz kripto para çiftlerinin her birinde 50 EMA ve 200 EMA arasındaki ilişkiyi analiz eder. Bu analiz, hem kısa vadeli hem de uzun vadeli trendlerin yönünü belirlemenize olanak tanır.
Zaman Dilimleri Arası Analiz: Farklı zaman dilimlerinde çalışabilen bu indikatör, günlük, saatlik, dakikalık gibi çeşitli periyotlarda trendleri ve fiyat hareketlerini incelemenizi sağlar. Bu, hem kısa vadeli ticaret fırsatlarını yakalamak hem de uzun vadeli yatırım kararlarını desteklemek için idealdir.
Alım/Satım Sinyalleri: İndikatör, fiyatın 50 EMA ve 200 EMA ile olan ilişkisini temel alarak alım ve satım sinyalleri üretir. Bu sinyaller, piyasa trendlerinden yararlanarak pozisyon açma veya kapama kararlarınızı destekler.
Dinamik Destek ve Direnç Seviyeleri: EMA seviyeleri, aynı zamanda dinamik destek ve direnç seviyeleri olarak kullanılabilir. Fiyatın bu seviyelere yaklaşması, potansiyel geri dönüş noktalarını veya trendin devamını işaret edebilir.
Nasıl Kullanılır?
İndikatör Ayarları:
EMA Uzunlukları: İhtiyacınıza göre 50 EMA ve 200 EMA'nın periyot uzunluklarını ayarlayabilirsiniz.
Renkler: EMA çizgilerinin rengini tercihinize göre özelleştirebilirsiniz.
Negatif Değerleri Gösterme: Fiyatın EMA seviyelerinin altında olduğu durumlarda negatif değerleri görmek isterseniz, bu özelliği aktif hale getirebilirsiniz.
Semboller: İndikatör, önceden tanımlanmış kripto para çiftleri üzerinde çalışır. Her bir sembol, seçtiğiniz zaman diliminde taranır ve sonuçlar gösterilir. Gereksinimlerinize göre bu sembolleri seçebilir veya çıkarabilirsiniz.
Zaman Dilimleri: İndikatör, TradingView platformundaki tüm zaman dilimlerinde çalışır. Bu, hem kısa vadeli hem de uzun vadeli yatırımcılar için esnek bir analiz olanağı sunar.
Al/Sat Sinyalleri:
Alım Sinyali: 50 EMA, 200 EMA'yı yukarı yönde kestiğinde ve fiyat bu kesişimin üzerinde olduğunda yeşil bir "BUY" etiketi ile gösterilir.
Satım Sinyali: 50 EMA, 200 EMA'yı aşağı yönde kestiğinde ve fiyat bu kesişimin altında olduğunda kırmızı bir "SELL" etiketi ile gösterilir.
"EMA 50 200 Multi-Scanner," çoklu zaman dilimlerinde ve kripto para çiftlerinde trend takibi yapmak isteyen yatırımcılar için etkili ve kullanımı kolay bir araçtır. Piyasa koşullarını daha iyi anlamak ve ticaret stratejilerinizi optimize etmek için bu indikatörü kullanabilirsiniz.
-------------
The "EMA 50 200 Multi-Scanner" is a powerful technical analysis tool designed to scan multiple cryptocurrency pairs across different timeframes. This indicator analyzes the relationship between the 50-period and 200-period Exponential Moving Averages (EMA) to help you identify potential buying and selling opportunities across various timeframes. It enables you to observe both short-term and long-term trends, aiding in the development of market-appropriate strategies.
Purpose
Trend Direction Identification: The indicator analyzes the relationship between the 50 EMA and 200 EMA for each selected cryptocurrency pair, allowing you to determine the direction of both short-term and long-term trends.
Multi-Timeframe Analysis: This indicator can operate across different timeframes, such as daily, hourly, and minute-based periods, allowing you to examine trends and price movements in multiple contexts. It is ideal for capturing short-term trading opportunities and supporting long-term investment decisions.
Buy/Sell Signals: The indicator generates buy and sell signals based on the relationship between the price and the 50 EMA and 200 EMA. These signals support your decision-making process by highlighting opportunities to open or close positions based on market trends.
Dynamic Support and Resistance Levels: The EMA levels can also serve as dynamic support and resistance levels. When the price approaches these levels, it can indicate potential reversal points or trend continuations.
How to Use
Indicator Settings:
EMA Lengths: Adjust the period lengths of the 50 EMA and 200 EMA to suit your needs.
Colors: Customize the colors of the EMA lines according to your preferences.
Show Negative Values: If you want to see negative values when the price is below the EMA levels, you can enable this feature.
Symbols: The indicator works on predefined cryptocurrency pairs. Each symbol is scanned within the selected timeframe, and results are displayed. You can select or deselect symbols according to your requirements.
Timeframes: The indicator functions across all timeframes available on the TradingView platform, offering flexible analysis for both short-term and long-term traders.
Buy/Sell Signals:
Buy Signal: A green "BUY" label is shown when the 50 EMA crosses above the 200 EMA and the price is above this crossover.
Sell Signal: A red "SELL" label is shown when the 50 EMA crosses below the 200 EMA and the price is below this crossover.
The "EMA 50 200 Multi-Scanner" is an effective and user-friendly tool for traders looking to track trends across multiple timeframes and cryptocurrency pairs. You can use this indicator to gain a better understanding of market conditions and optimize your trading strategies.
EMA 50 + 200 Trend Signal TableEMA 50 + 200 Trend Signal Table (ETT)
This indicator provides a multi-timeframe trend signal table based on the 50-period and 200-period Exponential Moving Averages (EMAs). It visually plots the EMA 50 and EMA 200 on the chart, along with a customizable, compact table that indicates the trend direction across multiple timeframes. This tool is useful for traders looking to quickly identify market trends and momentum on various timeframes.
How It Works
- EMA Trend Analysis: The script compares the EMA 50 and EMA 200 values to determine the trend. When EMA 50 is above EMA 200, the trend is considered Bullish; if EMA 50 is below EMA 200, the trend is Bearish. If EMA 200 data is unavailable (e.g., on very short timeframes), the trend status will display as Neutral.
- Multi-Timeframe Trend Signals: The table displays the trend signals across five user-defined timeframes, updating in real time. Each timeframe row shows either Bullish, Bearish, or Neutral, with colors customizable to your preference.
Features
- EMA 50 and EMA 200 Visualization: Plots EMA 50 and EMA 200 lines directly on the chart. Users can customize the color and line thickness for each EMA to fit their charting style.
- Trend Signal Table: A table positioned on the chart (with options for positioning in the corners) shows the trend direction for the selected timeframes.
Bullish Trend: Highlighted in green (default) with 50% opacity.
Bearish Trend: Highlighted in red (default) with 50% opacity.
Neutral Trend: Highlighted in gray (default) with 50% opacity.
- Customizable Table Appearance: Allows users to select the position of the table (top-right, top-left, bottom-right, or bottom-left) and choose between compact sizes (Extra Small, Small, Normal).
- Adjustable Colors: Users can specify custom colors for each trend status (Bullish, Bearish, Neutral) as well as for the text and table border colors.
Inputs and Customizations
- Timeframes: Choose up to five different timeframes for trend analysis.
- EMA Colors and Line Widths: Customize the color and line width of EMA 50 and EMA 200 plotted on the chart.
- Table Settings: Control the position, size, and color options of the trend signal table for improved visibility and integration with your chart layout.
Use Case This indicator is ideal for traders who employ a multi-timeframe approach to confirm trends and filter entries. By monitoring the relative positions of EMA 50 and EMA 200 across various timeframes, traders can get a quick snapshot of trend strength and direction, aiding in informed trading decisions.

IB & Hammer at SMA(20,50|200)IB & Hammer at SMA (20, 50, 200) Breakout/Breakdown Indicator
Overview:
The IB (Inside Bar) & Hammer at SMA Breakout/Breakdown Indicator is designed to identify breakout and breakdown opportunities using Inside Bars (IB) in combination with Simple Moving Averages (SMA 20, 50, 200) as key trend filters. This indicator is useful for traders looking to catch momentum moves after consolidation phases, confirming the trend direction with moving averages.
Indicator Logic:
Inside Bar (IB) Detection:
An Inside Bar is a candlestick that is completely within the range of the previous candle (i.e., lower high and higher low).
Inside Bars indicate consolidation, suggesting a potential breakout.
SMA Trend Confirmation:
The script uses three moving averages (SMA 20, 50, 200) to determine the trend direction.
Bullish trend: Price is above the 50 & 200 SMAs.
Bearish trend: Price is below the 50 & 200 SMAs.
The 20 SMA is used as a dynamic short-term momentum filter.
Breakout & Breakdown Conditions:
Breakout: When price breaks above the Inside Bar’s high, and the trend is bullish (above key SMAs).
Breakdown: When price breaks below the Inside Bar’s low, and the trend is bearish (below key SMAs).
Alerts can be set to notify traders of potential trade opportunities.
Features:
✅ Identifies Inside Bars (consolidation zones).
✅ Uses SMA (20, 50, 200) for trend confirmation.
✅ Breakout/Breakdown signals based on Inside Bar structure.
✅ Customizable Moving Averages & Alerts.
✅ Visual markers for easy trade identification.
How to Use:
Confirm Trend Direction:
If the price is above SMA 50 & 200, look for breakout trades.
If the price is below SMA 50 & 200, look for breakdown trades.
Watch for Inside Bars:
The script highlights Inside Bars with a specific color (configurable).
These bars indicate a low-volatility phase, preparing for a breakout.
Trade on Breakout/Breakdown:
Breakout: Enter long when the price breaks above the Inside Bar’s high (bullish trend).
Breakdown: Enter short when the price breaks below the Inside Bar’s low (bearish trend).

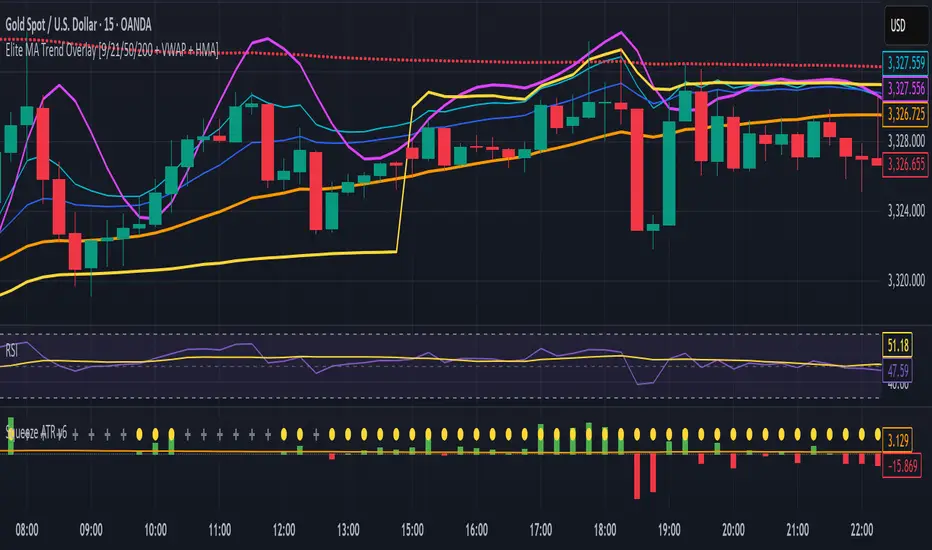
Elite MA Trend Overlay [9/21/50/200 + VWAP + HMA]🔍 What It Is:
The Elite MA Trend Overlay is a professional-grade moving average system built for day traders, scalpers, and swing traders who need clear, visual trend confirmation and precise entry zones across all timeframes.
This overlay combines 5 industry-proven tools into one compact indicator for sniper-level decision making:
EMA 9 – Entry momentum
EMA 21 – Microstructure guide
EMA 50 – Trend bias filter
EMA 200 – Institutional macro direction
VWAP – Intraday fair value (used by pros)
Hull MA (HMA) – Early shift detector
It also features auto-detected trend zones using color-coded background shading to help you instantly know if the market is in a bullish or bearish regime.
🧠 How It Works:
The script dynamically plots the short-term to long-term moving averages to reflect real-time market structure. When all EMAs are aligned in one direction, a colored background highlights the dominant trend:
✅ Green background = Bullish trend (9 > 21 > 50 > 200)
🔻 Red background = Bearish trend (9 < 21 < 50 < 200)
The VWAP line acts as a magnet and decision zone—traders use it for intraday entries or exits. The Hull Moving Average adapts quickly to price shifts, making it perfect for spotting early reversals before the EMAs cross.
🎯 Why It Helps Traders Succeed:
This indicator:
Removes guesswork: Know instantly if you’re in a strong trend or chop zone.
Filters bad trades: Avoid entering against structure or into volatility traps.
Improves timing: Use pullbacks to EMAs or Hull MA flips for sniper entries.
Works across timeframes: From scalping 1-minute to swing trading daily charts.
Whether you're trading gold, forex, stocks, or crypto — this overlay gives you clean, professional structure that keeps you disciplined and sharp.
⚙️ Features:
On/off toggles for VWAP & Hull MA
Minimalist, clutter-free plotting
Auto background color zones
Supports Pine Script v6 (latest version)
👑 Recommended Use:
Confirm trend with background + EMA alignment
Enter on pullbacks to EMA 21 or 50
Use Hull MA or RSI for early reversal detection
Exit at VWAP reversion or trend exhaustion
💬 “Structure is everything. Trade with the flow, not against it.”
فلتر EMA 20/50/200 - صعودي فقط//@version=5
indicator("فلتر EMA 20/50/200 - صعودي فقط", overlay=true)
// مدخلات
lenFast = input.int(20, "EMA Fast")
lenSlow = input.int(50, "EMA Slow")
lenTrend = input.int(200,"EMA 200")
// حساب المتوسطات
emaFast = ta.ema(close, lenFast)
emaSlow = ta.ema(close, lenSlow)
emaTrend = ta.ema(close, lenTrend)
// ميل EMA200
slopeBars = input.int(5, "عدد الشموع لميل EMA200")
emaTrendSlope = emaTrend - emaTrend
// شروط الفلتر
trendUp = close > emaTrend and emaFast > emaSlow and emaSlow > emaTrend and emaTrendSlope > 0
bullCross = ta.crossover(emaFast, emaSlow)
// إشارة الفلتر
longFilter = trendUp and bullCross
// عرض على الشارت
plot(emaFast, color=color.orange, title="EMA20")
plot(emaSlow, color=color.blue, title="EMA50")
plot(emaTrend, color=color.green, title="EMA200")
plotshape(longFilter, title="فلتر شراء", style=shape.labelup,
text="✅ فلتر صعودي", color=color.green, location=location.belowbar, size=size.tiny)
// إخراج بوول (للإكسيل أو فرز الرموز في Screener)
filterOutput = longFilter ? 1 : 0
plotchar(filterOutput, char="●", color=longFilter ? color.green : na, title="فلتر فعّال")

Triple EMA with Alert | 21, 50, 200 EMA Strategy + Crossover🚀 Boost your trading edge with the Triple EMA with Alert — a professional-grade indicator designed for traders who want precise, real-time trend confirmation across short, medium, and long-term market movements.
🔹 What Makes This Indicator Powerful?
Three Adjustable EMAs — Default: 21, 50, 200 periods (fully customizable 1–200).
Toggle Visibility — Show only the EMAs you need for your strategy.
Real-Time Alerts — Get notified instantly when:
EMA 1 crosses EMA 2 → short-term trend change.
EMA 2 crosses EMA 3 → medium-term trend alignment.
Works on All Markets & Timeframes — Forex, crypto, stocks, indices, and commodities.
🔹 Why Traders Love It
📊 Multi-Timeframe Trend Confirmation — Filter out noise and trade with market momentum.
🎯 Accurate Crossover Signals — Identify bullish and bearish momentum shifts.
🔔 Hands-Free Monitoring — Alerts keep you informed even when you’re away from the chart.
💡 Versatile for Any Strategy — Perfect for scalping, swing trading, or long-term investing.
🔹 How to Use It
Bullish Signal — EMA 1 crossing above EMA 2 or EMA 2 crossing above EMA 3.
Bearish Signal — EMA 1 crossing below EMA 2 or EMA 2 crossing below EMA 3.
Combine with support/resistance zones, RSI, or volume for higher probability trades.
📌 Pro Tip:
Use EMA 21 & EMA 50 for momentum confirmation.
Use EMA 200 to spot the overall market direction.
If you’re serious about trend trading with precision, the Triple EMA with Alert will keep you one step ahead of market moves — no more missed entries or exits.

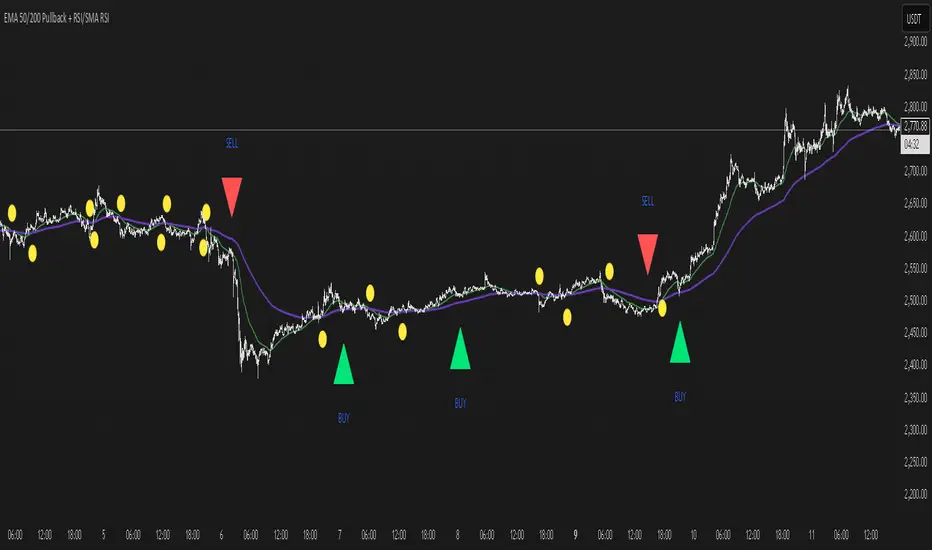
EMA 50/200 Pullback + RSI/SMA RSI
Strategy Description: EMA 50/200 Pullback + RSI/SMA RSI
1. Trend Identification with EMA:
Uses two Exponential Moving Averages (EMA): a fast EMA (default 50) and a slow EMA (default 200).
When the fast EMA crosses above the slow EMA (bullish crossover), an uptrend is identified.
When the fast EMA crosses below the slow EMA (bearish crossover), a downtrend is identified.
The lengths of both EMAs are fully customizable.
2. EMA Distance Condition:
Signals are only valid when the absolute percentage distance between the two EMAs is within a user-defined range (default: 0.4% to 1%).
This helps filter out weak signals when the EMAs are too close or too far apart.
3. Pullback Condition:
After a new trend is detected (EMA crossover), the strategy waits for the price to pull back to touch or cross the fast EMA (EMA 50).
This ensures entries are not taken immediately at the crossover, but after a retracement to a dynamic support/resistance area.
4. RSI Confirmation:
Uses the RSI indicator (default 14) and its Simple Moving Average (SMA RSI, default 14).
Buy signal: RSI crosses above its SMA.
Sell signal: RSI crosses below its SMA.
Both RSI and SMA RSI lengths are fully customizable.
5. Entry Rules:
The indicator only gives the first buy/sell signal after each EMA crossover (start of a new trend), and will not repeat signals until the next EMA crossover.
Buy signal:
Fast EMA crosses above slow EMA
EMA distance is within the valid range
Price pulls back to the fast EMA
RSI crosses above its SMA
Sell signal:
Fast EMA crosses below slow EMA
EMA distance is within the valid range
Price pulls back to the fast EMA
RSI crosses below its SMA
6. Customization:
All parameters (EMA lengths, RSI length, SMA RSI length, EMA distance range) can be adjusted in the indicator’s settings.
Note:
This is a signal indicator, not a complete trading strategy. For real trading, always combine with risk management and additional confirmations.
Triple EMA (20, 50, 200) w/ LabelsI've combined the 20, 50, and 200 day exponential moving averages and added labels.
I created this due to finding EMA scripts that are either nothing but ugly to look at or have extra "features" that serve no purpose.
This gets rid of the clutter and gives a simple triple EMA with labels.
Labels are optional, you can turn them off in the settings.

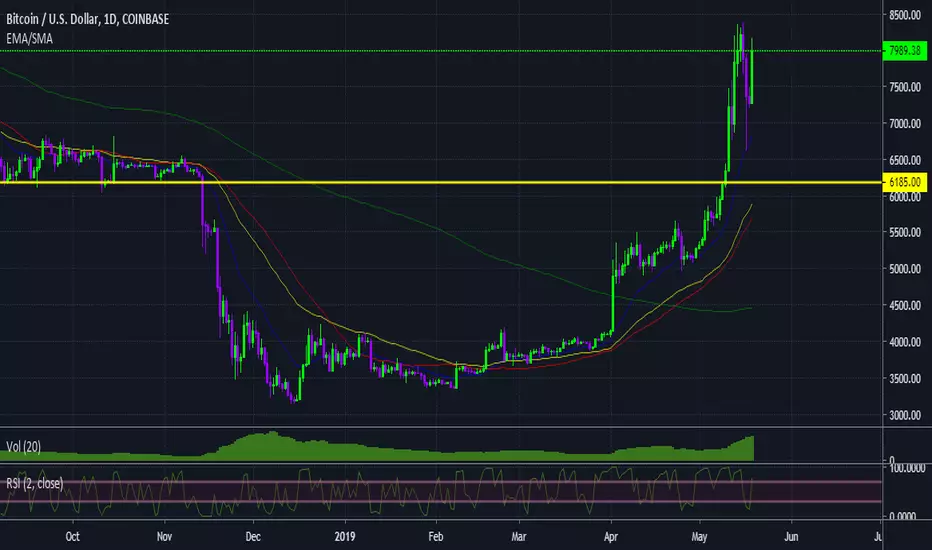
boot2thrill - EMA 20/50 & SMA 50/200//Notes:
//Version by boot2thrill on 05-20-2019.
//Version includes combined Exponential Moving Averages (EMA) for 20/50 periods and Simple Moving Averages (SMA) for 50/200 periods.
//***Recommended use on BTCUSD 1h/4h/1d chart.***
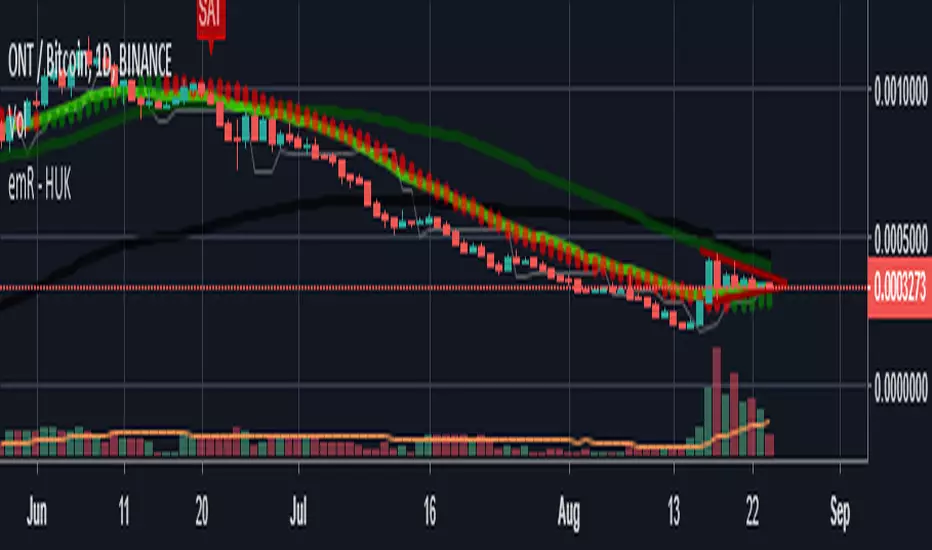
HUK ElasticVolume/50 MOVING AVERAGE e 50/200/20 Coral TrendElastic Volume Default Settings : 50 lenght!
Moving Average Default Settings:50 / 200
EMA Default Settings :20
Coral Trend Default Settings :21/0,4
Thank you ! emR Huk ..
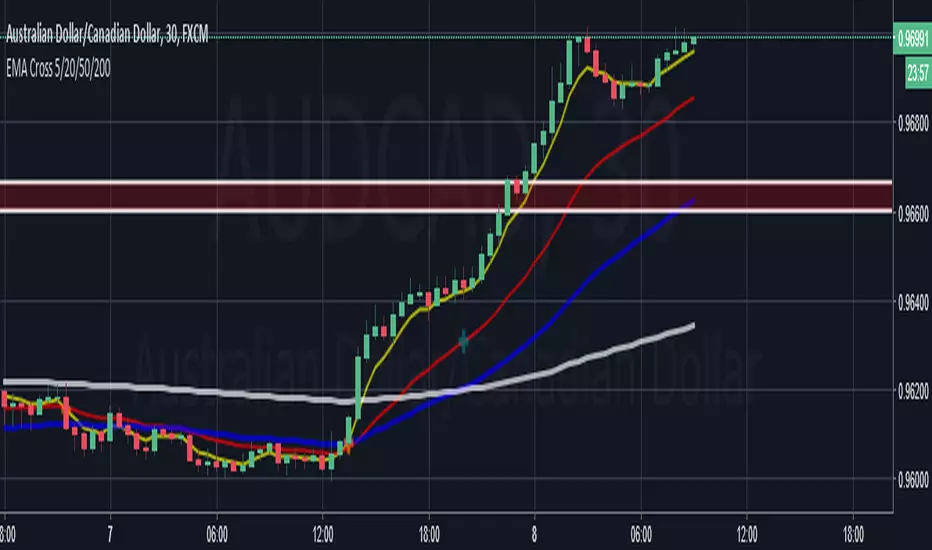
Delphiguy EMA Cross 5/20/50/200A simple Indicator for EMA 5, 20, 50, 200.
It shows gives potential trades on the crossover of the 5/20, and 50/200
It also shows price trend via the 200EMA
EMA 20/50/200 - M3EDGE Clean Mode™The M3EDGE Clean Mode™ indicator is designed to spot the cleanest, most aligned market phases.
It filters out market noise and highlights only the high-probability trending zones where the odds are in your favor.
How it works:
• Tracks 3 key EMAs (20, 50, 200)
• Confirms directional alignment across short, medium, and long-term trends
• Colors optimal market phases to identify high-probability setups
• Optional display of the dynamic EMA50/EMA200 zone to visualize the trend’s core
Purpose:
🎯 Avoid choppy, sideways market conditions
🎯 Focus only on smooth, directional price moves
🎯 Reduce false signals and improve chart clarity
Best use cases:
• Ideal for scalping, day trading, and swing trading
• Works on all markets: indices, commodities, forex, crypto
• Perfect when combined with macro analysis and other M3EDGE™ setups
💡 Pro tip: The M3EDGE Clean Mode™ isn’t just another indicator — it’s a quality filter that keeps you out of messy conditions. When it lights up, you know the road ahead is clear.

Long only EMA CROSS 8/50/200 BacktestImprove EMA CROSS 8/50/200 with adjustable Exit EMA Level, and can open trade only when above EMA200

EMA 13/50/200/800Candle close below the 13 ema or above is entry singal for sell and buy respectively.
After a bounce off the 50,200 and 800 then a confirmation with the 13 ema
Bollinger Bands Ema 50,200,800EMAs converted to Bollinger Bands The bands are 50, 200 and 800 period, forming a strategy and having clear trends and stronger supports and resistances (when the lines converge the area is stronger).
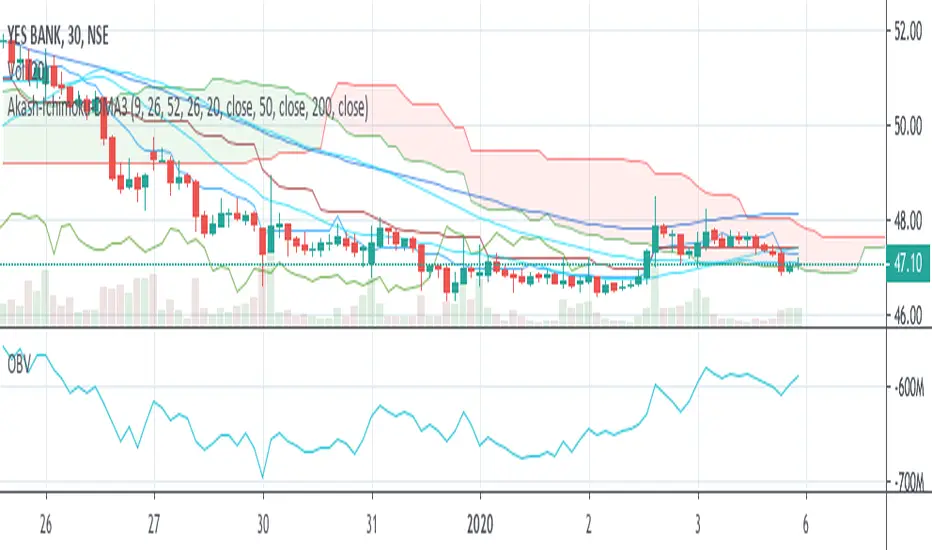
Akash-Ichimoku Cloud + Moving avg of 20-50-200Its a convenient combo indicator of ichimoku cloud and moving averages of 20-50-200
This can help save on limit of indicators in free version.
Most of the positional trading calls can be done with this combo indicator.
Akash Rajpal
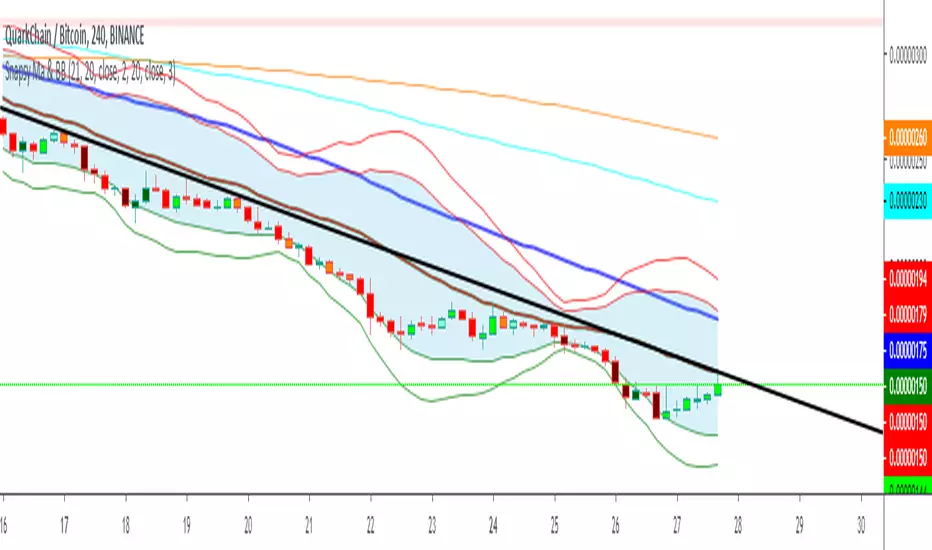
Snapsy ma20-50-200 - ema 144-BB-Volume basedma 20-50-200 ema 144
bollinger bandı 2 ve 3 değerli
ve kıvanç hocanın volume based coloured
birlikte