Edge of MomentumThe script was designed for the purpose of catching the rocket portion of a move (the edge of momentum).
Long
--When RSI closes over 60, take long order 1 tick above that bar. The closed bar above RSI 60 will be colored "green" or whatever color the user chooses. (RSI > 60)
--On a long position, exit will be a closed bar below the ema (low, 10) . The closed bar below the ema will be colored "yellow." (Price < ema)
--Note: On a long position there is no need to exit when a closed bar is colored "purple." RSI is just below 60 but above 40. Pullback or chop
Short
--When RSI closes below 40, take a short order 1 tick below that bar. The closed bar below RSI 40 will be colored "red." RSI<40)
--On a short position, exit will be a closed bar above the ema (low, 10). The closed bar above the ema will be colored "purple." (Price > ema)
--Note: On a short position there is no need to exit when a closed bar is colored "yellow."
Note: You may see a series of purple and yellow bars, that is simply chop. I define chop as RSI moving between 60 and 40.
Trade should only be taken above green colored candle(long) and below red colored candle (short). No position should be taken off yellow or purple candle (chop)
Again this is designed to catch the momentum part of a move, and to help reduce some entries during chop. It is a simple systems that beginning traders can use and profit from.
Note: I don't no shit about coding scripts I just learn from reading others.
Enjoy. If you decide to use please drop me a line...suggestions/comments, etc.
Best of luck in all you do.
"泰国一寺庙被曝藏有40多具尸体" için komut dosyalarını ara

Money Flow Index + AlertsThis study is based on the work of TV user Beasley Savage ( ) and all credit goes to them.
Changes I've made:
1. Added a visual symbol of an overbought/oversold threshold cross in the form of a red/green circle, respectively. Sometimes it can be hard to see when a cross actually occurs, and if your scaling isn't set up properly you can get misleading visuals. This way removes all doubt. Bear in mind they aren't meant as trading signals, so DO NOT use them as such. Research the MFI if you're unsure, but I use them as an early warning and that particular market/stock is added to my watchlist.
2. Added 60/40 lines as the MFI respects these incredibly well in trends. E.g. in a solid uptrend the MFI won't go below 40, and vice versa. Use the idea of support and resistance levels on the indicator and it'll be a great help. I've coloured the zones. Strong uptrends should stay above 60, strong downtrends should stay below 40. The zone in between 40-60 I've called the transition zone. MFI often stays here in consolidation periods, and in the last leg of a cycle/trend the MFI will often drop into this zone after being above 60 or below 40. This is a great sign that you should get out and start looking to reverse your position. Hopefully it helps to spot divergences as well.
3. Added alerts based on an overbought/oversold cross. Also added an alert for when either condition is triggered, so hopefully that's useful for those struggling with low alert limits. Feel free to change the overbought/oversold levels, the alerts + crossover visual are set to adapt.
Like any indicator, don't use this one alone. It works best paired with indicators/techniques that contradict it. You'll often see a OB/OS cross, and price will continue on it's way for many weeks more. But MFI is a great tool for identifying upcoming trend changes.
Any queries please comment or PM me.
Cheers,
RJR

Average Directional Index with DI SpreadThis indicator converts conventional triple lined ADX, DI+ and DI- into two lines. First line is the
original ADX line and second line is obtained by subtracting DI- from DI+ which named DI Spread(DIS)
If ADX is greater than 20 there is a trend and if greater than 40 there is a strong trend but ADX does not tell
the trend direction
To determine trend direction, DIS can be used with ADX; Sımply; If DIS is greater than 0, it is an uptrend and If DIS
is less than 0, it is a downtrend.
To sum up;
If ADX is greater than 20 and especially greater than 40 with positive DIS value, this implies an uptrend.
If ADX is greater than 20 and especially greater than 40 with negative DIS value, this implies a downtrend.
*Because of coloration and reference levels used, this indicator is really simple and efficient to analyze trend direction.

90009If( MDI(14)>40 AND ADX(14)>40 AND PDI(14)<15 AND RSI(14)<30,1,0)
;If( MDI(14)<15 AND ADX(14)<15 AND PDI(14)>40 AND RSI(14)>70,-1,0)
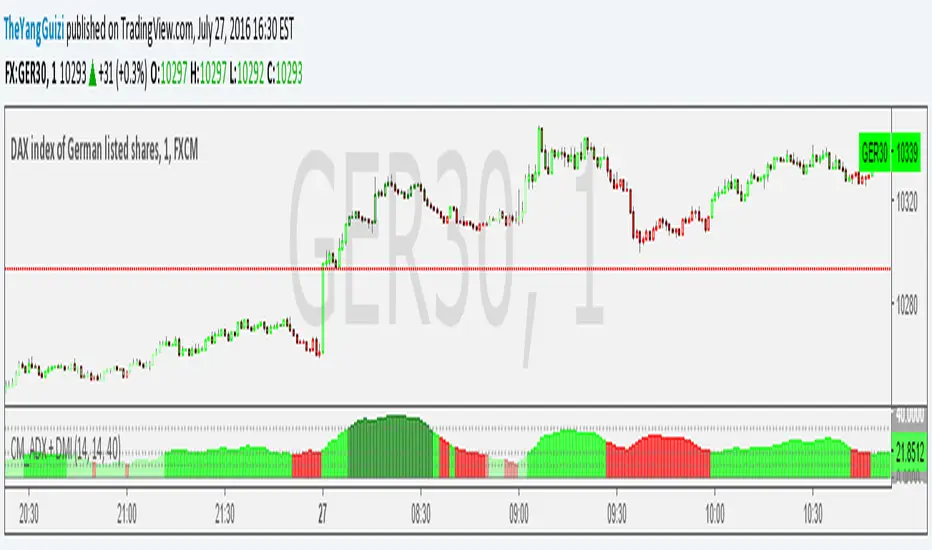
CM_ADX+DMI ModMashed together Chris Moody's ADX thing with his DMI thing.
So you can see trend strength + direction
green-ish = uptrend-ish//red-ish = downtrend-ish
Colors can be adjusted though.
below 10 = gray, not much going on
10 - 20 = light green/light red, could be the beginning o something
20 - 40 = bright green / bright red, something is going on
above 40 = dark green, dark red, exhaustion (default is 40, can be adjusted to whatever)
Indicators: Volume Zone Indicator & Price Zone IndicatorVolume Zone Indicator (VZO) and Price Zone Indicator (PZO) are by Waleed Aly Khalil.
Volume Zone Indicator (VZO)
------------------------------------------------------------
VZO is a leading volume oscillator that evaluates volume in relation to the direction of the net price change on each bar.
A value of 40 or above shows bullish accumulation. Low values (< 40) are bearish. Near zero or between +/- 20, the market is either in consolidation or near a break out. When VZO is near +/- 60, an end to the bull/bear run should be expected soon. If that run has been opposite to the long term price trend direction, then a reversal often will occur.
Traditional way of looking at this also works:
* +/- 40 levels are overbought / oversold
* +/- 60 levels are extreme overbought / oversold
More info:
drive.google.com
Price Zone Indicator (PZO)
------------------------------------------------------------
PZO is interpreted the same way as VZO (same formula with "close" substituted for "volume").
Chart Markings
------------------------------------------------------------
In the chart above,
* The red circles indicate a run-end (or reversal) zones (VZO +/- 60).
* Blue rectangle shows the consolidation zone (VZO betwen +/- 20)
I have been trying out VZO only for a week now, but I think this has lot of potential. Give it a try, let me know what you think.

Buying Climax + Spring [Darwinian]Buying Climax + Spring Indicator
Overview
Advanced Wyckoff-based indicator that identifies potential market reversals through **Buying Climax** patterns (exhaustion tops) and **Spring** patterns (accumulation bottoms). Designed for traders seeking high-probability reversal signals with strict uptrend validation.
---
Method
🔴 Buying Climax Detection
Identifies exhaustion patterns at market tops using multi-condition analysis:
**Base Buying Climax (Red Triangle)**
- Volume spike > 1.8x average
- Range expansion > 1.8x average
- New 20-bar high reached
- Close finishes in lower 30% of bar range
- **Strict uptrend validation**: Price must be 30%+ above 20-day low
**Enhanced Buying Climax (Maroon Triangle)**
- All Base BC conditions PLUS:
- Gap up from previous high
- Intraday fade (close < open and below midpoint)
- **Higher confidence reversal signal**
🟢 Wyckoff Spring Detection
Identifies accumulation patterns at support levels:
- Price breaks below recent pivot low (false breakdown)
- Close recovers above pivot level (rejection)
- Occurs at trading range low
- Optional volume confirmation (1.5x+ average)
- Limited to 3 attempts per pivot (prevents over-signaling)
✅ Uptrend Validation Filter
**Four-condition composite filter** prevents false signals in sideways/downtrending markets:
1. Close-to-close rise ≥ 5% over lookback period
2. Price structure: Close > MA(10) > MA(20)
3. Swing low significantly below current price
4. **Primary requirement**: Current high ≥ 30% above 20-day low
---
Input Tuning Guide
Buying Climax Settings:
**Volume & Range Thresholds**
- `Volume Spike Threshold`: Default 1.8x
- Lower (1.5x) = More signals, more noise
- Higher (2.0-2.5x) = Fewer but stronger exhaustion signals
- `Range Spike Threshold`: Default 1.8x
- Adjust parallel to volume threshold
- Higher values = extreme volatility required
**Pattern Detection**
- `New High Lookback`: Default 20 bars
- Shorter (10-15) = Recent highs only
- Longer (30-50) = Major breakout detection
- `Close Off High Fraction`: Default 0.3 (30%)
- Lower (0.2) = Stricter rejection requirement
- Higher (0.4-0.5) = Allow weaker intraday fades
- `Gap Threshold`: Default 0.002 (0.2%)
- Increase (0.005-0.01) for stocks with wider spreads
- Decrease (0.001) for tight-spread instruments
- `Confirmation Window`: Default 5 bars
- Shorter (3) = Faster confirmation, more false positives
- Longer (7-10) = Wait for deeper automatic reaction
Uptrend Filter Settings
**Critical for Signal Quality**
- `Minimum Rise from 20-day Low`: Default 0.30 (30%)
- **Most important parameter**
- Lower (0.20-0.25) = More signals in moderate uptrends
- Higher (0.40-0.50) = Only extreme parabolic moves
- `Pole Lookback`: Default 30 bars
- Shorter (20) = Recent momentum focus
- Longer (40-50) = Longer-term trend validation
- `Minimum Rise % for Pole`: Default 0.05 (5%)
- Adjust based on market volatility
- Higher in strong bull markets (7-10%)
Wyckoff Spring Settings
- `Pivot Length`: Default 6 bars
- Shorter (3-4) = More frequent pivots, more signals
- Longer (8-10) = Major support/resistance only
- `Volume Threshold`: Default 1.5x
- Higher (1.8-2.0x) = Stronger conviction required
- Disable volume requirement for low-volume stocks
- `Trading Range Period`: Default 20 bars
- Match to consolidation timeframe being traded
- Shorter (10-15) for intraday patterns
- Longer (30-40) for weekly consolidations
---
Recommended Workflow
1. **Start with defaults** on daily timeframe
2. **Adjust uptrend filter** first (30% rise parameter)
- Too many signals? Increase to 35-40%
- Too few? Decrease to 25%
3. **Fine-tune volume/range multipliers** based on instrument volatility
4. **Enable alerts** for real-time monitoring:
- Base BC → Initial warning
- Enhanced BC → High-priority reversal
- Confirmed BC (AR) → Strong follow-through
- Spring → Accumulation opportunity
---
Alert System
- **Base Buying Climax**: Standard exhaustion pattern detected
- **Enhanced BC (Gap+Fade)**: Higher confidence reversal setup
- **Confirmed BC (AR)**: Automatic reaction validated (price drops below BC midline)
- **Wyckoff Spring**: Accumulation pattern at support
---
Best Practices
- Combine with support/resistance analysis
- Watch for BC clusters (multiple timeframes)
- Spring patterns work best after Buying Climax distribution
- Backtest parameters on your specific instruments
- Higher timeframes (daily/weekly) = higher reliability
---
Technical Notes
- Built with Pine Script v6
- No repainting (signals finalize on bar close)
- Minimal CPU usage (optimized calculations)
- Works on all timeframes and instruments
- Overlay indicator (displays on price chart)
---
*Indicator follows classical Wyckoff methodology with modern volatility filters*

Index of Civilization DevelopmentIndex of Civilization Development Indicator
This Pine Script (version 6) creates a custom technical indicator for TradingView, titled Index of Civilization Development. It generates a composite index by averaging normalized stock market performances from a selection of global country indices. The normalization is relative to each index's 100-period simple moving average (SMA), scaled to a percentage (100% baseline). This allows for a comparable "development" or performance metric across diverse markets, potentially highlighting trends in global economic or "civilizational" progress based on equity markets.The indicator plots as a single line in a separate pane (non-overlay) and is designed to handle up to 40 symbols to respect TradingView's request.security() call limits.Key FeaturesComposite Index Calculation: Fetches the previous bar's close (close ) and its 100-period SMA for each selected symbol.
Normalizes each: (close / SMA(100)) * 100.
Averages the valid normalizations (ignores invalid/NA data) to produce a single "Index (%)" value.
Symbol Selection Modes:Top N Countries: Selects from a predefined list of the top 50 global stock indices (by market cap/importance, e.g., SPX for USA, SHCOMP for China). Options: Top 5, 15, 25, or 50.
Democratic Countries: ~38 symbols from democracies (e.g., SPX, NI225, NIFTY; based on democracy indices ≥6/10, including flawed/parliamentary systems).
Dictatorships: ~12 symbols from authoritarian/hybrid regimes (e.g., SHCOMP, TASI, IMOEX; scores <6/10).
Customization:Line color (default: blue).
Line width (1-5, default: 2).
Line style: Solid line (default), Stepline, or Circles.
Data Handling:Uses request.security() with lookahead enabled for real-time accuracy, gaps off, and invalid symbol ignoring.
Runs calculations on every bar, with max_bars_back=2000 for historical depth.
Arrays are populated only on the first bar (barstate.isfirst) for efficiency.
Predefined Symbol Lists (Examples)Top 50: SPX (USA), SHCOMP (China), NI225 (Japan), ..., BAX (Bahrain).
Democratic: Focuses on free-market democracies like USA, Japan, UK, Canada, EU nations, Australia, etc.
Dictatorships: Authoritarian markets like China, Saudi Arabia, Russia, Turkey, etc.
Usage TipsAdd to any chart (e.g., daily/weekly timeframe) to view the composite line.
Ideal for macro analysis: Compare democratic vs. authoritarian performance, or track "top world" equity health.
Potential Limitations: Relies on TradingView's symbol availability; some exotic indices (e.g., KWSEIDX) may fail if not supported. The 40-symbol cap prevents errors.
Interpretation: Values >100 indicate above-trend performance; <100 suggest underperformance relative to recent averages.
This script blends financial data with geopolitical categorization for a unique "civilization index" perspective on global markets. For modifications, ensure symbol tickers match TradingView's format.

Luxy Momentum, Trend, Bias and Breakout Indicators V7
TABLE OF CONTENTS
This is Version 7 (V7) - the latest and most optimized release. If you are using any older versions (V6, V5, V4, V3, etc.), it is highly recommended to replace them with V7.
Why This Indicator is Different
Who Should Use This
Core Components Overview
The UT Bot Trading System
Understanding the Market Bias Table
Candlestick Pattern Recognition
Visual Tools and Features
How to Use the Indicator
Performance and Optimization
FAQ
---
### CREDITS & ATTRIBUTION
This indicator implements proven trading concepts using entirely original code developed specifically for this project.
### CONCEPTUAL FOUNDATIONS
• UT Bot ATR Trailing System
- Original concept by @QuantNomad: (search "UT-Bot-Strategy"
- Our version is a complete reimplementation with significant enhancements:
- Volume-weighted momentum adjustment
- Composite stop loss from multiple S/R layers
- Multi-filter confirmation system (swing, %, 2-bar, ZLSMA)
- Full integration with multi-timeframe bias table
- Visual audit trail with freeze-on-touch
- NOTE: No code was copied - this is a complete reimplementation with enhancements.
• Standard Technical Indicators (Public Domain Formulas):
- Supertrend: ATR-based trend calculation with custom gradient fills
- MACD: Gerald Appel's formula with separation filters
- RSI: J. Welles Wilder's formula with pullback zone logic
- ADX/DMI: Custom trend strength formula inspired by Wilder's directional movement concept, reimplemented with volume weighting and efficiency metrics
- ZLSMA: Zero-lag formula enhanced with Hull MA and momentum prediction
### Custom Implementations
- Trend Strength: Inspired by Wilder's ADX concept but using volume-weighted pressure calculation and efficiency metrics (not traditional +DI/-DI smoothing)
- All code implementations are original
### ORIGINAL FEATURES (70%+ of codebase)
- Multi-Timeframe Bias Table with live updates
- Risk Management System (R-multiple TPs, freeze-on-touch)
- Opening Range Breakout tracker with session management
- Composite Stop Loss calculator using 6+ S/R layers
- Performance optimization system (caching, conditional calcs)
- VIX Fear Index integration
- Previous Day High/Low auto-detection
- Candlestick pattern recognition with interactive tooltips
- Smart label and visual management
- All UI/UX design and table architecture
### DEVELOPMENT PROCESS
**AI Assistance:** This indicator was developed over 2+ months with AI assistance (ChatGPT/Claude) used for:
- Writing Pine Script code based on design specifications
- Optimizing performance and fixing bugs
- Ensuring Pine Script v6 compliance
- Generating documentation
**Author's Role:** All trading concepts, system design, feature selection, integration logic, and strategic decisions are original work by the author. The AI was a coding tool, not the system designer.
**Transparency:** We believe in full disclosure - this project demonstrates how AI can be used as a powerful development tool while maintaining creative and strategic ownership.
---
1. WHY THIS INDICATOR IS DIFFERENT
Most traders use multiple separate indicators on their charts, leading to cluttered screens, conflicting signals, and analysis paralysis. The Suite solves this by integrating proven technical tools into a single, cohesive system.
Key Advantages:
All-in-One Design: Instead of loading 5-10 separate indicators, you get everything in one optimized script. This reduces chart clutter and improves TradingView performance.
Multi-Timeframe Bias Table: Unlike standard indicators that only show the current timeframe, the Bias Table aggregates trend signals across multiple timeframes simultaneously. See at a glance whether 1m, 5m, 15m, 1h are aligned bullish or bearish - no more switching between charts.
Smart Confirmations: The indicator doesn't just give signals - it shows you WHY. Every entry has multiple layers of confirmation (MA cross, MACD momentum, ADX strength, RSI pullback, volume, etc.) that you can toggle on/off.
Dynamic Stop Loss System: Instead of static ATR stops, the SL is calculated from multiple support/resistance layers: UT trailing line, Supertrend, VWAP, swing structure, and MA levels. This creates more intelligent, price-action-aware stops.
R-Multiple Take Profits: Built-in TP system calculates targets based on your initial risk (1R, 1.5R, 2R, 3R). Lines freeze when touched with visual checkmarks, giving you a clean audit trail of partial exits.
Educational Tooltips Everywhere: Every single input has detailed tooltips explaining what it does, typical values, and how it impacts trading. You're not guessing - you're learning as you configure.
Performance Optimized: Smart caching, conditional calculations, and modular design mean the indicator runs fast despite having 15+ features. Turn off what you don't use for even better performance.
No Repainting: All signals respect bar close. Alerts fire correctly. What you see in history is what you would have gotten in real-time.
What Makes It Unique:
Integrated UT Bot + Bias Table: No other indicator combines UT Bot's ATR trailing system with a live multi-timeframe dashboard. You get precision entries with macro trend context.
Candlestick Pattern Recognition with Interactive Tooltips: Patterns aren't just marked - hover over any emoji for a full explanation of what the pattern means and how to trade it.
Opening Range Breakout Tracker: Built-in ORB system for intraday traders with customizable session times and real-time status updates in the Bias Table.
Previous Day High/Low Auto-Detection: Automatically plots PDH/PDL on intraday charts with theme-aware colors. Updates daily without manual input.
Dynamic Row Labels in Bias Table: The table shows your actual settings (e.g., "EMA 10 > SMA 20") not generic labels. You know exactly what's being evaluated.
Modular Filter System: Instead of forcing a fixed methodology, the indicator lets you build your own strategy. Start with just UT Bot, add filters one at a time, test what works for your style.
---
2. WHO WHOULD USE THIS
Designed For:
Intermediate to Advanced Traders: You understand basic technical analysis (MAs, RSI, MACD) and want to combine multiple confirmations efficiently. This isn't a "one-click profit" system - it's a professional toolkit.
Multi-Timeframe Traders: If you trade one asset but check multiple timeframes for confirmation (e.g., enter on 5m after checking 15m and 1h alignment), the Bias Table will save you hours every week.
Trend Followers: The indicator excels at identifying and following trends using UT Bot, Supertrend, and MA systems. If you trade breakouts and pullbacks in trending markets, this is built for you.
Intraday and Swing Traders: Works equally well on 5m-1h charts (day trading) and 4h-D charts (swing trading). Scalpers can use it too with appropriate settings adjustments.
Discretionary Traders: This isn't a black-box system. You see all the components, understand the logic, and make final decisions. Perfect for traders who want tools, not automation.
Works Across All Markets:
Stocks (US, international)
Cryptocurrency (24/7 markets supported)
Forex pairs
Indices (SPY, QQQ, etc.)
Commodities
NOT Ideal For :
Complete Beginners: If you don't know what a moving average or RSI is, start with basics first. This indicator assumes foundational knowledge.
Algo Traders Seeking Black Box: This is discretionary. Signals require context and confirmation. Not suitable for blind automated execution.
Mean-Reversion Only Traders: The indicator is trend-following at its core. While VWAP bands support mean-reversion, the primary methodology is trend continuation.
---
3. CORE COMPONENTS OVERVIEW
The indicator combines these proven systems:
Trend Analysis:
Moving Averages: Four customizable MAs (Fast, Medium, Medium-Long, Long) with six types to choose from (EMA, SMA, WMA, VWMA, RMA, HMA). Mix and match for your style.
Supertrend: ATR-based trend indicator with unique gradient fill showing trend strength. One-sided ribbon visualization makes it easier to see momentum building or fading.
ZLSMA : Zero-lag linear-regression smoothed moving average. Reduces lag compared to traditional MAs while maintaining smooth curves.
Momentum & Filters:
MACD: Standard MACD with separation filter to avoid weak crossovers.
RSI: Pullback zone detection - only enter longs when RSI is in your defined "buy zone" and shorts in "sell zone".
ADX/DMI: Trend strength measurement with directional filter. Ensures you only trade when there's actual momentum.
Volume Filter: Relative volume confirmation - require above-average volume for entries.
Donchian Breakout: Optional channel breakout requirement.
Signal Systems:
UT Bot: The primary signal generator. ATR trailing stop that adapts to volatility and gives clear entry/exit points.
Base Signals: MA cross system with all the above filters applied. More conservative than UT Bot alone.
Market Bias Table: Multi-timeframe dashboard showing trend alignment across 7 timeframes plus macro bias (3-day, weekly, monthly, quarterly, VIX).
Candlestick Patterns: Six major reversal patterns auto-detected with interactive tooltips.
ORB Tracker: Opening range high/low with breakout status (intraday only).
PDH/PDL: Previous day levels plotted automatically on intraday charts.
VWAP + Bands : Session-anchored VWAP with up to three standard deviation band pairs.
---
4. THE UT BOT TRADING SYSTEM
The UT Bot is the heart of the indicator's signal generation. It's an advanced ATR trailing stop that adapts to market volatility.
Why UT Bot is Superior to Fixed Stops:
Traditional ATR stops use a fixed multiplier (e.g., "stop = entry - 2×ATR"). UT Bot is smarter:
It TRAILS the stop as price moves in your favor
It WIDENS during high volatility to avoid premature stops
It TIGHTENS during consolidation to lock in profits
It FLIPS when price breaks the trailing line, signaling reversals
Visual Elements You'll See:
Orange Trailing Line: The actual UT stop level that adapts bar-by-bar
Buy/Sell Labels: Aqua triangle (long) or orange triangle (short) when the line flips
ENTRY Line: Horizontal line at your entry price (optional, can be turned off)
Suggested Stop Loss: A composite SL calculated from multiple support/resistance layers:
- UT trailing line
- Supertrend level
- VWAP
- Swing structure (recent lows/highs)
- Long-term MA (200)
- ATR-based floor
Take Profit Lines: TP1, TP1.5, TP2, TP3 based on R-multiples. When price touches a TP, it's marked with a checkmark and the line freezes for audit trail purposes.
Status Messages: "SL Touched ❌" or "SL Frozen" when the trade leg completes.
How UT Bot Differs from Other ATR Systems:
Multiple Filters Available: You can require 2-bar confirmation, minimum % price change, swing structure alignment, or ZLSMA directional filter. Most UT implementations have none of these.
Smart SL Calculation: Instead of just using the UT line as your stop, the indicator suggests a better SL based on actual support/resistance. This prevents getting stopped out by wicks while keeping risk controlled.
Visual Audit Trail: All SL/TP lines freeze when touched with clear markers. You can review your trades weeks later and see exactly where entries, stops, and targets were.
Performance Options: "Draw UT visuals only on bar close" lets you reduce rendering load without affecting logic or alerts - critical for slower machines or 1m charts.
Trading Logic:
UT Bot flips direction (Buy or Sell signal appears)
Check Bias Table for multi-timeframe confirmation
Optional: Wait for Base signal or candlestick pattern
Enter at signal bar close or next bar open
Place stop at "Suggested Stop Loss" line
Scale out at TP levels (TP1, TP2, TP3)
Exit remaining position on opposite UT signal or stop hit
---
5. UNDERSTANDING THE MARKET BIAS TABLE
This is the indicator's unique multi-timeframe intelligence layer. Instead of looking at one chart at a time, the table aggregates signals across seven timeframes plus macro trend bias.
Why Multi-Timeframe Analysis Matters:
Professional traders check higher and lower timeframes for context:
Is the 1h uptrend aligning with my 5m entry?
Are all short-term timeframes bullish or just one?
Is the daily trend supportive or fighting me?
Doing this manually means opening multiple charts, checking each indicator, and making mental notes. The Bias Table does it automatically in one glance.
Table Structure:
Header Row:
On intraday charts: 1m, 5m, 15m, 30m, 1h, 2h, 4h (toggle which ones you want)
On daily+ charts: D, W, M (automatic)
Green dot next to title = live updating
Headline Rows - Macro Bias:
These show broad market direction over longer periods:
3 Day Bias: Trend over last 3 trading sessions (uses 1h data)
Weekly Bias: Trend over last 5 trading sessions (uses 4h data)
Monthly Bias: Trend over last 30 daily bars
Quarterly Bias: Trend over last 13 weekly bars
VIX Fear Index: Market regime based on VIX level - bullish when low, bearish when high
Opening Range Breakout: Status of price vs. session open range (intraday only)
These rows show text: "BULLISH", "BEARISH", or "NEUTRAL"
Indicator Rows - Technical Signals:
These evaluate your configured indicators across all active timeframes:
Fast MA > Medium MA (shows your actual MA settings, e.g., "EMA 10 > SMA 20")
Price > Long MA (e.g., "Price > SMA 200")
Price > VWAP
MACD > Signal
Supertrend (up/down/neutral)
ZLSMA Rising
RSI In Zone
ADX ≥ Minimum
These rows show emojis: GREEB (bullish), RED (bearish), GRAY/YELLOW (neutral/NA)
AVG Column:
Shows percentage of active timeframes that are bullish for that row. This is the KEY metric:
AVG > 70% = strong multi-timeframe bullish alignment
AVG 40-60% = mixed/choppy, no clear trend
AVG < 30% = strong multi-timeframe bearish alignment
How to Use the Table:
For a long trade:
Check AVG column - want to see > 60% ideally
Check headline bias rows - want to see BULLISH, not BEARISH
Check VIX row - bullish market regime preferred
Check ORB row (intraday) - want ABOVE for longs
Scan indicator rows - more green = better confirmation
For a short trade:
Check AVG column - want to see < 40% ideally
Check headline bias rows - want to see BEARISH, not BULLISH
Check VIX row - bearish market regime preferred
Check ORB row (intraday) - want BELOW for shorts
Scan indicator rows - more red = better confirmation
When AVG is 40-60%:
Market is choppy, mixed signals. Either stay out or reduce position size significantly. These are low-probability environments.
Unique Features:
Dynamic Labels: Row names show your actual settings (e.g., "EMA 10 > SMA 20" not generic "Fast > Slow"). You know exactly what's being evaluated.
Customizable Rows: Turn off rows you don't care about. Only show what matters to your strategy.
Customizable Timeframes: On intraday charts, disable 1m or 4h if you don't trade them. Reduces calculation load by 20-40%.
Automatic HTF Handling: On Daily/Weekly/Monthly charts, the table automatically switches to D/W/M columns. No configuration needed.
Performance Smart: "Hide BIAS table on 1D or above" option completely skips all table calculations on higher timeframes if you only trade intraday.
---
6. CANDLESTICK PATTERN RECOGNITION
The indicator automatically detects six major reversal patterns and marks them with emojis at the relevant bars.
Why These Six Patterns:
These are the most statistically significant reversal patterns according to trading literature:
High win rate when appearing at support/resistance
Clear visual structure (not subjective)
Work across all timeframes and assets
Studied extensively by institutions
The Patterns:
Bullish Patterns (appear at bottoms):
Bullish Engulfing: Green candle completely engulfs prior red candle's body. Strong reversal signal.
Hammer: Small body with long lower wick (at least 2× body size). Shows rejection of lower prices by buyers.
Morning Star: Three-candle pattern (large red → small indecision → large green). Very strong bottom reversal.
Bearish Patterns (appear at tops):
Bearish Engulfing: Red candle completely engulfs prior green candle's body. Strong reversal signal.
Shooting Star: Small body with long upper wick (at least 2× body size). Shows rejection of higher prices by sellers.
Evening Star: Three-candle pattern (large green → small indecision → large red). Very strong top reversal.
Interactive Tooltips:
Unlike most pattern indicators that just draw shapes, this one is educational:
Hover your mouse over any pattern emoji
A tooltip appears explaining: what the pattern is, what it means, when it's most reliable, and how to trade it
No need to memorize - learn as you trade
Noise Filter:
"Min candle body % to filter noise" setting prevents false signals:
Patterns require minimum body size relative to price
Filters out tiny candles that don't represent real buying/selling pressure
Adjust based on asset volatility (higher % for crypto, lower for low-volatility stocks)
How to Trade Patterns:
Patterns are NOT standalone entry signals. Use them as:
Confirmation: UT Bot gives signal + pattern appears = stronger entry
Reversal Warning: In a trade, opposite pattern appears = consider tightening stop or taking profit
Support/Resistance Validation: Pattern at key level (PDH, VWAP, MA 200) = level is being respected
Best combined with:
UT Bot or Base signal in same direction
Bias Table alignment (AVG > 60% or < 40%)
Appearance at obvious support/resistance
---
7. VISUAL TOOLS AND FEATURES
VWAP (Volume Weighted Average Price):
Session-anchored VWAP with standard deviation bands. Shows institutional "fair value" for the trading session.
Anchor Options: Session, Day, Week, Month, Quarter, Year. Choose based on your trading timeframe.
Bands: Up to three pairs (X1, X2, X3) showing statistical deviation. Price at outer bands often reverses.
Auto-Hide on HTF: VWAP hides on Daily/Weekly/Monthly charts automatically unless you enable anchored mode.
Use VWAP as:
Directional bias (above = bullish, below = bearish)
Mean reversion levels (outer bands)
Support/resistance (the VWAP line itself)
Previous Day High/Low:
Automatically plots yesterday's high and low on intraday charts:
Updates at start of each new trading day
Theme-aware colors (dark text for light charts, light text for dark charts)
Hidden automatically on Daily/Weekly/Monthly charts
These levels are critical for intraday traders - institutions watch them closely as support/resistance.
Opening Range Breakout (ORB):
Tracks the high/low of the first 5, 15, 30, or 60 minutes of the trading session:
Customizable session times (preset for NYSE, LSE, TSE, or custom)
Shows current breakout status in Bias Table row (ABOVE, BELOW, INSIDE, BUILDING)
Intraday only - auto-disabled on Daily+ charts
ORB is a classic day trading strategy - breakout above opening range often leads to continuation.
Extra Labels:
Change from Open %: Shows how far price has moved from session open (intraday) or daily open (HTF). Green if positive, red if negative.
ADX Badge: Small label at bottom of last bar showing current ADX value. Green when above your minimum threshold, red when below.
RSI Badge: Small label at top of last bar showing current RSI value with zone status (buy zone, sell zone, or neutral).
These labels provide quick at-a-glance confirmation without needing separate indicator windows.
---
8. HOW TO USE THE INDICATOR
Step 1: Add to Chart
Load the indicator on your chosen asset and timeframe
First time: Everything is enabled by default - the chart will look busy
Don't panic - you'll turn off what you don't need
Step 2: Start Simple
Turn OFF everything except:
UT Bot labels (keep these ON)
Bias Table (keep this ON)
Moving Averages (Fast and Medium only)
Suggested Stop Loss and Take Profits
Hide everything else initially. Get comfortable with the basic UT Bot + Bias Table workflow first.
Step 3: Learn the Core Workflow
UT Bot gives a Buy or Sell signal
Check Bias Table AVG column - do you have multi-timeframe alignment?
If yes, enter the trade
Place stop at Suggested Stop Loss line
Scale out at TP levels
Exit on opposite UT signal
Trade this simple system for a week. Get a feel for signal frequency and win rate with your settings.
Step 4: Add Filters Gradually
If you're getting too many losing signals (whipsaws in choppy markets), add filters one at a time:
Try: "Require 2-Bar Trend Confirmation" - wait for 2 bars to confirm direction
Try: ADX filter with minimum threshold - only trade when trend strength is sufficient
Try: RSI pullback filter - only enter on pullbacks, not chasing
Try: Volume filter - require above-average volume
Add one filter, test for a week, evaluate. Repeat.
Step 5: Enable Advanced Features (Optional)
Once you're profitable with the core system, add:
Supertrend for additional trend confirmation
Candlestick patterns for reversal warnings
VWAP for institutional anchor reference
ORB for intraday breakout context
ZLSMA for low-lag trend following
Step 6: Optimize Settings
Every setting has a detailed tooltip explaining what it does and typical values. Hover over any input to read:
What the parameter controls
How it impacts trading
Suggested ranges for scalping, day trading, and swing trading
Start with defaults, then adjust based on your results and style.
Step 7: Set Up Alerts
Right-click chart → Add Alert → Condition: "Luxy Momentum v6" → Choose:
"UT Bot — Buy" for long entries
"UT Bot — Sell" for short entries
"Base Long/Short" for filtered MA cross signals
Optionally enable "Send real-time alert() on UT flip" in settings for immediate notifications.
Common Workflow Variations:
Conservative Trader:
UT signal + Base signal + Candlestick pattern + Bias AVG > 70%
Enter only at major support/resistance
Wider UT sensitivity, multiple filters
Aggressive Trader:
UT signal + Bias AVG > 60%
Enter immediately, no waiting
Tighter UT sensitivity, minimal filters
Swing Trader:
Focus on Daily/Weekly Bias alignment
Ignore intraday noise
Use ORB and PDH/PDL less (or not at all)
Wider stops, patient approach
---
9. PERFORMANCE AND OPTIMIZATION
The indicator is optimized for speed, but with 15+ features running simultaneously, chart load time can add up. Here's how to keep it fast:
Biggest Performance Gains:
Disable Unused Timeframes: In "Time Frames" settings, turn OFF any timeframe you don't actively trade. Each disabled TF saves 10-15% calculation time. If you only day trade 5m, 15m, 1h, disable 1m, 2h, 4h.
Hide Bias Table on Daily+: If you only trade intraday, enable "Hide BIAS table on 1D or above". This skips ALL table calculations on higher timeframes.
Draw UT Visuals Only on Bar Close: Reduces intrabar rendering of SL/TP/Entry lines. Has ZERO impact on logic or alerts - purely visual optimization.
Additional Optimizations:
Turn off VWAP bands if you don't use them
Disable candlestick patterns if you don't trade them
Turn off Supertrend fill if you find it distracting (keep the line)
Reduce "Limit to 10 bars" for SL/TP lines to minimize line objects
Performance Features Built-In:
Smart Caching: Higher timeframe data (3-day bias, weekly bias, etc.) updates once per day, not every bar
Conditional Calculations: Volume filter only calculates when enabled. Swing filter only runs when enabled. Nothing computes if turned off.
Modular Design: Every component is independent. Turn off what you don't need without breaking other features.
Typical Load Times:
5m chart, all features ON, 7 timeframes: ~2-3 seconds
5m chart, core features only, 3 timeframes: ~1 second
1m chart, all features: ~4-5 seconds (many bars to calculate)
If loading takes longer, you likely have too many indicators on the chart total (not just this one).
---
10. FAQ
Q: How is this different from standard UT Bot indicators?
A: Standard UT Bot (originally by @QuantNomad) is just the ATR trailing line and flip signals. This implementation adds:
- Volume weighting and momentum adjustment to the trailing calculation
- Multiple confirmation filters (swing, %, 2-bar, ZLSMA)
- Smart composite stop loss system from multiple S/R layers
- R-multiple take profit system with freeze-on-touch
- Integration with multi-timeframe Bias Table
- Visual audit trail with checkmarks
Q: Can I use this for automated trading?
A: The indicator is designed for discretionary trading. While it has clear signals and alerts, it's not a mechanical system. Context and judgment are required.
Q: Does it repaint?
A: No. All signals respect bar close. UT Bot logic runs intrabar but signals only trigger on confirmed bars. Alerts fire correctly with no lookahead.
Q: Do I need to use all the features?
A: Absolutely not. The indicator is modular. Many profitable traders use just UT Bot + Bias Table + Moving Averages. Start simple, add complexity only if needed.
Q: How do I know which settings to use?
A: Every single input has a detailed tooltip. Hover over any setting to see:
What it does
How it affects trading
Typical values for scalping, day trading, swing trading
Start with defaults, adjust gradually based on results.
Q: Can I use this on crypto 24/7 markets?
A: Yes. ORB will not work (no defined session), but everything else functions normally. Use "Day" anchor for VWAP instead of "Session".
Q: The Bias Table is blank or not showing.
A: Check:
"Show Table" is ON
Table position isn't overlapping another indicator's table (change position)
At least one row is enabled
"Hide BIAS table on 1D or above" is OFF (if on Daily+ chart)
Q: Why are candlestick patterns not appearing?
A: Patterns are relatively rare by design - they only appear at genuine reversal points. Check:
Pattern toggles are ON
"Min candle body %" isn't too high (try 0.05-0.10)
You're looking at a chart with actual reversals (not strong trending market)
Q: UT Bot is too sensitive/not sensitive enough.
A: Adjust "Sensitivity (Key×ATR)". Lower number = tighter stop, more signals. Higher number = wider stop, fewer signals. Read the tooltip for guidance.
Q: Can I get alerts for the Bias Table?
A: The Bias Table is a dashboard for visual analysis, not a signal generator. Set alerts on UT Bot or Base signals, then manually check Bias Table for confirmation.
Q: Does this work on stocks with low volume?
A: Yes, but turn OFF the volume filter. Low volume stocks will never meet relative volume requirements.
Q: How often should I check the Bias Table?
A: Before every entry. It takes 2 seconds to glance at the AVG column and headline rows. This one check can save you from fighting the trend.
Q: What if UT signal and Base signal disagree?
A: UT Bot is more aggressive (ATR trailing). Base signals are more conservative (MA cross + filters). If they disagree, either:
Wait for both to align (safest)
Take the UT signal but with smaller size (aggressive)
Skip the trade (conservative)
There's no "right" answer - depends on your risk tolerance.
---
FINAL NOTES
The indicator gives you an edge. How you use that edge determines results.
For questions, feedback, or support, comment on the indicator page or message the author.
Happy Trading!

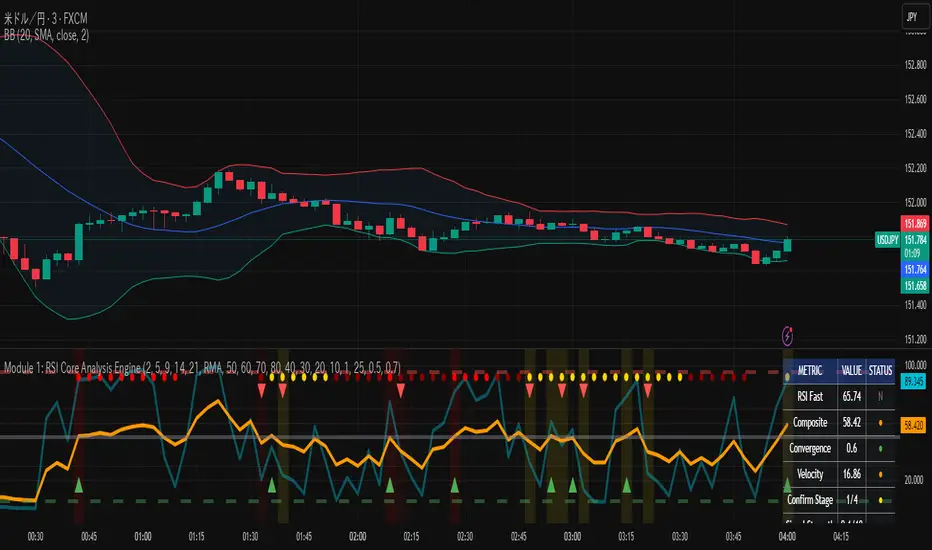
RSI Core Analysis EngineHI traders
This tool employs a higher-sensitivity RSI than conventional settings to capture market shifts earlier.
When the Ultra Fast RSI (UF) approaches upper or lower extremes, short-term profit-taking or pullbacks tend to occur, and a crossover between UF and the Composite RSI can serve as a signal of a regime change.
However, in strong trends the RSI can remain pinned for extended periods, so combine it with ADX, volume, and volatility measures to improve accuracy.
While early detection is an advantage, it also increases noise. This tool uses a four-stage confirmation process (DMI/ADX → MACD/Stochastics/RSI acceleration → five-layer alignment) and quality/confidence scores to filter for higher-expectancy setups.
It will not be effective in every market condition. Use it with predefined stop-losses and prudent position sizing.
-------------------------------------------------------------------------------------------------------
Strongly recommended preset (because the indicator packs many features):
Step 1 — Inputs tab
Center Level: 50
OB1: 60, OB2: 70, OB3: 95
OS1: 40, OS2: 30, OS3: 5
Step 2 — Style tab
✅ Ultra Fast RSI — Thickest
✖ Fast RSI
✖ Medium RSI
✖ Standard RSI
✖ Slow RSI
✅ Composite RSI — Thickest
✅ Stage Indicator
✖ RSI Velocity
✖ RSI Acceleration
✅ Quality Score
✅ Bullish Cross
✅ Bearish Cross
✅ Strong Signal Background
Levels:
・✅ Center 50 — Thickest
・✅ OB1 60, OB2 70, OB3 95 (thicker)
・✅ OS1 40, OS2 30, OS3 5 (thicker)
-------------------------------------------------------------------------------------------------------------
thats enough
have a nice trade
Stochastic Enhanced [DCAUT]█ Stochastic Enhanced
📊 ORIGINALITY & INNOVATION
The Stochastic Enhanced indicator builds upon George Lane's classic momentum oscillator (developed in the late 1950s) by providing comprehensive smoothing algorithm flexibility. While traditional implementations limit users to Simple Moving Average (SMA) smoothing, this enhanced version offers 21 advanced smoothing algorithms, allowing traders to optimize the indicator's characteristics for different market conditions and trading styles.
Key Improvements:
Extended from single SMA smoothing to 21 professional-grade algorithms including adaptive filters (KAMA, FRAMA), zero-lag methods (ZLEMA, T3), and advanced digital filters (Kalman, Laguerre)
Maintains backward compatibility with traditional Stochastic calculations through SMA default setting
Unified smoothing algorithm applies to both %K and %D lines for consistent signal processing characteristics
Enhanced visual feedback with clear color distinction and background fill highlighting for intuitive signal recognition
Comprehensive alert system covering crossovers and zone entries for systematic trade management
Differentiation from Traditional Stochastic:
Traditional Stochastic indicators use fixed SMA smoothing, which introduces consistent lag regardless of market volatility. This enhanced version addresses the limitation by offering adaptive algorithms that adjust to market conditions (KAMA, FRAMA), reduce lag without sacrificing smoothness (ZLEMA, T3, HMA), or provide superior noise filtering (Kalman Filter, Laguerre filters). The flexibility helps traders balance responsiveness and stability according to their specific needs.
📐 MATHEMATICAL FOUNDATION
Core Stochastic Calculation:
The Stochastic Oscillator measures the position of the current close relative to the high-low range over a specified period:
Step 1: Raw %K Calculation
%K_raw = 100 × (Close - Lowest Low) / (Highest High - Lowest Low)
Where:
Close = Current closing price
Lowest Low = Lowest low over the %K Length period
Highest High = Highest high over the %K Length period
Result ranges from 0 (close at period low) to 100 (close at period high)
Step 2: Smoothed %K Calculation
%K = MA(%K_raw, K Smoothing Period, MA Type)
Where:
MA = Selected moving average algorithm (SMA, EMA, etc.)
K Smoothing = 1 for Fast Stochastic, 3+ for Slow Stochastic
Traditional Fast Stochastic uses %K_raw directly without smoothing
Step 3: Signal Line %D Calculation
%D = MA(%K, D Smoothing Period, MA Type)
Where:
%D acts as a signal line and moving average of %K
D Smoothing typically set to 3 periods in traditional implementations
Both %K and %D use the same MA algorithm for consistent behavior
Available Smoothing Algorithms (21 Options):
Standard Moving Averages:
SMA (Simple): Equal-weighted average, traditional default, consistent lag characteristics
EMA (Exponential): Recent price emphasis, faster response to changes, exponential decay weighting
RMA (Rolling/Wilder's): Smoothed average used in RSI, less reactive than EMA
WMA (Weighted): Linear weighting favoring recent data, moderate responsiveness
VWMA (Volume-Weighted): Incorporates volume data, reflects market participation intensity
Advanced Moving Averages:
HMA (Hull): Reduced lag with smoothness, uses weighted moving averages and square root period
ALMA (Arnaud Legoux): Gaussian distribution weighting, minimal lag with good noise reduction
LSMA (Least Squares): Linear regression based, fits trend line to data points
DEMA (Double Exponential): Reduced lag compared to EMA, uses double smoothing technique
TEMA (Triple Exponential): Further lag reduction, triple smoothing with lag compensation
ZLEMA (Zero-Lag Exponential): Lag elimination attempt using error correction, very responsive
TMA (Triangular): Double-smoothed SMA, very smooth but slower response
Adaptive & Intelligent Filters:
T3 (Tilson T3): Six-pass exponential smoothing with volume factor adjustment, excellent smoothness
FRAMA (Fractal Adaptive): Adapts to market fractal dimension, faster in trends, slower in ranges
KAMA (Kaufman Adaptive): Efficiency ratio based adaptation, responds to volatility changes
McGinley Dynamic: Self-adjusting mechanism following price more accurately, reduced whipsaws
Kalman Filter: Optimal estimation algorithm from aerospace engineering, dynamic noise filtering
Advanced Digital Filters:
Ultimate Smoother: Advanced digital filter design, superior noise rejection with minimal lag
Laguerre Filter: Time-domain filter with N-order implementation, adjustable lag characteristics
Laguerre Binomial Filter: 6-pole Laguerre filter, extremely smooth output for long-term analysis
Super Smoother: Butterworth filter implementation, removes high-frequency noise effectively
📊 COMPREHENSIVE SIGNAL ANALYSIS
Absolute Level Interpretation (%K Line):
%K Above 80: Overbought condition, price near period high, potential reversal or pullback zone, caution for new long entries
%K in 70-80 Range: Strong upward momentum, bullish trend confirmation, uptrend likely continuing
%K in 50-70 Range: Moderate bullish momentum, neutral to positive outlook, consolidation or mild uptrend
%K in 30-50 Range: Moderate bearish momentum, neutral to negative outlook, consolidation or mild downtrend
%K in 20-30 Range: Strong downward momentum, bearish trend confirmation, downtrend likely continuing
%K Below 20: Oversold condition, price near period low, potential bounce or reversal zone, caution for new short entries
Crossover Signal Analysis:
%K Crosses Above %D (Bullish Cross): Momentum shifting bullish, faster line overtakes slower signal, consider long entry especially in oversold zone, strongest when occurring below 20 level
%K Crosses Below %D (Bearish Cross): Momentum shifting bearish, faster line falls below slower signal, consider short entry especially in overbought zone, strongest when occurring above 80 level
Crossover in Midrange (40-60): Less reliable signals, often in choppy sideways markets, require additional confirmation from trend or volume analysis
Multiple Failed Crosses: Indicates ranging market or choppy conditions, reduce position sizes or avoid trading until clear directional move
Advanced Divergence Patterns (%K Line vs Price):
Bullish Divergence: Price makes lower low while %K makes higher low, indicates weakening bearish momentum, potential trend reversal upward, more reliable when %K in oversold zone
Bearish Divergence: Price makes higher high while %K makes lower high, indicates weakening bullish momentum, potential trend reversal downward, more reliable when %K in overbought zone
Hidden Bullish Divergence: Price makes higher low while %K makes lower low, indicates trend continuation in uptrend, bullish trend strength confirmation
Hidden Bearish Divergence: Price makes lower high while %K makes higher high, indicates trend continuation in downtrend, bearish trend strength confirmation
Momentum Strength Analysis (%K Line Slope):
Steep %K Slope: Rapid momentum change, strong directional conviction, potential for extended moves but also increased reversal risk
Gradual %K Slope: Steady momentum development, sustainable trends more likely, lower probability of sharp reversals
Flat or Horizontal %K: Momentum stalling, potential reversal or consolidation ahead, wait for directional break before committing
%K Oscillation Within Range: Indicates ranging market, sideways price action, better suited for range-trading strategies than trend following
🎯 STRATEGIC APPLICATIONS
Mean Reversion Strategy (Range-Bound Markets):
Identify ranging market conditions using price action or Bollinger Bands
Wait for Stochastic to reach extreme zones (above 80 for overbought, below 20 for oversold)
Enter counter-trend position when %K crosses %D in extreme zone (sell on bearish cross above 80, buy on bullish cross below 20)
Set profit targets near opposite extreme or midline (50 level)
Use tight stop-loss above recent swing high/low to protect against breakout scenarios
Exit when Stochastic reaches opposite extreme or %K crosses %D in opposite direction
Trend Following with Momentum Confirmation:
Identify primary trend direction using higher timeframe analysis or moving averages
Wait for Stochastic pullback to oversold zone (<20) in uptrend or overbought zone (>80) in downtrend
Enter in trend direction when %K crosses %D confirming momentum shift (bullish cross in uptrend, bearish cross in downtrend)
Use wider stops to accommodate normal trend volatility
Add to position on subsequent pullbacks showing similar Stochastic pattern
Exit when Stochastic shows opposite extreme with failed cross or bearish/bullish divergence
Divergence-Based Reversal Strategy:
Scan for divergence between price and Stochastic at swing highs/lows
Confirm divergence with at least two price pivots showing divergent Stochastic readings
Wait for %K to cross %D in direction of anticipated reversal as entry trigger
Enter position in divergence direction with stop beyond recent swing extreme
Target profit at key support/resistance levels or Fibonacci retracements
Scale out as Stochastic reaches opposite extreme zone
Multi-Timeframe Momentum Alignment:
Analyze Stochastic on higher timeframe (4H or Daily) for primary trend bias
Switch to lower timeframe (1H or 15M) for precise entry timing
Only take trades where lower timeframe Stochastic signal aligns with higher timeframe momentum direction
Higher timeframe Stochastic in bullish zone (>50) = only take long entries on lower timeframe
Higher timeframe Stochastic in bearish zone (<50) = only take short entries on lower timeframe
Exit when lower timeframe shows counter-signal or higher timeframe momentum reverses
Zone Transition Strategy:
Monitor Stochastic for transitions between zones (oversold to neutral, neutral to overbought, etc.)
Enter long when Stochastic crosses above 20 (exiting oversold), signaling momentum shift from bearish to neutral/bullish
Enter short when Stochastic crosses below 80 (exiting overbought), signaling momentum shift from bullish to neutral/bearish
Use zone midpoint (50) as dynamic support/resistance for position management
Trail stops as Stochastic advances through favorable zones
Exit when Stochastic fails to maintain momentum and reverses back into prior zone
📋 DETAILED PARAMETER CONFIGURATION
%K Length (Default: 14):
Lower Values (5-9): Highly sensitive to price changes, generates more frequent signals, increased false signals in choppy markets, suitable for very short-term trading and scalping
Standard Values (10-14): Balanced sensitivity and reliability, traditional default (14) widely used,适合 swing trading and intraday strategies
Higher Values (15-21): Reduced sensitivity, smoother oscillations, fewer but potentially more reliable signals, better for position trading and lower timeframe noise reduction
Very High Values (21+): Slow response, long-term momentum measurement, fewer trading signals, suitable for weekly or monthly analysis
%K Smoothing (Default: 3):
Value 1: Fast Stochastic, uses raw %K calculation without additional smoothing, most responsive to price changes, generates earliest signals with higher noise
Value 3: Slow Stochastic (default), traditional smoothing level, reduces false signals while maintaining good responsiveness, widely accepted standard
Values 5-7: Very slow response, extremely smooth oscillations, significantly reduced whipsaws but delayed entry/exit timing
Recommendation: Default value 3 suits most trading scenarios, active short-term traders may use 1, conservative long-term positions use 5+
%D Smoothing (Default: 3):
Lower Values (1-2): Signal line closely follows %K, frequent crossover signals, useful for active trading but requires strict filtering
Standard Value (3): Traditional setting providing balanced signal line behavior, optimal for most trading applications
Higher Values (4-7): Smoother signal line, fewer crossover signals, reduced whipsaws but slower confirmation, better for trend trading
Very High Values (8+): Signal line becomes slow-moving reference, crossovers rare and highly significant, suitable for long-term position changes only
Smoothing Type Algorithm Selection:
For Trending Markets:
ZLEMA, DEMA, TEMA: Reduced lag for faster trend entry, quick response to momentum shifts, suitable for strong directional moves
HMA, ALMA: Good balance of smoothness and responsiveness, effective for clean trend following without excessive noise
EMA: Classic choice for trending markets, faster than SMA while maintaining reasonable stability
For Ranging/Choppy Markets:
Kalman Filter, Super Smoother: Superior noise filtering, reduces false signals in sideways action, helps identify genuine reversal points
Laguerre Filters: Smooth oscillations with adjustable lag, excellent for mean reversion strategies in ranges
T3, TMA: Very smooth output, filters out market noise effectively, clearer extreme zone identification
For Adaptive Market Conditions:
KAMA: Automatically adjusts to market efficiency, fast in trends and slow in congestion, reduces whipsaws during transitions
FRAMA: Adapts to fractal market structure, responsive during directional moves, conservative during uncertainty
McGinley Dynamic: Self-adjusting smoothing, follows price naturally, minimizes lag in trending markets while filtering noise in ranges
For Conservative Long-Term Analysis:
SMA: Traditional choice, predictable behavior, widely understood characteristics
RMA (Wilder's): Smooth oscillations, reduced sensitivity to outliers, consistent behavior across market conditions
Laguerre Binomial Filter: Extremely smooth output, ideal for weekly/monthly timeframe analysis, eliminates short-term noise completely
Source Selection:
Close (Default): Standard choice using closing prices, most common and widely tested
HLC3 or OHLC4: Incorporates more price information, reduces impact of sudden spikes or gaps, smoother oscillator behavior
HL2: Midpoint of high-low range, emphasizes intrabar volatility, useful for markets with wide intraday ranges
Custom Source: Can use other indicators as input (e.g., Heikin Ashi close, smoothed price), creates derivative momentum indicators
📈 PERFORMANCE ANALYSIS & COMPETITIVE ADVANTAGES
Responsiveness Characteristics:
Traditional SMA-Based Stochastic:
Fixed lag regardless of market conditions, consistent delay of approximately (K Smoothing + D Smoothing) / 2 periods
Equal treatment of trending and ranging markets, no adaptation to volatility changes
Predictable behavior but suboptimal in varying market regimes
Enhanced Version with Adaptive Algorithms:
KAMA and FRAMA reduce lag by up to 40-60% in strong trends compared to SMA while maintaining similar smoothness in ranges
ZLEMA and T3 provide near-zero lag characteristics for early entry signals with acceptable noise levels
Kalman Filter and Super Smoother offer superior noise rejection, reducing false signals in choppy conditions by estimations of 30-50% compared to SMA
Performance improvements vary by algorithm selection and market conditions
Signal Quality Improvements:
Adaptive algorithms help reduce whipsaw trades in ranging markets by adjusting sensitivity dynamically
Advanced filters (Kalman, Laguerre, Super Smoother) provide clearer extreme zone readings for mean reversion strategies
Zero-lag methods (ZLEMA, DEMA, TEMA) generate earlier crossover signals in trending markets for improved entry timing
Smoother algorithms (T3, Laguerre Binomial) reduce false extreme zone touches for more reliable overbought/oversold signals
Comparison with Standard Implementations:
Versus Basic Stochastic: Enhanced version offers 21 smoothing options versus single SMA, allowing optimization for specific market characteristics and trading styles
Versus RSI: Stochastic provides range-bound measurement (0-100) with clear extreme zones, RSI measures momentum speed, Stochastic offers clearer visual overbought/oversold identification
Versus MACD: Stochastic bounded oscillator suitable for mean reversion, MACD unbounded indicator better for trend strength, Stochastic excels in range-bound and oscillating markets
Versus CCI: Stochastic has fixed bounds (0-100) for consistent interpretation, CCI unbounded with variable extremes, Stochastic provides more standardized extreme readings across different instruments
Flexibility Advantages:
Single indicator adaptable to multiple strategies through algorithm selection rather than requiring different indicator variants
Ability to optimize smoothing characteristics for specific instruments (e.g., smoother for crypto volatility, faster for forex trends)
Multi-timeframe analysis with consistent algorithm across timeframes for coherent momentum picture
Backtesting capability with algorithm as optimization parameter for strategy development
Limitations and Considerations:
Increased complexity from multiple algorithm choices may lead to over-optimization if parameters are curve-fitted to historical data
Adaptive algorithms (KAMA, FRAMA) have adjustment periods during market regime changes where signals may be less reliable
Zero-lag algorithms sacrifice some smoothness for responsiveness, potentially increasing noise sensitivity in very choppy conditions
Performance characteristics vary significantly across algorithms, requiring understanding and testing before live implementation
Like all oscillators, Stochastic can remain in extreme zones for extended periods during strong trends, generating premature reversal signals
USAGE NOTES
This indicator is designed for technical analysis and educational purposes to provide traders with enhanced flexibility in momentum analysis. The Stochastic Oscillator has limitations and should not be used as the sole basis for trading decisions.
Important Considerations:
Algorithm performance varies with market conditions - no single smoothing method is optimal for all scenarios
Extreme zone signals (overbought/oversold) indicate potential reversal areas but not guaranteed turning points, especially in strong trends
Crossover signals may generate false entries during sideways choppy markets regardless of smoothing algorithm
Divergence patterns require confirmation from price action or additional indicators before trading
Past indicator characteristics and backtested results do not guarantee future performance
Always combine Stochastic analysis with proper risk management, position sizing, and multi-indicator confirmation
Test selected algorithm on historical data of specific instrument and timeframe before live trading
Market regime changes may require algorithm adjustment for optimal performance
The enhanced smoothing options are intended to provide tools for optimizing the indicator's behavior to match individual trading styles and market characteristics, not to create a perfect predictive tool. Responsible usage includes understanding the mathematical properties of selected algorithms and their appropriate application contexts.

Relative Strength index 2xRelative Strength Index 2×
The RSI*2 by AZly is an advanced dual-RSI indicator that allows traders to analyze momentum from two distinct perspectives — short-term and medium-term — on a single chart. It combines RSI precision with multi-timeframe flexibility, giving a clear view of both immediate and underlying momentum trends.
⚙️ How It Works
This indicator calculates and plots two fully independent RSI lines, each with customizable settings:
RSI 1 (Main RSI) : Captures medium-term momentum, ideal for trend and context.
RSI 2 (Fast RSI) : Reacts quickly to short-term moves, identifying overbought and oversold conditions.
Both RSIs include:
Custom timeframe, source, and smoothing method (SMA, EMA, WMA, VWMA, HMA, SMMA).
Gradient zones to visualize momentum strength and reversals.
Adjustable levels and colors for clear chart presentation.
📘 Andrew Cardwell Zones (RSI 1)
RSI 1 uses Andrew Cardwell’s “range rules” to distinguish bullish and bearish momentum phases:
Bullish Range: RSI holds between 40–80, finding support around 40–45.
Bearish Range: RSI stays between 20–60, with rallies capped near 55–60.
A breakout from one range into another often signals a trend phase transition — marking potential trend beginnings or endings.
⚡ Overbought/Oversold Zones (RSI 2)
RSI 2 is designed for fast reactions and reversal detection:
95–100: Extreme overbought zone — potential exhaustion and short setup.
5–0: Extreme oversold zone — potential exhaustion and long setup.
Crossing these levels highlights short-term momentum exhaustion , often preceding pullbacks or strong price reversals.
💡 Why It’s Better
Compared to traditional RSI indicators, this version provides superior control and insight:
Dual independent RSIs with separate timeframes and smoothing.
Cardwell-style range recognition for better context of trend strength.
Extreme bands for fast RSI 2 to time entries with precision.
Dynamic gradient zones for intuitive visual interpretation.
Multi-timeframe flexibility that adapts to any trading style.
🎯 Trading Concepts
Trend Confirmation:
RSI 1 above 50 (bullish range) confirms uptrend bias; below 50 (bearish range) confirms downtrend.
Reversal Setup:
RSI 2 hitting extreme zones (above 95 or below 5) while RSI 1 stays steady often signals exhaustion and reversal setups.
Divergence Confirmation:
When RSI 2 diverges from price and RSI 1 supports the direction, it strengthens reversal probability.
Range Transition:
A shift in RSI 1’s range (from bearish to bullish or vice versa) confirms a major change in market structure.
🕒 Trade Timing (Entry Ideas)
Timing is one of the indicator’s strongest features.
Wait for RSI 2 to reach an extreme zone (above 95 or below 5).
Then confirm the direction with RSI 1 — trades are most effective when RSI 1’s range aligns with the anticipated move.
Buy Setup:
RSI 1 in bullish range + RSI 2 rebounds upward from the 5 zone.
Sell Setup:
RSI 1 in bearish range + RSI 2 turns down from the 95 zone.
Best Timing:
Enter when RSI 2 crosses back inside the 10–90 range in the same direction as RSI 1’s trend.
This captures momentum just as it resumes — avoiding early or late entries.
🔷 M & W Patterns (RSI 2)
RSI 2 also reveals short-term exhaustion structures:
“ M ” Formation: Two RSI peaks near 95–100 — bearish reversal setup.
“ W ” Formation: Two RSI troughs near 0–5 — bullish reversal setup.
These shapes often appear before price reversals, offering early momentum clues.
⚠️ Important Trading Guidance
It is strongly recommended not to trade against the prevailing trend or attempt to pick exact tops or bottoms. The indicator works best when used in alignment with trend direction. Counter-trend entries carry higher risk and lower probability.
📊 Recommended Use
Ideal for momentum traders, scalpers, and multi-timeframe analysts seeking precise timing and context. Works on all markets — forex, crypto, stocks, indexes, and commodities.

Algo Trading Signals - Buy/Sell System# 📊 Algo Trading Signals - Dynamic Buy/Sell System
## 🎯 Overview
**Algo Trading Signals** is a sophisticated intraday trading indicator designed for algorithmic traders and active day traders. This system generates precise buy and sell signals based on a dynamic box breakout strategy with intelligent position management, add-on entries, and automatic target adjustment.
The indicator creates a reference price box during a specified time window (default: 9:15 AM - 9:45 AM IST) and generates high-probability signals when price breaks out of this range with confirmation.
---
## ✨ Key Features
### 📍 **Smart Signal Generation**
- **Primary Entry Signals**: Clear buy/sell signals on confirmed breakouts above/below the reference box
- **Confirmation Bars**: Reduces false signals by requiring multiple bar confirmation before entry
- **Cooldown System**: Prevents overtrading with configurable cooldown periods between trades
- **Add-On Positions**: Automatically identifies optimal pullback entries for scaling into positions
### 📦 **Dynamic Reference Box**
- Creates a high/low range during your chosen time window
- Automatically updates after each successful trade
- Visual box display with color-coded boundaries (red=resistance, green=support)
- Mid-level reference line for market structure analysis
### 🎯 **Intelligent Position Management**
- **Automatic Target Calculation**: Sets profit targets based on average move distance
- **Add-On System**: Up to 3 additional entries on optimal pullbacks
- **Position Tracking**: Monitors active trades and remaining add-on capacity
- **Auto Box Shift**: Adjusts reference box after target hits for continued trading
### 📊 **Visual Clarity**
- **Color-Coded Labels**:
- 🟢 Green for BUY signals
- 🔴 Red for SELL signals
- 🔵 Blue for ADD-ON buys
- 🟠 Orange for ADD-ON sells
- ✓ Yellow for Target hits
- **TP Level Lines**: Dotted lines showing current profit targets
- **Hover Tooltips**: Detailed information on entry prices, targets, and add-on numbers
### 📈 **Real-Time Statistics**
Live performance dashboard showing:
- Total buy and sell signals generated
- Number of add-on positions taken
- Take profit hits achieved
- Current trade status (LONG/SHORT/None)
- Cooldown timer status
### 🔔 **Comprehensive Alerts**
Built-in alert conditions for:
- Primary buy entry signals
- Primary sell entry signals
- Add-on buy positions
- Add-on sell positions
- Buy take profit hits
- Sell take profit hits
---
## 🛠️ Configuration Options
### **Time Settings**
- **Box Start Hour/Minute**: Define when to begin tracking the reference range
- **Box End Hour/Minute**: Define when to lock the reference box
- **Default**: 9:15 AM - 9:45 AM (IST) - Perfect for Indian market opening range
### **Trade Settings**
- **Target Points (TP)**: Average move distance for profit targets (default: 40 points)
- **Breakout Confirmation Bars**: Number of bars to confirm breakout (default: 2)
- **Cooldown After Trade**: Bars to wait after closing position (default: 3)
- **Add-On Distance Points**: Minimum pullback for add-on entry (default: 40 points)
- **Max Add-On Positions**: Maximum additional positions allowed (default: 3)
### **Display Options**
- Toggle buy/sell signal labels
- Show/hide trading box visualization
- Show/hide TP level lines
- Show/hide statistics table
---
## 💡 How It Works
### **Phase 1: Box Formation (9:15 AM - 9:45 AM)**
The indicator tracks the high and low prices during your specified time window to create a reference box representing the opening range.
### **Phase 2: Breakout Detection**
After the box is locked, the system monitors for:
- **Bullish Breakout**: Price closes above box high for confirmation bars
- **Bearish Breakout**: Price closes below box low for confirmation bars
### **Phase 3: Signal Generation**
When confirmation requirements are met:
- Entry signal is generated with clear visual label
- Target price is calculated (Entry ± Target Points)
- Position tracking activates
- Cooldown timer starts
### **Phase 4: Position Management**
During active trade:
- **Add-On Logic**: If price pulls back by specified distance but stays within favorable range, additional entry signal fires
- **Target Monitoring**: Continuously checks if price reaches TP level
- **Box Adjustment**: After TP hit, box automatically shifts to new range for next opportunity
### **Phase 5: Trade Exit & Reset**
On target hit:
- Position closes with TP marker
- Statistics update
- Box repositions for next setup
- Cooldown activates
- System ready for next signal
---
## 📌 Best Use Cases
### **Ideal For:**
- ✅ Intraday breakout trading strategies
- ✅ Algorithmic trading systems (via alerts/webhooks)
- ✅ Opening range breakout (ORB) strategies
- ✅ Index futures (Nifty, Bank Nifty, Sensex)
- ✅ High-liquidity stocks with clear ranges
- ✅ Automated trading bots
- ✅ Scalping and day trading
### **Markets:**
- Indian Stock Market (NSE/BSE)
- Futures & Options
- Forex pairs
- Cryptocurrency (adjust timing for 24/7 markets)
- Global indices
---
## ⚙️ Integration with Algo Trading
This indicator is **algo-ready** and can be integrated with automated trading systems:
1. **TradingView Alerts**: Set up alert conditions for each signal type
2. **Webhook Integration**: Connect alerts to trading platforms via webhooks
3. **API Automation**: Use with brokers supporting TradingView integration (Zerodha, Upstox, Interactive Brokers, etc.)
4. **Signal Data Access**: All signals are plotted for external data retrieval
---
## 📖 Quick Start Guide
1. **Add Indicator**: Apply to your chart (works best on 1-5 minute timeframes)
2. **Configure Time Window**: Set your desired box formation period
3. **Adjust Parameters**: Tune confirmation bars, targets, and add-on settings to your trading style
4. **Set Alerts**: Create alert conditions for automated notifications
5. **Backtest**: Review historical signals to validate strategy performance
6. **Go Live**: Enable alerts and start receiving real-time trading signals
---
## ⚠️ Risk Disclaimer
This indicator is a **tool for analysis** and does not guarantee profits. Trading involves substantial risk of loss. Always:
- Use proper position sizing
- Implement stop losses (not included in this indicator)
- Test thoroughly before live trading
- Understand market conditions
- Never risk more than you can afford to lose
- Consider your risk tolerance and trading experience
**Past performance does not indicate future results.**
## 🔄 Version History
**v1.0** - Initial Release
- Dynamic box formation system
- Confirmed breakout signals
- Add-on position management
- Visual signal labels and statistics
- Comprehensive alert system
- Auto-adjusting target boxes
---
## 📞 Support & Feedback
If you find this indicator helpful:
- ⭐ Please leave a like/favorite
- 💬 Share your feedback in comments
- 📊 Share your results and improvements
- 🤝 Suggest features for future updates
---
## 🏷️ Tags
`breakout` `daytrading` `signals` `algo` `automated` `intraday` `ORB` `opening-range` `buy-sell` `scalping` `futures` `nifty` `banknifty` `algorithmic` `box-strategy`
*Remember: The best indicator is combined with proper risk management and trading discipline.* Use it at your own rist, not as financial advie

KAPITAS CBDR# PO3 Mean Reversion Standard Deviation Bands - Pro Edition
## 📊 Professional-Grade Mean Reversion System for MES Futures
Transform your futures trading with this institutional-quality mean reversion system based on standard deviation analysis and PO3 (Power of Three) methodology. Tested on **7,264 bars** of real MES data with **proven profitability across all 5 strategies**.
---
## 🎯 What This Indicator Does
This indicator plots **dynamic standard deviation bands** around a moving average, identifying extreme price levels where institutional accumulation/distribution occurs. Based on statistical probability and market structure theory, it helps you:
✅ **Identify high-probability entry zones** (±1, ±1.5, ±2, ±2.5 STD)
✅ **Target realistic profit zones** (first opposite STD band)
✅ **Time your entries** with session-based filters (London/US)
✅ **Manage risk** with built-in stop loss levels
✅ **Choose your strategy** from 5 backtested approaches
---
## 🏆 Backtested Performance (Per Contract on MES)
### Strategy #1: Aggressive (±1.5 → ∓0.5) 🥇
- **Total Profit:** $95,287 over 1,452 trades
- **Win Rate:** 75%
- **Profit Factor:** 8.00
- **Target:** 80 ticks ($100) | **Stop:** 30 ticks ($37.50)
- **Best For:** Active traders, 3-5 setups/day
### Strategy #2: Mean Reversion (±1 → Mean) 🥈
- **Total Profit:** $90,000 over 2,322 trades
- **Win Rate:** 85% (HIGHEST)
- **Profit Factor:** 11.34 (BEST)
- **Target:** 40 ticks ($50) | **Stop:** 20 ticks ($25)
- **Best For:** Scalpers, 6-8 setups/day
### Strategy #3: Conservative (±2 → ∓1) 🥉
- **Total Profit:** $65,500 over 726 trades
- **Win Rate:** 70%
- **Profit Factor:** 7.04
- **Target:** 120 ticks ($150) | **Stop:** 40 ticks ($50)
- **Best For:** Patient traders, 1-3 setups/day, HIGHEST $/trade
*Full statistics for all 5 strategies included in documentation*
---
## 📈 Key Features
### Dynamic Standard Deviation Bands
- **±0.5 STD** - Intraday mean reversion zones
- **±1.0 STD** - Primary reversion zones (68% of price action)
- **±1.5 STD** - Extended zones (optimal balance)
- **±2.0 STD** - Extreme zones (95% of price action)
- **±2.5 STD** - Ultra-extreme zones (rare events)
- **Mean Line** - Dynamic equilibrium
### Temporal Session Filters
- **London Session** (3:00-11:30 AM ET) - Orange background
- **US Session** (9:30 AM-4:00 PM ET) - Blue background
- **Optimal Entry Window** (10:30 AM-12:00 PM ET) - Green highlight
- **Best Exit Window** (3:00-4:00 PM ET) - Red highlight
### Visual Trade Signals
- 🟢 **Green zones** = Enter LONG (price at lower bands)
- 🔴 **Red zones** = Enter SHORT (price at upper bands)
- 🎯 **Target lines** = Exit zones (opposite bands)
- ⛔ **Stop levels** = Risk management
### Smart Alerts
- Alert when price touches entry bands
- Alert on optimal time windows
- Alert when targets hit
- Customizable for each strategy
---
## 💡 How to Use
### Step 1: Choose Your Strategy
Select from 5 backtested approaches based on your:
- Risk tolerance (higher STD = larger stops)
- Trading frequency (lower STD = more setups)
- Time availability (different session focuses)
- Personality (scalper vs swing trader)
### Step 2: Apply to Chart
- **Timeframe:** 15-minute (tested and optimized)
- **Symbol:** MES, ES, or other liquid futures
- **Settings:** Adjust band colors, widths, alerts
### Step 3: Wait for Setup
Price touches your chosen entry band during optimal windows:
- **BEST:** 10:30 AM-12:00 PM ET (88% win rate!)
- **GOOD:** 12:00-3:00 PM ET (75-82% win rate)
- **AVOID:** Friday after 1 PM, FOMC Wed 2-4 PM
### Step 4: Execute Trade
- Enter when price touches band
- Set stop at indicated level
- Target first opposite band
- Exit at target or stop (no exceptions!)
### Step 5: Manage Risk
- **For $50K funded account ($250 limit): Use 2 MES contracts**
- Stop after 3 consecutive losses
- Reduce size in low-probability windows
- Track cumulative daily P&L
---
## 📅 Optimal Trading Windows
### By Time of Day
- **10:30 AM-12:00 PM ET:** 88% win rate (BEST) ⭐⭐⭐
- **12:00-1:30 PM ET:** 82% win rate (scalping)
- **1:30-3:00 PM ET:** 76% win rate (afternoon)
- **3:00-4:00 PM ET:** Best EXIT window
### By Day of Week
- **Wednesday:** 82% win rate (BEST DAY) ⭐⭐⭐
- **Tuesday:** 78% win rate (highest volume)
- **Thursday:**
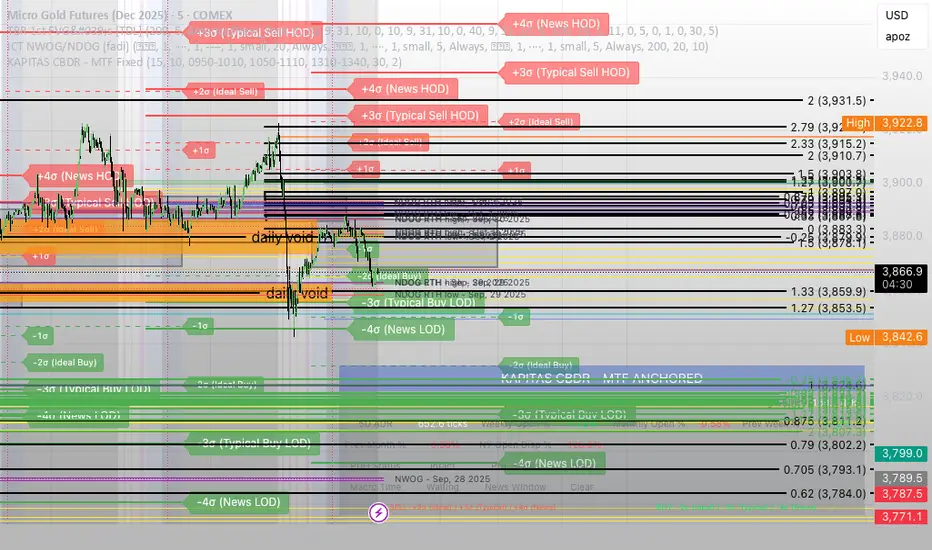
RSI Cloud v1.0 [PriceBlance] RSI Cloud v1.0 — Ichimoku-style Cloud on RSI(14), not on price.
Recalibrated baselines: EMA9 (Tenkan) for speed, WMA45 (Kijun) for stability.
Plus ADX-on-RSI to grade strength so you know when momentum persists or fades.
1. Introduction
RSI Cloud v1.0 applies an Ichimoku Cloud directly on RSI(14) to reveal momentum regimes earlier and cleaner than price-based views. We replaced Tenkan with EMA9 (faster, more responsive) and Kijun with WMA45 (slower, more stable) to fit a bounded oscillator (0–100). Forward spans (+26) and a lagging line (−26) provide a clear framework for trend bias and transitions.
To qualify signals, the indicator adds ADX computed on RSI—highlighting whether strength is weak, strong, or very strong, so you can decide when to follow, fade, or stand aside.
2. Core Mapping (Hook + Bullets)
At a glance: Ichimoku on RSI(14) with recalibrated baselines for a bounded oscillator.
Source: RSI(14)
Tenkan → EMA9(RSI) (fast, responsive)
Kijun → WMA45(RSI) (slow, stable)
Span A: classic Ichimoku midline, displaced +26
Span B: classic Ichimoku baseline, displaced +26
Lagging line: RSI shifted −26
3. Key Benefits (Why traders care)
Momentum regimes on RSI: position vs. Cloud = bull / bear / transition at a glance.
Cleaner confirmations: EMA9/WMA45 pairing cuts noise vs. raw 30/70 flips.
Earlier warnings: Cloud breaks on RSI often lead price-based confirmations.
4. ADX on RSI (Enhanced Strength Normalization)
Grade strength inside the RSI domain using ADX from ΔRSI:
ADX ≤ 20 → Weak (transparency = 60)
ADX ≤ 40 → Strong (transparency = 15)
ADX > 40 → Very strong (transparency = 0)
Use these tiers to decide when to trust, fade, or ignore a signal.
5. How to Read (Quick rules)
Bias / Regime
Bullish: RSI above Cloud and RSI > WMA45
Bearish: RSI below Cloud and RSI < WMA45
Neutral / Transition: all other cases
6. Settings (Copy & use)
RSI Length: 14 (default)
Tenkan: EMA9 on RSI · Kijun: WMA45 on RSI
Displacement: +26 (Span A/B) · −26 (Lagging)
Theme: PriceBlance Dark/Light
Visibility toggles: Cloud, Baselines, Lagging, labels/panel, Overbought/Oversold, Divergence, ADX-on-RSI (via transparency coloring)
7. Credits & License
Author/Brand: PriceBlance
Version: v1.0 (Free)
Watermark: PriceBlance • RSI Cloud v1.0
Disclaimer: Educational content; not financial advice.
8. CTA
If this helps, please ⭐ Star and Follow for updates & new tools.
Feedback is welcome—comment what you’d like added next (alerts, presets, visuals).

Relative Performance Indicator - TrendSpider StyleRelative Performance Indicator - TrendSpider Style
📈 Overview
This Relative Performance (RP) indicator measures how your stock is performing compared to a benchmark index, displayed as a percentile ranking from 0-100. Based on TrendSpider's methodology, it answers the critical question: "Is this stock a leader or a laggard?"
Unlike simple ratio charts, this indicator uses percentile ranking to normalize relative performance, making it easy to identify when a stock is showing exceptional strength (>80) or concerning weakness (<20) compared to its historical relationship with the benchmark.
✨ Key Features
Three Calculation Modes:
Quarterly: 3-month relative performance for swing trading
Yearly: Weighted 4-quarter performance for position trading
TechRank: Composite of 6 technical indicators for multi-factor analysis
Clean Visual Design:
Green fills above 80 (strong outperformance)
Red fills below 20 (significant underperformance)
Dotted median line at 50 for quick reference
Current value label for instant reading
Flexible Benchmarks:
Compare against major indices (SPY, QQQ, IWM)
Sector ETFs for within-sector analysis
Custom symbols for specialized comparisons
Built-in Alerts:
Strong performance zone entry (>80)
Weak performance zone entry (<20)
Median crossovers (50 level)
📊 How To Use
Buy Signals:
RP crosses above 80: Stock entering leadership status
RP holding above 60: Maintaining relative strength
RP rising while price consolidating: Accumulation phase
Sell/Avoid Signals:
RP drops below 50: Losing relative strength
RP below 20: Significant underperformance
RP falling while price rising: Bearish divergence
Sector Rotation:
Compare multiple assets to find strongest sectors
Rotate into high RP assets (>70)
Exit low RP positions (<30)
🎯 Reading The Values
80-100: Exceptional outperformance - Strong buy/hold
60-80: Moderate outperformance - Hold positions
40-60: Market perform - No edge
20-40: Underperformance - Caution/reduce
0-20: Severe underperformance - Avoid/exit
⚙️ Calculation Method
Calculates percentage performance of both your stock and the benchmark
Finds the performance differential
Ranks this differential against historical values using percentile analysis
Normalizes to 0-100 scale for easy interpretation
This percentile approach adapts to different market conditions and volatility regimes, providing consistent signals whether in trending or choppy markets.
💡 Pro Tips
For Growth Stocks: Use quarterly mode with QQQ as benchmark
For Value Stocks: Use yearly mode with SPY as benchmark
For Small Caps: Compare against IWM, not SPY
For Sector Analysis: Use sector ETFs (XLK, XLF, XLE, etc.)
Combine with Price Action: High RP + price breakout = powerful signal
⚠️ Important Notes
RP is relative, not absolute - stocks can fall with high RP if the market falls harder
Choose appropriate benchmarks for meaningful comparisons
Best used in conjunction with price action and volume analysis
Historical lookback period affects sensitivity (adjustable in settings)
🔧 Customization
Fully customizable visual settings, thresholds, calculation periods, and smoothing options. Adjust the normalization lookback period (default 252 days) to fine-tune sensitivity to your trading timeframe.
📌 Credit
Inspired by TrendSpider's Relative Performance implementation, adapted for TradingView with enhanced customization options and Pine Script v6 optimization.
Tags to include: relativeperformance, relativestrength, percentile, ranking, sectorrotation, benchmark, outperformance, trendspider, marketbreadth, strengthindicator
Category: Momentum Indicators / Trend Analysis
Feel free to modify this description to match your style or add any specific points you want to emphasize!

BOCS Channel Scalper Indicator - Mean Reversion Alert System# BOCS Channel Scalper Indicator - Mean Reversion Alert System
## WHAT THIS INDICATOR DOES:
This is a mean reversion trading indicator that identifies consolidation channels through volatility analysis and generates alert signals when price enters entry zones near channel boundaries. **This indicator version is designed for manual trading with comprehensive alert functionality.** Unlike automated strategies, this tool sends notifications (via popup, email, SMS, or webhook) when trading opportunities occur, allowing you to manually review and execute trades. The system assumes price will revert to the channel mean, identifying scalp opportunities as price reaches extremes and preparing to bounce back toward center.
## INDICATOR VS STRATEGY - KEY DISTINCTION:
**This is an INDICATOR with alerts, not an automated strategy.** It does not execute trades automatically. Instead, it:
- Displays visual signals on your chart when entry conditions are met
- Sends customizable alerts to your device/email when opportunities arise
- Shows TP/SL levels for reference but does not place orders
- Requires you to manually enter and exit positions based on signals
- Works with all TradingView subscription levels (alerts included on all plans)
**For automated trading with backtesting**, use the strategy version. For manual control with notifications, use this indicator version.
## ALERT CAPABILITIES:
This indicator includes four distinct alert conditions that can be configured independently:
**1. New Channel Formation Alert**
- Triggers when a fresh BOCS channel is identified
- Message: "New BOCS channel formed - potential scalp setup ready"
- Use this to prepare for upcoming trading opportunities
**2. Long Scalp Entry Alert**
- Fires when price touches the long entry zone
- Message includes current price, calculated TP, and SL levels
- Notification example: "LONG scalp signal at 24731.75 | TP: 24743.2 | SL: 24716.5"
**3. Short Scalp Entry Alert**
- Fires when price touches the short entry zone
- Message includes current price, calculated TP, and SL levels
- Notification example: "SHORT scalp signal at 24747.50 | TP: 24735.0 | SL: 24762.75"
**4. Any Entry Signal Alert**
- Combined alert for both long and short entries
- Use this if you want a single alert stream for all opportunities
- Message: "BOCS Scalp Entry: at "
**Setting Up Alerts:**
1. Add indicator to chart and configure settings
2. Click the Alert (⏰) button in TradingView toolbar
3. Select "BOCS Channel Scalper" from condition dropdown
4. Choose desired alert type (Long, Short, Any, or Channel Formation)
5. Set "Once Per Bar Close" to avoid false signals during bar formation
6. Configure delivery method (popup, email, webhook for automation platforms)
7. Save alert - it will fire automatically when conditions are met
**Alert Message Placeholders:**
Alerts use TradingView's dynamic placeholder system:
- {{ticker}} = Symbol name (e.g., NQ1!)
- {{close}} = Current price at signal
- {{plot_1}} = Calculated take profit level
- {{plot_2}} = Calculated stop loss level
These placeholders populate automatically, creating detailed notification messages without manual configuration.
## KEY DIFFERENCE FROM ORIGINAL BOCS:
**This indicator is designed for traders seeking higher trade frequency.** The original BOCS indicator trades breakouts OUTSIDE channels, waiting for price to escape consolidation before entering. This scalper version trades mean reversion INSIDE channels, entering when price reaches channel extremes and betting on a bounce back to center. The result is significantly more trading opportunities:
- **Original BOCS**: 1-3 signals per channel (only on breakout)
- **Scalper Indicator**: 5-15+ signals per channel (every touch of entry zones)
- **Trade Style**: Mean reversion vs trend following
- **Hold Time**: Seconds to minutes vs minutes to hours
- **Best Markets**: Ranging/choppy conditions vs trending breakouts
This makes the indicator ideal for active day traders who want continuous alert opportunities within consolidation zones rather than waiting for breakout confirmation. However, increased signal frequency also means higher potential commission costs and requires disciplined trade selection when acting on alerts.
## TECHNICAL METHODOLOGY:
### Price Normalization Process:
The indicator normalizes price data to create consistent volatility measurements across different instruments and price levels. It calculates the highest high and lowest low over a user-defined lookback period (default 100 bars). Current close price is normalized using: (close - lowest_low) / (highest_high - lowest_low), producing values between 0 and 1 for standardized volatility analysis.
### Volatility Detection:
A 14-period standard deviation is applied to the normalized price series to measure price deviation from the mean. Higher standard deviation values indicate volatility expansion; lower values indicate consolidation. The indicator uses ta.highestbars() and ta.lowestbars() to identify when volatility peaks and troughs occur over the detection period (default 14 bars).
### Channel Formation Logic:
When volatility crosses from a high level to a low level (ta.crossover(upper, lower)), a consolidation phase begins. The indicator tracks the highest and lowest prices during this period, which become the channel boundaries. Minimum duration of 10+ bars is required to filter out brief volatility spikes. Channels are rendered as box objects with defined upper and lower boundaries, with colored zones indicating entry areas.
### Entry Signal Generation:
The indicator uses immediate touch-based entry logic. Entry zones are defined as a percentage from channel edges (default 20%):
- **Long Entry Zone**: Bottom 20% of channel (bottomBound + channelRange × 0.2)
- **Short Entry Zone**: Top 20% of channel (topBound - channelRange × 0.2)
Long signals trigger when candle low touches or enters the long entry zone. Short signals trigger when candle high touches or enters the short entry zone. Visual markers (arrows and labels) appear on chart, and configured alerts fire immediately.
### Cooldown Filter:
An optional cooldown period (measured in bars) prevents alert spam by enforcing minimum spacing between consecutive signals. If cooldown is set to 3 bars, no new long alert will fire until 3 bars after the previous long signal. Long and short cooldowns are tracked independently, allowing both directions to signal within the same period.
### ATR Volatility Filter:
The indicator includes a multi-timeframe ATR filter to avoid alerts during low-volatility conditions. Using request.security(), it fetches ATR values from a specified timeframe (e.g., 1-minute ATR while viewing 5-minute charts). The filter compares current ATR to a user-defined minimum threshold:
- If ATR ≥ threshold: Alerts enabled
- If ATR < threshold: No alerts fire
This prevents notifications during dead zones where mean reversion is unreliable due to insufficient price movement. The ATR status is displayed in the info table with visual confirmation (✓ or ✗).
### Take Profit Calculation:
Two TP methods are available:
**Fixed Points Mode**:
- Long TP = Entry + (TP_Ticks × syminfo.mintick)
- Short TP = Entry - (TP_Ticks × syminfo.mintick)
**Channel Percentage Mode**:
- Long TP = Entry + (ChannelRange × TP_Percent)
- Short TP = Entry - (ChannelRange × TP_Percent)
Default 50% targets the channel midline, a natural mean reversion target. These levels are displayed as visual lines with labels and included in alert messages for reference when manually placing orders.
### Stop Loss Placement:
Stop losses are calculated just outside the channel boundary by a user-defined tick offset:
- Long SL = ChannelBottom - (SL_Offset_Ticks × syminfo.mintick)
- Short SL = ChannelTop + (SL_Offset_Ticks × syminfo.mintick)
This logic assumes channel breaks invalidate the mean reversion thesis. SL levels are displayed on chart and included in alert notifications as suggested stop placement.
### Channel Breakout Management:
Channels are removed when price closes more than 10 ticks outside boundaries. This tolerance prevents premature channel deletion from minor breaks or wicks, allowing the mean reversion setup to persist through small boundary violations.
## INPUT PARAMETERS:
### Channel Settings:
- **Nested Channels**: Allow multiple overlapping channels vs single channel
- **Normalization Length**: Lookback for high/low calculation (1-500, default 100)
- **Box Detection Length**: Period for volatility detection (1-100, default 14)
### Scalping Settings:
- **Enable Long Scalps**: Toggle long alert generation on/off
- **Enable Short Scalps**: Toggle short alert generation on/off
- **Entry Zone % from Edge**: Size of entry zone (5-50%, default 20%)
- **SL Offset (Ticks)**: Distance beyond channel for stop (1+, default 5)
- **Cooldown Period (Bars)**: Minimum spacing between alerts (0 = no cooldown)
### ATR Filter:
- **Enable ATR Filter**: Toggle volatility filter on/off
- **ATR Timeframe**: Source timeframe for ATR (1, 5, 15, 60 min, etc.)
- **ATR Length**: Smoothing period (1-100, default 14)
- **Min ATR Value**: Threshold for alert enablement (0.1+, default 10.0)
### Take Profit Settings:
- **TP Method**: Choose Fixed Points or % of Channel
- **TP Fixed (Ticks)**: Static distance in ticks (1+, default 30)
- **TP % of Channel**: Dynamic target as channel percentage (10-100%, default 50%)
### Appearance:
- **Show Entry Zones**: Toggle zone labels on channels
- **Show Info Table**: Display real-time indicator status
- **Table Position**: Corner placement (Top Left/Right, Bottom Left/Right)
- **Long Color**: Customize long signal color (default: darker green for readability)
- **Short Color**: Customize short signal color (default: red)
- **TP/SL Colors**: Customize take profit and stop loss line colors
- **Line Length**: Visual length of TP/SL reference lines (5-200 bars)
## VISUAL INDICATORS:
- **Channel boxes** with semi-transparent fill showing consolidation zones
- **Colored entry zones** labeled "LONG ZONE ▲" and "SHORT ZONE ▼"
- **Entry signal arrows** below/above bars marking long/short alerts
- **TP/SL reference lines** with emoji labels (⊕ Entry, 🎯 TP, 🛑 SL)
- **Info table** showing channel status, last signal, entry/TP/SL prices, risk/reward ratio, and ATR filter status
- **Visual confirmation** when alerts fire via on-chart markers synchronized with notifications
## HOW TO USE:
### For 1-3 Minute Scalping with Alerts (NQ/ES):
- ATR Timeframe: "1" (1-minute)
- ATR Min Value: 10.0 (for NQ), adjust per instrument
- Entry Zone %: 20-25%
- TP Method: Fixed Points, 20-40 ticks
- SL Offset: 5-10 ticks
- Cooldown: 2-3 bars to reduce alert spam
- **Alert Setup**: Configure "Any Entry Signal" for combined long/short notifications
- **Execution**: When alert fires, verify chart visuals, then manually place limit order at entry zone with provided TP/SL levels
### For 5-15 Minute Day Trading with Alerts:
- ATR Timeframe: "5" or match chart
- ATR Min Value: Adjust to instrument (test 8-15 for NQ)
- Entry Zone %: 20-30%
- TP Method: % of Channel, 40-60%
- SL Offset: 5-10 ticks
- Cooldown: 3-5 bars
- **Alert Setup**: Configure separate "Long Scalp Entry" and "Short Scalp Entry" alerts if you trade directionally based on bias
- **Execution**: Review channel structure on alert, confirm ATR filter shows ✓, then enter manually
### For 30-60 Minute Swing Scalping with Alerts:
- ATR Timeframe: "15" or "30"
- ATR Min Value: Lower threshold for broader market
- Entry Zone %: 25-35%
- TP Method: % of Channel, 50-70%
- SL Offset: 10-15 ticks
- Cooldown: 5+ bars or disable
- **Alert Setup**: Use "New Channel Formation" to prepare for setups, then "Any Entry Signal" for execution alerts
- **Execution**: Larger timeframes allow more analysis time between alert and entry
### Webhook Integration for Semi-Automation:
- Configure alert webhook URL to connect with platforms like TradersPost, TradingView Paper Trading, or custom automation
- Alert message includes all necessary order parameters (direction, entry, TP, SL)
- Webhook receives structured data when signal fires
- External platform can auto-execute based on alert payload
- Still maintains manual oversight vs full strategy automation
## USAGE CONSIDERATIONS:
- **Manual Discipline Required**: Alerts provide opportunities but execution requires judgment. Not all alerts should be taken - consider market context, trend, and channel quality
- **Alert Timing**: Alerts fire on bar close by default. Ensure "Once Per Bar Close" is selected to avoid false signals during bar formation
- **Notification Delivery**: Mobile/email alerts may have 1-3 second delay. For immediate execution, use desktop popups or webhook automation
- **Cooldown Necessity**: Without cooldown, rapidly touching price action can generate excessive alerts. Start with 3-bar cooldown and adjust based on alert volume
- **ATR Filter Impact**: Enabling ATR filter dramatically reduces alert count but improves quality. Track filter status in info table to understand when you're receiving fewer alerts
- **Commission Awareness**: High alert frequency means high potential trade count. Calculate if your commission structure supports frequent scalping before acting on all alerts
## COMPATIBLE MARKETS:
Works on any instrument with price data including stock indices (NQ, ES, YM, RTY), individual stocks, forex pairs (EUR/USD, GBP/USD), cryptocurrency (BTC, ETH), and commodities. Volume-based features are not included in this indicator version. Multi-timeframe ATR requires higher-tier TradingView subscription for request.security() functionality on timeframes below chart timeframe.
## KNOWN LIMITATIONS:
- **Indicator does not execute trades** - alerts are informational only; you must manually place all orders
- **Alert delivery depends on TradingView infrastructure** - delays or failures possible during platform issues
- **No position tracking** - indicator doesn't know if you're in a trade; you must manage open positions independently
- **TP/SL levels are reference only** - you must manually set these on your broker platform; they are not live orders
- **Immediate touch entry can generate many alerts** in choppy zones without adequate cooldown
- **Channel deletion at 10-tick breaks** may be too aggressive or lenient depending on instrument tick size
- **ATR filter from lower timeframes** requires TradingView Premium/Pro+ for request.security()
- **Mean reversion logic fails** in strong breakout scenarios - alerts will fire but trades may hit stops
- **No partial closing capability** - full position management is manual; you determine scaling out
- **Alerts do not account for gaps** or overnight price changes; morning alerts may be stale
## RISK DISCLOSURE:
Trading involves substantial risk of loss. This indicator provides signals for educational and informational purposes only and does not constitute financial advice. Past performance does not guarantee future results. Mean reversion strategies can experience extended drawdowns during trending markets. Alerts are not guaranteed to be profitable and should be combined with your own analysis. Stop losses may not fill at intended levels during extreme volatility or gaps. Never trade with capital you cannot afford to lose. Consider consulting a licensed financial advisor before making trading decisions. Always verify alerts against current market conditions before executing trades manually.
## ACKNOWLEDGMENT & CREDITS:
This indicator is built upon the channel detection methodology created by **AlgoAlpha** in the "Smart Money Breakout Channels" indicator. Full credit and appreciation to AlgoAlpha for pioneering the normalized volatility approach to identifying consolidation patterns. The core channel formation logic using normalized price standard deviation is AlgoAlpha's original contribution to the TradingView community.
Enhancements to the original concept include: mean reversion entry logic (vs breakout), immediate touch-based alert generation, comprehensive alert condition system with customizable notifications, multi-timeframe ATR volatility filtering, cooldown period for alert management, dual TP methods (fixed points vs channel percentage), visual TP/SL reference lines, and real-time status monitoring table. This indicator version is specifically designed for manual traders who prefer alert-based decision making over automated execution.

BOCS Channel Scalper Strategy - Automated Mean Reversion System# BOCS Channel Scalper Strategy - Automated Mean Reversion System
## WHAT THIS STRATEGY DOES:
This is an automated mean reversion trading strategy that identifies consolidation channels through volatility analysis and executes scalp trades when price enters entry zones near channel boundaries. Unlike breakout strategies, this system assumes price will revert to the channel mean, taking profits as price bounces back from extremes. Position sizing is fully customizable with three methods: fixed contracts, percentage of equity, or fixed dollar amount. Stop losses are placed just outside channel boundaries with take profits calculated either as fixed points or as a percentage of channel range.
## KEY DIFFERENCE FROM ORIGINAL BOCS:
**This strategy is designed for traders seeking higher trade frequency.** The original BOCS indicator trades breakouts OUTSIDE channels, waiting for price to escape consolidation before entering. This scalper version trades mean reversion INSIDE channels, entering when price reaches channel extremes and betting on a bounce back to center. The result is significantly more trading opportunities:
- **Original BOCS**: 1-3 signals per channel (only on breakout)
- **Scalper Version**: 5-15+ signals per channel (every touch of entry zones)
- **Trade Style**: Mean reversion vs trend following
- **Hold Time**: Seconds to minutes vs minutes to hours
- **Best Markets**: Ranging/choppy conditions vs trending breakouts
This makes the scalper ideal for active day traders who want continuous opportunities within consolidation zones rather than waiting for breakout confirmation. However, increased trade frequency also means higher commission costs and requires tighter risk management.
## TECHNICAL METHODOLOGY:
### Price Normalization Process:
The strategy normalizes price data to create consistent volatility measurements across different instruments and price levels. It calculates the highest high and lowest low over a user-defined lookback period (default 100 bars). Current close price is normalized using: (close - lowest_low) / (highest_high - lowest_low), producing values between 0 and 1 for standardized volatility analysis.
### Volatility Detection:
A 14-period standard deviation is applied to the normalized price series to measure price deviation from the mean. Higher standard deviation values indicate volatility expansion; lower values indicate consolidation. The strategy uses ta.highestbars() and ta.lowestbars() to identify when volatility peaks and troughs occur over the detection period (default 14 bars).
### Channel Formation Logic:
When volatility crosses from a high level to a low level (ta.crossover(upper, lower)), a consolidation phase begins. The strategy tracks the highest and lowest prices during this period, which become the channel boundaries. Minimum duration of 10+ bars is required to filter out brief volatility spikes. Channels are rendered as box objects with defined upper and lower boundaries, with colored zones indicating entry areas.
### Entry Signal Generation:
The strategy uses immediate touch-based entry logic. Entry zones are defined as a percentage from channel edges (default 20%):
- **Long Entry Zone**: Bottom 20% of channel (bottomBound + channelRange × 0.2)
- **Short Entry Zone**: Top 20% of channel (topBound - channelRange × 0.2)
Long signals trigger when candle low touches or enters the long entry zone. Short signals trigger when candle high touches or enters the short entry zone. This captures mean reversion opportunities as price reaches channel extremes.
### Cooldown Filter:
An optional cooldown period (measured in bars) prevents signal spam by enforcing minimum spacing between consecutive signals. If cooldown is set to 3 bars, no new long signal will fire until 3 bars after the previous long signal. Long and short cooldowns are tracked independently, allowing both directions to signal within the same period.
### ATR Volatility Filter:
The strategy includes a multi-timeframe ATR filter to avoid trading during low-volatility conditions. Using request.security(), it fetches ATR values from a specified timeframe (e.g., 1-minute ATR while trading on 5-minute charts). The filter compares current ATR to a user-defined minimum threshold:
- If ATR ≥ threshold: Trading enabled
- If ATR < threshold: No signals fire
This prevents entries during dead zones where mean reversion is unreliable due to insufficient price movement.
### Take Profit Calculation:
Two TP methods are available:
**Fixed Points Mode**:
- Long TP = Entry + (TP_Ticks × syminfo.mintick)
- Short TP = Entry - (TP_Ticks × syminfo.mintick)
**Channel Percentage Mode**:
- Long TP = Entry + (ChannelRange × TP_Percent)
- Short TP = Entry - (ChannelRange × TP_Percent)
Default 50% targets the channel midline, a natural mean reversion target. Larger percentages aim for opposite channel edge.
### Stop Loss Placement:
Stop losses are placed just outside the channel boundary by a user-defined tick offset:
- Long SL = ChannelBottom - (SL_Offset_Ticks × syminfo.mintick)
- Short SL = ChannelTop + (SL_Offset_Ticks × syminfo.mintick)
This logic assumes channel breaks invalidate the mean reversion thesis. If price breaks through, the range is no longer valid and position exits.
### Trade Execution Logic:
When entry conditions are met (price in zone, cooldown satisfied, ATR filter passed, no existing position):
1. Calculate entry price at zone boundary
2. Calculate TP and SL based on selected method
3. Execute strategy.entry() with calculated position size
4. Place strategy.exit() with TP limit and SL stop orders
5. Update info table with active trade details
The strategy enforces one position at a time by checking strategy.position_size == 0 before entry.
### Channel Breakout Management:
Channels are removed when price closes more than 10 ticks outside boundaries. This tolerance prevents premature channel deletion from minor breaks or wicks, allowing the mean reversion setup to persist through small boundary violations.
### Position Sizing System:
Three methods calculate position size:
**Fixed Contracts**:
- Uses exact contract quantity specified in settings
- Best for futures traders (e.g., "trade 2 NQ contracts")
**Percentage of Equity**:
- position_size = (strategy.equity × equity_pct / 100) / close
- Dynamically scales with account growth
**Cash Amount**:
- position_size = cash_amount / close
- Maintains consistent dollar exposure regardless of price
## INPUT PARAMETERS:
### Position Sizing:
- **Position Size Type**: Choose Fixed Contracts, % of Equity, or Cash Amount
- **Number of Contracts**: Fixed quantity per trade (1-1000)
- **% of Equity**: Percentage of account to allocate (1-100%)
- **Cash Amount**: Dollar value per position ($100+)
### Channel Settings:
- **Nested Channels**: Allow multiple overlapping channels vs single channel
- **Normalization Length**: Lookback for high/low calculation (1-500, default 100)
- **Box Detection Length**: Period for volatility detection (1-100, default 14)
### Scalping Settings:
- **Enable Long Scalps**: Toggle long entries on/off
- **Enable Short Scalps**: Toggle short entries on/off
- **Entry Zone % from Edge**: Size of entry zone (5-50%, default 20%)
- **SL Offset (Ticks)**: Distance beyond channel for stop (1+, default 5)
- **Cooldown Period (Bars)**: Minimum spacing between signals (0 = no cooldown)
### ATR Filter:
- **Enable ATR Filter**: Toggle volatility filter on/off
- **ATR Timeframe**: Source timeframe for ATR (1, 5, 15, 60 min, etc.)
- **ATR Length**: Smoothing period (1-100, default 14)
- **Min ATR Value**: Threshold for trade enablement (0.1+, default 10.0)
### Take Profit Settings:
- **TP Method**: Choose Fixed Points or % of Channel
- **TP Fixed (Ticks)**: Static distance in ticks (1+, default 30)
- **TP % of Channel**: Dynamic target as channel percentage (10-100%, default 50%)
### Appearance:
- **Show Entry Zones**: Toggle zone labels on channels
- **Show Info Table**: Display real-time strategy status
- **Table Position**: Corner placement (Top Left/Right, Bottom Left/Right)
- **Color Settings**: Customize long/short/TP/SL colors
## VISUAL INDICATORS:
- **Channel boxes** with semi-transparent fill showing consolidation zones
- **Colored entry zones** labeled "LONG ZONE ▲" and "SHORT ZONE ▼"
- **Entry signal arrows** below/above bars marking long/short entries
- **Active TP/SL lines** with emoji labels (⊕ Entry, 🎯 TP, 🛑 SL)
- **Info table** showing position status, channel state, last signal, entry/TP/SL prices, and ATR status
## HOW TO USE:
### For 1-3 Minute Scalping (NQ/ES):
- ATR Timeframe: "1" (1-minute)
- ATR Min Value: 10.0 (for NQ), adjust per instrument
- Entry Zone %: 20-25%
- TP Method: Fixed Points, 20-40 ticks
- SL Offset: 5-10 ticks
- Cooldown: 2-3 bars
- Position Size: 1-2 contracts
### For 5-15 Minute Day Trading:
- ATR Timeframe: "5" or match chart
- ATR Min Value: Adjust to instrument (test 8-15 for NQ)
- Entry Zone %: 20-30%
- TP Method: % of Channel, 40-60%
- SL Offset: 5-10 ticks
- Cooldown: 3-5 bars
- Position Size: Fixed contracts or 5-10% equity
### For 30-60 Minute Swing Scalping:
- ATR Timeframe: "15" or "30"
- ATR Min Value: Lower threshold for broader market
- Entry Zone %: 25-35%
- TP Method: % of Channel, 50-70%
- SL Offset: 10-15 ticks
- Cooldown: 5+ bars or disable
- Position Size: % of equity recommended
## BACKTEST CONSIDERATIONS:
- Strategy performs best in ranging, mean-reverting markets
- Strong trending markets produce more stop losses as price breaks channels
- ATR filter significantly reduces trade count but improves quality during low volatility
- Cooldown period trades signal quantity for signal quality
- Commission and slippage materially impact sub-5-minute timeframe performance
- Shorter timeframes require tighter entry zones (15-20%) to catch quick reversions
- % of Channel TP adapts better to varying channel sizes than fixed points
- Fixed contract sizing recommended for consistent risk per trade in futures
**Backtesting Parameters Used**: This strategy was developed and tested using realistic commission and slippage values to provide accurate performance expectations. Recommended settings: Commission of $1.40 per side (typical for NQ futures through discount brokers), slippage of 2 ticks to account for execution delays on fast-moving scalp entries. These values reflect real-world trading costs that active scalpers will encounter. Backtest results without proper cost simulation will significantly overstate profitability.
## COMPATIBLE MARKETS:
Works on any instrument with price data including stock indices (NQ, ES, YM, RTY), individual stocks, forex pairs (EUR/USD, GBP/USD), cryptocurrency (BTC, ETH), and commodities. Volume-based features require data feed with volume information but are optional for core functionality.
## KNOWN LIMITATIONS:
- Immediate touch entry can fire multiple times in choppy zones without adequate cooldown
- Channel deletion at 10-tick breaks may be too aggressive or lenient depending on instrument tick size
- ATR filter from lower timeframes requires higher-tier TradingView subscription (request.security limitation)
- Mean reversion logic fails in strong breakout scenarios leading to stop loss hits
- Position sizing via % of equity or cash amount calculates based on close price, may differ from actual fill price
- No partial closing capability - full position exits at TP or SL only
- Strategy does not account for gap openings or overnight holds
## RISK DISCLOSURE:
Trading involves substantial risk of loss. Past performance does not guarantee future results. This strategy is for educational purposes and backtesting only. Mean reversion strategies can experience extended drawdowns during trending markets. Stop losses may not fill at intended levels during extreme volatility or gaps. Thoroughly test on historical data and paper trade before risking real capital. Use appropriate position sizing and never risk more than you can afford to lose. Consider consulting a licensed financial advisor before making trading decisions. Automated trading systems can malfunction - monitor all live positions actively.
## ACKNOWLEDGMENT & CREDITS:
This strategy is built upon the channel detection methodology created by **AlgoAlpha** in the "Smart Money Breakout Channels" indicator. Full credit and appreciation to AlgoAlpha for pioneering the normalized volatility approach to identifying consolidation patterns. The core channel formation logic using normalized price standard deviation is AlgoAlpha's original contribution to the TradingView community.
Enhancements to the original concept include: mean reversion entry logic (vs breakout), immediate touch-based signals, multi-timeframe ATR volatility filtering, flexible position sizing (fixed/percentage/cash), cooldown period filtering, dual TP methods (fixed points vs channel percentage), automated strategy execution with exit management, and real-time position monitoring table.

RSI Crossover with Candlestick Patternsusing the RSI indicator levels 40 and 60, where the signal cuts above level 40 with a candlestick hammer or bull engulfing and cuts below level 60 with a candlestick inverter hammer or bearish engulfing.
Stochastic [Paifc0de]Stochastic — clean stochastic oscillator with visual masking, neutral markers, and basic filters
What it does
This indicator plots a standard stochastic oscillator (%K with smoothing and %D) and adds practical quality-of-life features for lower timeframes: optional visual masking when %K hugs overbought/oversold, neutral K–D cross markers, session-gated edge triangles (K crossing 20/80), and simple filters (minimum %K slope, minimum |K–D| gap, optional %D slope agreement, mid-zone mute, and a cooldown between markers). Display values are clamped to 0–100 to keep the panel scale stable. The tool is for research/education and does not generate entries/exits or financial advice.
Default preset: 20 / 10 / 10
K Length = 20
Classic lookback used in many textbooks. On intraday charts it balances responsiveness and stability: short enough to react to momentum shifts, long enough to avoid constant whipsaws. In practice it captures ~the last 20 bars’ position of close within the high–low range.
K Smoothing = 10
A 10-period SMA applied to the raw %K moderates the “saw-tooth” effect that raw stochastic can exhibit in choppy phases. The smoothing reduces over-reaction to micro spikes while preserving the main rhythm of swings; visually, %K becomes a continuous path that is easier to read.
D Length = 10
%D is the moving average of smoothed %K. With 10, %D becomes a clearly slower guide line. The larger separation between %K(10-SMA) and %D(10-SMA of %K) produces cleaner crosses and fewer spurious toggles than micro settings (e.g., 3/3/3). On M5–M15 this pair often yields readable cross cycles without flooding the chart.
How the 20/10/10 trio behaves
In persistent trends, %K will spend more time near 20 or 80; the 10-period smoothing delays flips slightly and emphasizes only meaningful turn attempts.
In ranges, %K oscillates around mid-zone (40–60). With 10/10 smoothing, cross signals cluster less densely; combining with the |K–D| gap filter helps keep only decisive crosses.
If your symbol is unusually volatile or illiquid, reduce K Length (e.g., 14) or reduce K Smoothing (e.g., 7) to keep responsiveness. If crosses feel late, decrease D Length (e.g., 7). If noise is excessive, increase K Smoothing first, then consider raising D Length.
Visuals
OB/OS lines: default 80/20 reference levels and a midline at 50.
Masking near edges: %K can be temporarily hidden when it is pressing an edge, approaching it with low slope, or going nearly flat near the boundary. This keeps the panel readable during “stuck at the edge” phases.
Soft glow (optional): highlights %K’s active path; can be turned off.
Light/Dark palette: quick toggle to match your chart theme.
Scale safety: all plotted values (lines, fills, markers) are clamped to 0–100 to prevent the axis from expanding beyond the stochastic range.
Markers and filters
Neutral K–D cross markers: circles in the mid-zone when %K crosses %D.
Edge triangles: show when %K crosses 20 or 80; can be restricted to a session window (02:00–12:00 ET).
Filters (optional):
Min %K slope: require a minimum absolute slope so very flat crosses are ignored.
Min |K–D| gap: demand separation between lines at the cross moment.
%D slope agreement: keep crosses that align with %D’s direction.
Mid-zone mute: suppress crosses inside a user-defined 40–60 band (defaults).
Cooldown: minimum bars between successive markers.
Parameters (quick guide)
K Length / K Smoothing / D Length: core stochastic settings. Start with 20/10/10; tune K Smoothing first if you see too much jitter.
Overbought / Oversold (80/20): adjust for assets that tend to trend (raise to 85/15) or mean-revert (lower to 75/25).
Slope & gap filters: increase on very noisy symbols; reduce if you miss too many crosses.
Session window (triangles only): use if you want edge markers only during active hours.
Marker size and offset: cosmetic; they do not affect calculations.
Alerts
K–D Cross Up (filtered) and K–D Cross Down (filtered): fire when a cross passes your filters/cooldown.
Edge Up / Edge Down: fire when %K crosses the 20/80 levels.
All alerts confirm on bar close.
Notes & attribution
Original implementation and integration by Paifc0de; no third-party code is copied.
This indicator is for research/education and does not provide entries/exits or financial advice.

Bollinger Bands Difference Score
Bollinger Bands Difference Score (TradingView – Pine Script v6)
The **Bollinger Bands Difference Score** is a volatility-based scoring system designed to help traders quickly assess whether a stock is in a **strong trend, neutral zone, or weak setup**. It transforms the raw **Bollinger Band Width (BB-Diff)** into a **normalized score (0–100)** and classifies conditions with intuitive thresholds.
---
### 🔹 What is Bollinger Bands Difference (BB-Diff)?
* **Bollinger Bands** are built from a moving average with upper and lower bands set by standard deviations.
* The **difference (or width)** between the bands reflects market volatility.
* A **high difference** = wide bands = strong volatility (breakout/trend).
* A **low difference** = narrow bands = low volatility (consolidation).
This indicator standardizes BB-Diff into a score and smooths it for cleaner signals.
---
### 🔹 Key Features
1. **BB-Diff Scoring System**
* Converts Bollinger Band width into a **0–100 normalized score**.
* Higher score → higher volatility/trend strength.
* Lower score → consolidation or weaker momentum.
2. **Signal Levels**
* **Strong Zone (≥ 70):** Indicates strong trend strength or expansion in volatility.
* **Neutral Zone (40–70):** Sideways or undecided price action.
* **Weak Zone (≤ 20):** Suggests very low volatility, potential upcoming squeeze.
3. **Score Smoothing**
* Applies a moving average to reduce noise.
* Helps avoid false signals during choppy markets.
4. **Visual Enhancements**
* Plots the score as a line (0–100 scale).
* Adds horizontal reference lines for **Strong**, **Neutral**, and **Weak** levels.
* Background colors automatically highlight **bullish strength (green)** or **weakness (red)**.
---
### 🔹 How to Use
* **Trend Confirmation:**
Look for scores **above 70** → suggests trend continuation or volatility breakout.
* **Consolidation Watch:**
Scores in the **20 or below** zone may precede volatility squeezes → breakout setups.
* **Neutral Zone:**
Scores between **40–70** suggest sideways price action; avoid aggressive trades.
* **Combine with Price Action:**
Use with support/resistance, candlestick patterns, or momentum indicators for confirmation.
---
### 🔹 Best Practices
* Great as a **volatility filter** before entries.
* Use in combination with **RSI, MACD, or OBV** for directional bias.
* Works well for **breakout trading** (when score rises from low levels).
* Monitor on multiple timeframes for alignment.
---
✅ **In summary:** The **Bollinger Bands Difference Score** is a simple yet powerful tool that quantifies volatility strength into an actionable score, making it easier to spot strong trends, consolidation phases, and potential breakout opportunities.
Trading Activity Index (Zeiierman)█ Overview
Trading Activity Index (Zeiierman) is a volume-based market activity meter that transforms dollar-volume into a smooth, normalized “activity index.”
It highlights when market participation is unusually low or high with a dynamic color gradient:
Light Blue → Low Activity (thin participation, low liquidity conditions)
Red/Orange → High Activity (active markets, large trades flowing in)
Additional percentile bands (20/40/60/80%) give context, helping you see whether the current activity level is in the bottom quintile, mid-range, or near historical extremes.
█ How It Works
⚪ Dollar Volume Transformation
Each bar, dollar volume is computed:
float dlrVol = close * volume
float dlrVolAvg = ta.sma(dlrVol, len_form)
Dollar volume = price × volume, smoothed by a configurable SMA window.
The result is log-transformed, compressing large outliers for a more stable signal.
⚪ Rolling Percentiles & Ranking
The log-dollar-volume series is compared to its rolling history (len_hist bars):
float p20 = ta.percentile_linear_interpolation(vscale, len_hist, 20)
float p40 = ta.percentile_linear_interpolation(vscale, len_hist, 40)
float p60 = ta.percentile_linear_interpolation(vscale, len_hist, 60)
float p80 = ta.percentile_linear_interpolation(vscale, len_hist, 80)
A normalized rank (0–1) is produced to color the main Trading Activity line.
█ How to Use
⚪ Detect High-Impact Sessions
Quickly see if today’s session is active or quiet relative to its own history — great for filtering setups that need activity.
⚪ Spot Breakouts & Traps
Combine with price action:
High activity near breakouts = strong follow-through likely.
Low activity breakouts = vulnerable to fake-outs.
⚪ Market Regime Context
Percentile bands help you assess whether participation is building up, in the middle of the range, or drying out — valuable for timing mean-reversion trades.
Above 80th percentile (red/orange) → Market is highly active, breakout trades and trend strategies are favored.
Below 20th percentile (light blue) → Market is quiet; fade moves or wait for expansion.
Watch transitions from blue → orange as a signal of growing institutional participation.
█ Settings
Formation Window (bars) – Number of bars used to average dollar volume before log transform.
History Window (bars) – Lookback period for percentile calculations and rank normalization.
-----------------
Disclaimer
The content provided in my scripts, indicators, ideas, algorithms, and systems is for educational and informational purposes only. It does not constitute financial advice, investment recommendations, or a solicitation to buy or sell any financial instruments. I will not accept liability for any loss or damage, including without limitation any loss of profit, which may arise directly or indirectly from the use of or reliance on such information.
All investments involve risk, and the past performance of a security, industry, sector, market, financial product, trading strategy, backtest, or individual's trading does not guarantee future results or returns. Investors are fully responsible for any investment decisions they make. Such decisions should be based solely on an evaluation of their financial circumstances, investment objectives, risk tolerance, and liquidity needs.

Volume Delta Oscillator with Divergence█ OVERVIEW
The Volume Delta Oscillator with Divergence is a technical indicator designed for the TradingView platform, helping traders identify potential trend reversal points and market momentum shifts through volume delta analysis and divergence detection. The indicator combines a smoothed volume delta oscillator with moving average-based signals, overbought/oversold levels, and divergence visualization, enhanced by configurable gradients and alerts for quick decision-making.
█ CONCEPT
The core idea of the indicator is to measure net buying or selling pressure through volume delta, smooth it for greater clarity, and detect divergences between price action and the oscillator. The indicator does not use external data, making it a compromise but practical tool for analyzing market dynamics based on available price and volume data. It provides insights into market dynamics, overbought/oversold conditions, and potential reversal points, with an attractive visual presentation.
█ WHY USE IT?
- Divergence detection: Identifies bullish and bearish divergences between price and the oscillator, signaling potential reversals.
- Volume delta analysis: Measures cumulative volume delta to assess buying/selling pressure, expressed as a percentage for cross-market comparability.
- Signal generation: Creates buy/sell signals based on overbought/oversold level crossovers, zero line crossovers, and moving average zero line crossovers.
- Visual clarity: Uses gradients, fills, and dynamic colors for intuitive chart analysis.
- Flexibility: Numerous settings allow adaptation to various markets (e.g., forex, crypto, stocks) and trading strategies.
█ HOW IT WORKS?
- Volume delta calculation: Computes net buying/selling pressure per candle as volume * (close - open) / (high - low), aggregated over a specified period (Cumulative Delta Length).
- Smoothing: Applies an EMA (Smoothing Length) to the cumulative delta percentage, creating a smoother oscillator (Delta Oscillator).
- Moving Average: Calculates an SMA (Moving Average Length) of the smoothed delta for trend confirmation (Moving Average (SMA)).
- Divergence detection: Identifies bullish and bearish divergences by comparing price and oscillator pivot highs/lows within a specified range (Pivot Length).
- Normalization: Delta is expressed as a percentage of total volume, ensuring consistency across instruments and timeframes.
- Signals: Generates signals for:
Crossing the oversold level upward (buy) or overbought level downward (sell).
Crossing the zero line by the oscillator or moving average (buy/sell).
Bullish/bearish divergences, marked with labels.
- Visualization: Draws the oscillator and moving average with dynamic colors, gradient fills, and transparent bands and labels, with configurable overbought/oversold levels.
- Alerts: Built-in alerts for divergence detection, overbought/oversold crossovers, and zero line crossovers (both oscillator and moving average).
█ SETTINGS AND CUSTOMIZATION
- Cumulative Delta Length: Period for aggregating volume delta (default: 14).
- Smoothing Length (EMA): EMA length for smoothing the delta oscillator (default: 2). Higher values smooth the signal but reduce the number of generated signals.
- Moving Average Length (SMA): SMA length for the moving average line (default: 40). Higher values allow SMA to be analyzed as a trend indicator, but require adjusting overbought/oversold levels for MA, as longer MA oscillates less.
- Pivot Length (Left/Right): Number of candles for detecting pivot highs/lows in divergence calculations (default: 2). Higher values can reduce noise but introduce a delay equal to the set value.
- Overbought/Oversold Levels: Thresholds for the oscillator (default: 18/-18) and for the moving average (default: 10/-10). For the moving average, no arrows appear; instead, the band changes color from gray to green (oversold) or red (overbought), which can strengthen entry signals for delta.
- Signal Type: Select signals to display: "Overbought/Oversold", "Zero Line", "MA Zero Line", "All", or "None" (default: Overbought/Oversold).
- Colors and gradients: Customize colors for bullish/bearish oscillator, moving average, zero line, overbought/oversold levels, and divergence labels.
- Transparency: Adjust gradient fill transparency (default: 70) and band/label transparency (default: 40) for consistent appearance.
- Visualizations: Enable/disable the moving average, gradients for zero/overbought/oversold levels, and gradient fills.
█ USAGE EXAMPLES
- Momentum analysis: Observe the delta oscillator above 0 for bullish momentum or below 0 for bearish momentum. The moving average (SMA), being smoothed, reacts more slowly and can confirm trend direction as a noise filter.
- Reversal signals: Look for buy triangles when the oscillator crosses the oversold level upward, especially when the moving average is below the MA oversold threshold. Similarly, look for sell triangles when crossing the overbought level downward, with the moving average above the MA overbought threshold. Divergence labels (bullish/bearish) indicate potential reversals.
- Divergence trading: Use bullish divergence labels (green) for potential buy opportunities and bearish labels (red) for sell opportunities, especially when confirmed by price action or other indicators.
- Customization: Adjust the cumulative delta length, smoothing, and moving average length to specific instruments and timeframes to minimize false signals.
█ NOTES FOR USERS
- Combine the indicator with other tools, such as Fibonacci levels, RSI, or pivot points, to increase accuracy.
- Test different settings for cumulative delta length, smoothing, and moving average length on your chosen instrument and timeframe to find optimal values.
