40 Ticker Cross-Sectional Z-Scores [BackQuant]40 Ticker Cross-Sectional Z-Scores
BackQuant’s 40 Ticker Cross-Sectional Z-Scores is a powerful portfolio management strategy that analyzes the relative performance of up to 40 different assets, comparing them on a cross-sectional basis to identify the top and bottom performers. This indicator computes Z-scores for each asset based on their log returns and evaluates them relative to the mean and standard deviation over a rolling window. The Z-scores represent how far an asset's return deviates from the average, and these values are used to rank the assets, allowing for dynamic asset allocation based on performance.
By focusing on the strongest-performing assets and avoiding the weakest, this strategy aims to enhance returns while managing risk. Additionally, by adjusting for standard deviations, the system offers a risk-adjusted method of ranking assets, making it suitable for traders who want to dynamically allocate capital based on performance metrics rather than just price movements.
Key Features
1. Cross-Sectional Z-Score Calculation:
The system calculates Z-scores for 40 different assets, evaluating their log returns against the mean and standard deviation over a rolling window. This enables users to assess the relative performance of each asset dynamically, highlighting which assets are performing better or worse compared to their historical norms. The Z-score is a useful statistical tool for identifying outliers in asset performance.
2. Asset Ranking and Allocation:
The system ranks assets based on their Z-scores and allocates capital to the top performers. It identifies the top and bottom assets, and traders can allocate capital to the top-performing assets, ensuring that their portfolio is aligned with the best performers. Conversely, the bottom assets are removed from the portfolio, reducing exposure to underperforming assets.
3. Rolling Window for Mean and Standard Deviation Calculations:
The Z-scores are calculated based on rolling means and standard deviations, making the system adaptive to changing market conditions. This rolling calculation window allows the strategy to adjust to recent performance trends and minimize the impact of outdated data.
4. Mean and Standard Deviation Visualization:
The script provides real-time visualizations of the mean (x̄) and standard deviation (σ) of asset returns, helping traders quickly identify trends and volatility in their portfolio. These visual indicators are useful for understanding the current market environment and making more informed allocation decisions.
5. Top & Bottom Performer Tables:
The system generates tables that display the top and bottom performers, ranked by their Z-scores. Traders can quickly see which assets are outperforming and underperforming. These tables provide clear and actionable insights, helping traders make informed decisions about which assets to include in their portfolio.
6. Customizable Parameters:
The strategy allows traders to customize several key parameters, including:
Rolling Calculation Window: Set the window size for the rolling mean and standard deviation calculations.
Top & Bottom Tickers: Choose how many of the top and bottom assets to display and allocate capital to.
Table Orientation: Select between vertical or horizontal table formats to suit the user’s preference.
7. Forward Test & Out-of-Sample Testing:
The system includes out-of-sample forward tests, ensuring that the strategy is evaluated based on real-time performance, not just historical data. This forward testing approach helps validate the robustness of the strategy in dynamic market conditions.
8. Visual Feedback and Alerts:
The system provides visual feedback on the current asset rankings and allocations, with dynamic labels and plots on the chart. Additionally, users receive alerts when allocations change, keeping them informed of important adjustments.
9. Risk Management via Z-Scores and Std Dev:
The system’s approach to asset selection is based on Z-scores, which normalize performance relative to the historical mean. By incorporating standard deviation, it accounts for the volatility and risk associated with each asset. This allows for more precise risk management and portfolio construction.
10. Note on Mean Reversion Strategy:
If you take the inverse of the signals provided by this indicator, the strategy can be used for mean-reversion rather than trend-following. This would involve buying the underperforming assets and selling the outperforming ones. However, it's important to note that this approach does not work well with highly correlated assets, as the relationship between the assets could result in the same directional movement, undermining the effectiveness of the mean-reversion strategy.
References
www.uts.edu.au
onlinelibrary.wiley.com
www.cmegroup.com
Final Thoughts
The 40 Ticker Cross-Sectional Z-Scores strategy offers a data-driven approach to portfolio management, dynamically allocating capital based on the relative performance of assets. By using Z-scores and standard deviations, this strategy ensures that capital is directed to the strongest performers while avoiding weaker assets, ultimately improving the risk-adjusted returns of the portfolio. Whether you’re focused on trend-following or looking to explore mean-reversion strategies, this flexible system can be tailored to suit your investment goals.
"文华财经tick价格" için komut dosyalarını ara

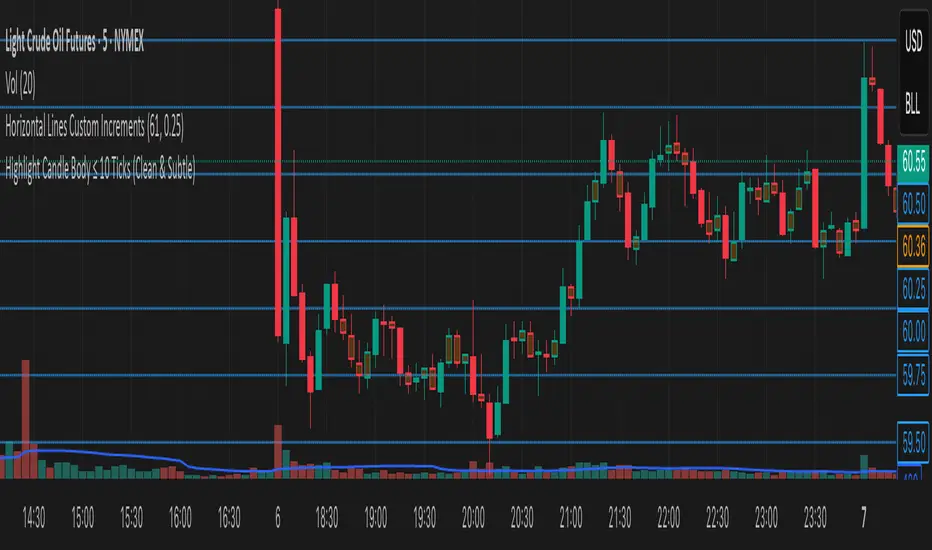
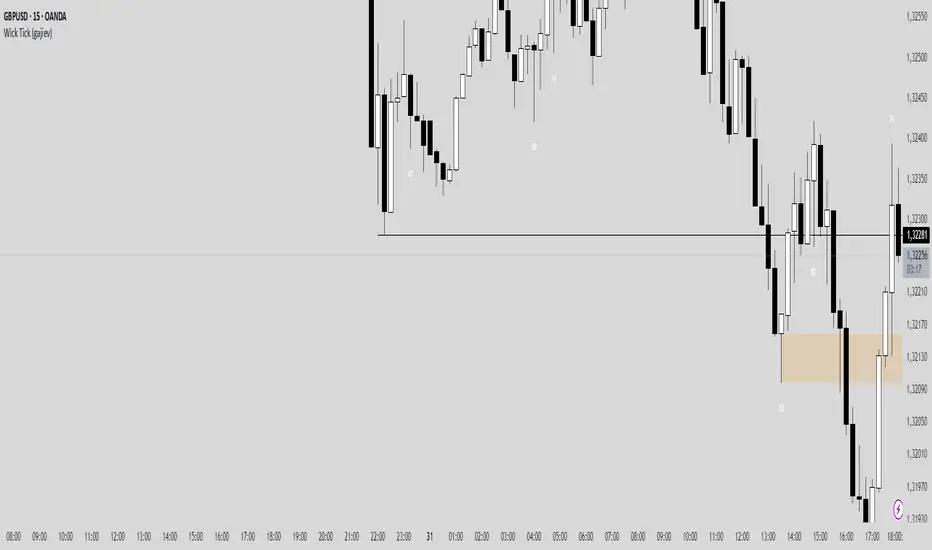
Highlight Candle Body ≤ 10 Ticks (Clean & Subtle)Purpose:
This indicator highlights candlesticks where the body size (difference between open and close) is 10 ticks or less, specifically for instruments like Crude Oil futures (CL) where 1 tick = 0.01.
How it works:
It calculates the body size: abs(close - open)
If the body is ≤ 0.10 (10 ticks), the candle is softly colored in muted orange.
Wicks are ignored — only the body is considered.
No additional shapes or markers — clean and minimal.
Use case:
Helps identify periods of indecision or low momentum — such as potential pause candles, traps, or setups just before volatility returns.
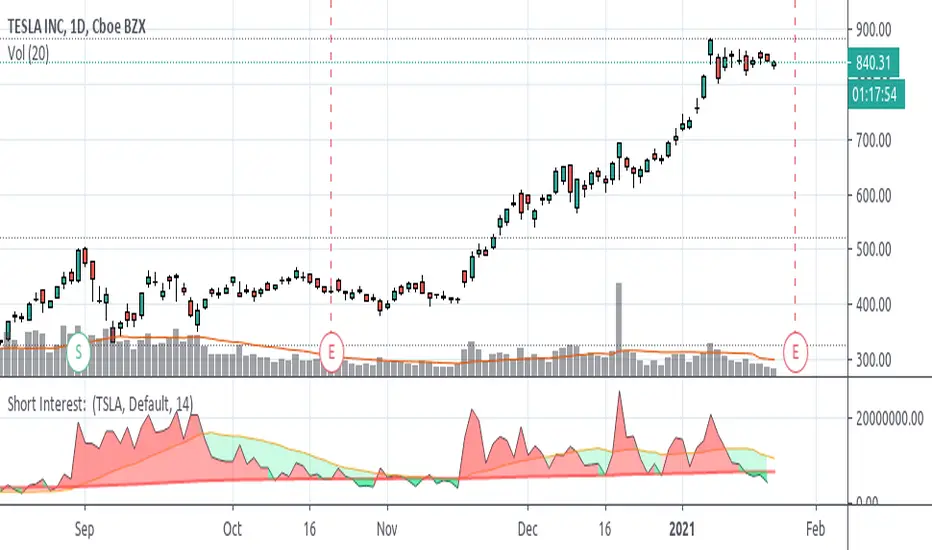
Short Interest on Most TickersFrom searching on QUANDL I found that FINRA provides some data on Short Interest. From my understanding, it does this through two separate QUANDL codes, one for the NASDAQ Exchange and one for the NYSE Exchange. I decided to just add those 2 values together to arrive at a value for Short Interest.
I haven't tested a TON of stocks, but you should be able to type a symbol and pull SI data if it exists in QUANDL. Some tickers might need some adjustments to how you would type them, for example: in TradingView if you wanted Berkshire Hathaway Class A, you type "BRK.A", but for QUANDL you would need to enter "BRK_A" into the text field.
You can search through QUANDL for these tickers in FINRA here-
www.quandl.com
Once you find the ticker you like, click that link, look near the top-right for where it says "Quandl Code" and look for the text at the end.
NOTE: because this data is refreshed daily, after close, it is NOT REAL-TIME!! It is not an indicator you can track intraday or during the day to try and trade . Because of this I have added the following code-
fix = barstate.isrealtime ? na : out
Without this code you would be seeing yesterday's data show up for today. I left the Moving Average's to continue on, though.
I made a few other outputs available to view the data-- by Percent Rank, Stochastic (3sma smoothed), and Relative Strength Index. These might be useful to some, I think they are a bit difficult to read and make much useful interpretation, but they're there regardless.
Please let me know if there are any errors in the Pine Script, something about the QUANDL data that I have misinterpreted, etc. And feel free to use the source code to how you please (obvious disclaimer is you are not allowed to take it and sell it for profits as your own on TradingView or elsewhere).
Example: Output via Stochastics
Example: Output via % Rank
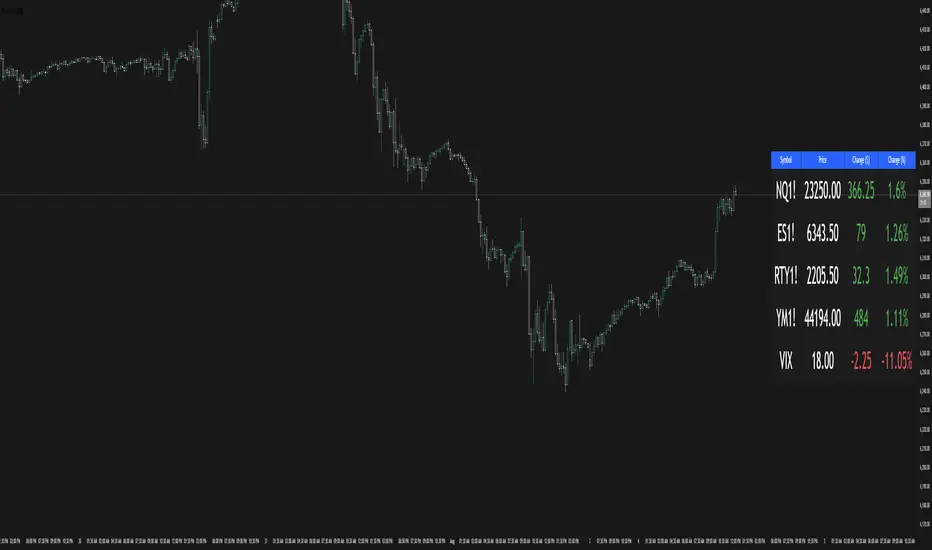
Multi-Ticker TableMulti-Ticker Table
A customizable TradingView indicator that displays a clean, organized table of up to 10 user-defined ticker symbols with their current daily price, daily dollar change, and daily percentage change.
Key features include:
Enable/disable individual tickers with custom symbols
Customizable font sizes and colors for header and body rows
Customizable table background colors for header and data rows
Flexible table positioning anywhere on the chart (top/middle/bottom × left/center/right)
Highlights positive changes in green and negative changes in red for quick visual analysis
Hides chart candles to display the table as a standalone dashboard
Ideal for traders who want a quick, at-a-glance summary of multiple markets or instruments without cluttering the chart.
Wick TickMy indicator shows the tick size of the candle wick. In the settings, you can specify how many ticks to display information on the screen.
Multi Ticker Price TableTable showing the current price of up to 7 tickers
- Tickers are user choice
- Table background is customizable
- User has the choice to turn the Daily % column off

Custom Time Frame (CTF)This indicator allows users to create their own arbitrary time frames for chart analysis. It features a moving average, providing an additional layer of analysis, and offers flexibility through various open settings.
In terms of user settings and usage, the indicator provides several options. Users can choose their interval style, opting for either tick-based or time-based intervals. This flexibility allows for a more granular approach to data analysis, catering to different trading strategies and preferences. The number of ticks or the amount of time for each candle can be adjusted, enabling traders to set the granularity of the data to their liking. Color settings are also customizable, with options for setting colors for bullish and bearish indicators, adding a visual dimension to the analysis.
The average line parameters are an important aspect of this indicator. Users can adjust the length, ripple, type, color, and line width of the average line. The ripple setting, in particular, impacts the smoothness of the filter. With type II setting, the smoothing is increased, making it suitable for traders who prefer a more smoothed out moving average. Conversely, the type I setting decreases the smoothing, which might be preferred by those who want a more responsive indicator.
The use of the Chebyshev filter is a significant feature of this indicator. This filter is chosen for its high-performance smoothing capabilities with minimal data requirements. This ensures that the moving average appears quickly and accurately, which is crucial in real-time chart analysis. An important point to note is that when the moving average is enabled, it decreases the maximum number of candles that can be displayed on the chart. However, this is offset by the enhanced analytical precision provided by the moving average.
In summary, this indicator is especially beneficial for traders without access to premium accounts. It offers the capability to create low or custom time frame charts. The flexibility in settings, coupled with the inclusion of a Chebyshev filter for the moving average, makes it a versatile and valuable tool for detailed market analysis. It caters to a wide range of trading styles and strategies, making it a useful addition to any trader's toolkit.

Compare ticker against SPX - yoyo This script is built on a request of one of the best trader yoyo. The script compares the performance of a tickers against SPX.
The script gives user option to override default SPX ticker to a ticker of their choice using settings.
The script does a % change comparison against base stock which is SPX by default for same timeframes and you can see relativity of stock to the other.
It also does plot a line that shows any divergence.
MultiPrice AlertThis is an alert script using Pinescript version 4. This enables one to set 5 alerts (1 StopLoss, 4 Targets), on 3 different symbols, at using a single alert in the UI.
Every visible line will only appear on the symbols that are selected. After setting targets when making an alert, select this indicator as a condition. Change the name to whatever you want, usually the names of the set of tickers.
The Alert message is dyanmic showing which Symbol with each type of alert, at whatever price.
Ability to disable the targets + symbols.
Alerts work by Stop Loss crossing under price and Targets Cross Over. Enabling the "Short" Targets reverses this.
The line that is being displayed is actually the price of the asset being moved over x number of bars. I have not found a way to plot a traditional horizontal line, as the code for it uses a fixed price.
As it being a user input, it is a variable. Any help with this would be appreicated.
Alerts are set to once per bar.
Known bug that sometimes if the prices that you set are inside the current candle stick, then your alert will immeaditally fire, either change the timeframe or let it fire and wait fo
After a target is hit, I reccomend setting the alert to 0 and REMAKING the alert. You MUST REMAKE THE ALERT AFTER ANY CHANGES. This script WILL NOT CHANGE ALERTS AS YOU CHANGE SETTINGS.
TradingView Alerts are not this smart , at least I haven't found a way to do this yet.

Selectable Ticker DIXWith this script you can select 10 tickers and see the aggregated DIX for them. I have the highest volume equity ETFs as defaults, but one could easily select FAANGM and a few other mega caps and make a FAANGM DIX index by changing the tickers in the settings. One improvement item that I have not gotten around to doing is to create a dollar weighted version of this, similar to the actual Squeezemetrics SPX DIX. This is "equal weighted" To make a dollar weighted version, multiply each by the daily closing price essentially and THEN find the average. It is possible to do I just have not taken the time to do it. It is on the list of things to do. If anyone has a solution PM me and I will add it. Thanks.

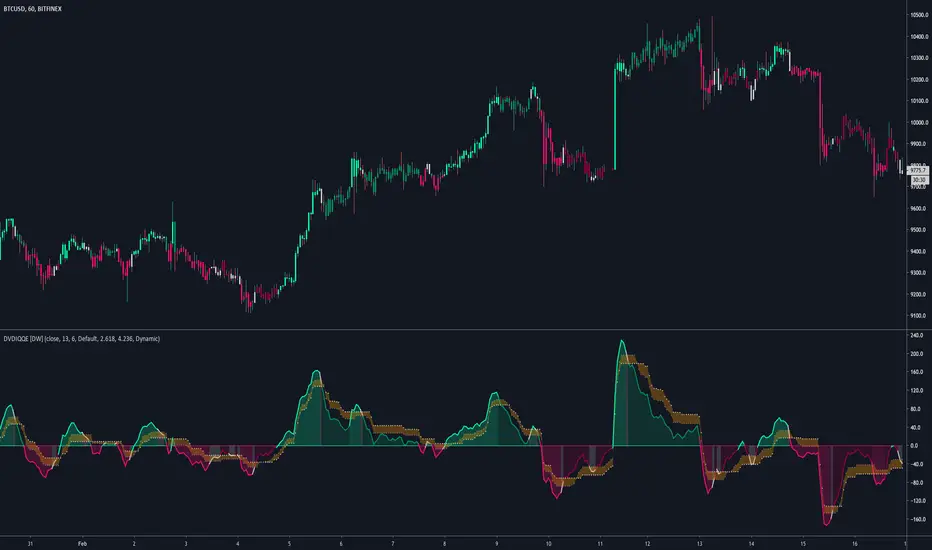
DVDIQQE [DW]This is an experimental study inspired by the Quantitative Qualitative Estimation indicator designed to identify trend and wave activity.
In this study, rather than using RSI for the calculation, the Dual Volume Divergence Index oscillator is utilized.
First, the DVDI oscillator is calculated by taking the difference between PVI and its EMA, and NVI and its EMA, then taking the difference between the two results.
Optional parameters for DVDI calculation are included within this script:
- An option to use tick volume rather than real volume for the volume source
- An option to use cumulative data, which sums the movements of the oscillator from the beginning to the end of TradingView's maximum window to give a more broad picture of market sentiment
Next, two trailing levels are calculated using the average true range of the oscillator. The levels are then used to determine wave direction.
Lastly, rather than using 0 as the center line, it is instead calculated by taking a cumulative average of the oscillator.
Custom bar colors are included.
Note: For charts that have no real volume component, use tick volume as the volume source.
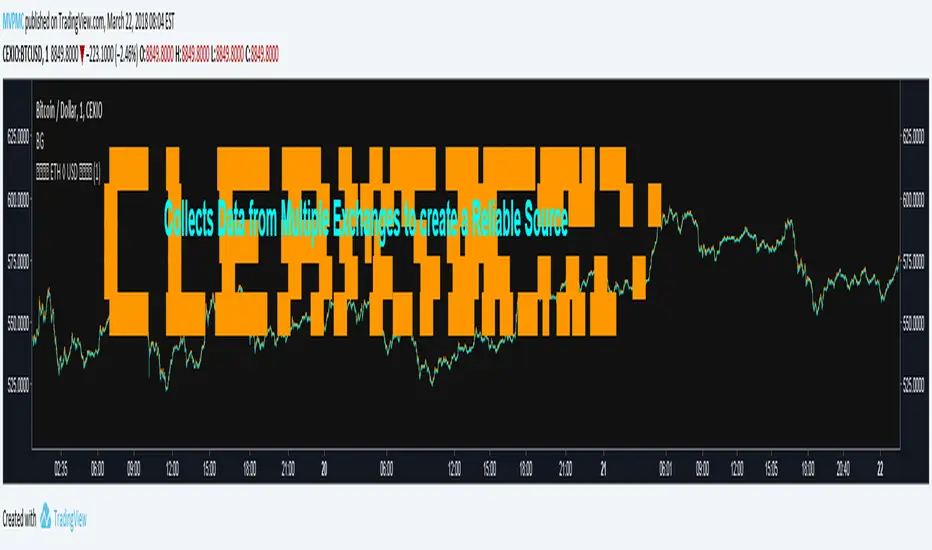
CMYK CLEANSIGNAL ETHUSD ◊ Introduction
This is CLEANSIGNAL
A script that combines Ticker data from multiple exchanges to create a more reliable source.
◊ Origin
This is a part of Project XIAM.
◊ Theoretical Approach
Philosophy a :: Cleansignal
◊ Usage
This is a source script intended to replace your current ticker.
You can apply Indicators on this script , just select the source in their settings.
My own indicators will be updated soon, to include source selection in their settings.
◊ Features
Close / High / Low / Volume data from 10 exchanges !
BITFINEX ◊ BITSTAMP ◊ COINBASE ◊ CEXIO ◊ WEX ◊ HITBTC ◊ GEMINI ◊ POLONIEX ◊ OKCOIN ◊ KRAKEN
◊ Community
Wanna share your findings ? or need help resolving a problem ?
CMYK :: discord.gg
AUTOVIEW :: discordapp.com
TRADINGVIEW UNOFFICIAL :: discord.gg
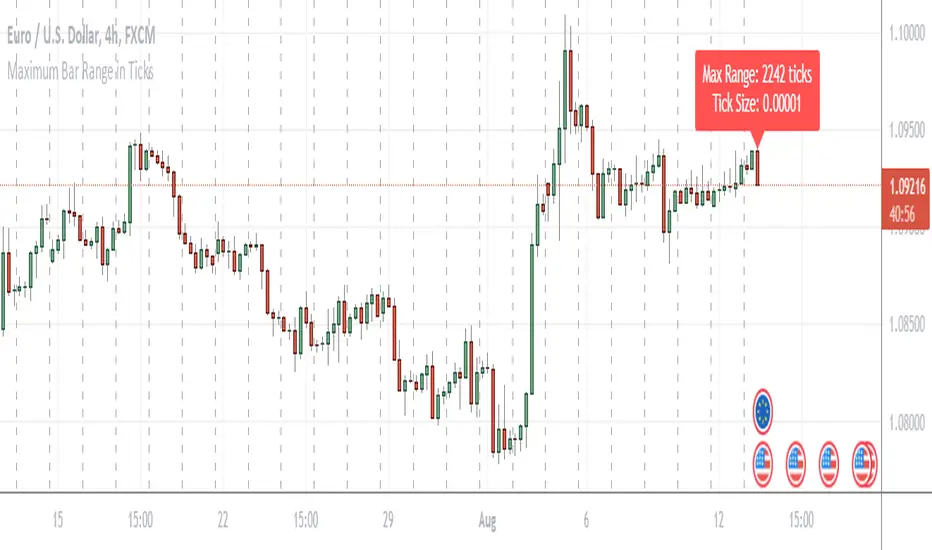
Maximum Bar Range in TicksThis is a simple indicator that gives the maximum range of any bar on the chart in ticks. I found it useful when sizing arrays and it might also be valuable when working out risk parameters.
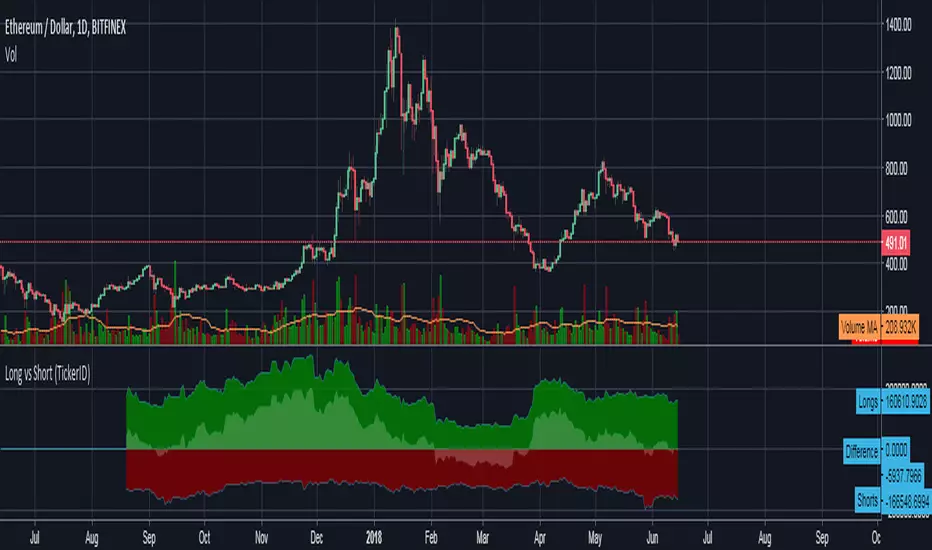
Bitfinex Long vs Short (TickerID)Uses the active ticker to show long/short values on all Bitfinex pairs that have that data available on Tradingview.

SMA Pro (Tick)Simple moving average based on 100 ticks, by default. Use for high volume markets like ES, NQ, and RTY.

QQQ Ladder → Adjusted to Active Ticker (5s & 10s)This indicator allows you to a grid of QQQ levels directly on futures chart like NQ, MNQ, ES and MES, automatically adjusting for the spread between the displayed symbol and QQQ. This is particularly useful for traders who perform technical analysis on QQQ but execute trades on Futures.
Features:
Renders every 5 and 10 points steps of QQQ in your current chart.
The script adjusts these levels in real-time based on the current spread between QQQ and the displayed symbol!
Plots updated horizontal lines that move with the spread
Supports Multiple Tickers, ES1!, MES1!, NQ1!, MNQ1! SPY and SPX500USD.

SPX Ladder → Adjusted to Active Ticker (5s & 10s)This indicator allows you to a grid of SPX levels directly on the ES1! (E-mini S&P 500 Futures) chart, automatically adjusting for the spread between SPX and ES1!. This is particularly useful for traders who perform technical analysis on SPX but execute trades on ES1!.
Features:
Renders every 5 and 10 points steps of the SPX in your current chart.
The script adjusts these levels in real-time based on the current spread between SPX and ES1!
Plots updated horizontal lines that move with the spread
Supports Multiple Tickers, ES1!, SPY and SPX500USD.
Ideal for futures traders who want SPX context while trading ES1!.

NDX Levels Adjusted to Active TickerThis indicator allows you to plot custom NDX levels directly on the NQ1! (E-mini NASDAQ-100 Futures) chart, automatically adjusting for the spread between NDX and NQ1!. This is particularly useful for traders who perform technical analysis on NDX but execute trades on NQ1!.
Features:
Input up to three NDX key levels to track (e.g., 23000, 24000, 25000).
The script adjusts these levels in real-time based on the current spread between NDX and NQ1!
Displays the spread in the chart header for quick reference
Plots updated horizontal lines that move with the spread
Includes optional labels showing the spread periodically to reduce clutter
Supports Multiple Tickers: NQ1!, QQQ, NAS100 and NAS100USD.
Ideal for futures traders who want SPX context while trading NQ1!, QQQ, NAS100 or NAS100USD..

SPX Levels Adjusted to Active TickerThis indicator allows you to plot custom SPX levels directly on the ES1! (E-mini S&P 500 Futures) chart, automatically adjusting for the spread between SPX and ES1!. This is particularly useful for traders who perform technical analysis on SPX but execute trades on ES1!.
Features:
Input up to three SPX key levels to track (e.g., 5000, 4950, 4900)
The script adjusts these levels in real-time based on the current spread between SPX and ES1!
Displays the spread in the chart header for quick reference
Plots updated horizontal lines that move with the spread
Includes optional labels showing the spread periodically to reduce clutter
Supports Multiple Tickers, ES1!, SPY and SPX500USD.
Ideal for futures traders who want SPX context while trading ES1!.

Vietnamese Stocks: Multi-Ticker Fibonacci AlertThis Pine Script™ indicator is designed specifically for traders monitoring the Vietnamese stock market (HOSE, HNX). Its primary goal is to automate the tracking of Fibonacci retracement levels across a large list of stocks, alerting you when prices breach key support zones.
Core Functionality:
The script calculates Fibonacci retracement levels (23.6%, 38.2%, 50%, 61.8%, 78.6%) for up to 40 tickers simultaneously. The calculation is based on the highest high and lowest low identified since a user-defined Start Time. This allows you to anchor the Fibonacci analysis to a specific market event, trend start, or time period relevant to your strategy.
What it Does For You:
Automated Watchlist Scanning: Instead of drawing Fib levels on dozens of charts, select one of the two pre-configured watchlists (up to 40 symbols each, customizable in settings) populated with popular Vietnamese stocks.
Time-Based Fibonacci: Define a Start Time in the settings. The script uses this date to find the subsequent highest high and lowest low for each symbol in your chosen watchlist, forming the basis for the Fib calculation.
Intelligent Alerts: Get notified via TradingView's alerts when the candle closing price of any stock in your active watchlist falls below the critical 38.2%, 50%, 61.8%, or 78.6% levels relative to its own high/low range since the start time. Alerts are consolidated for efficiency.
Visual Aids:
- Plots the same time-based Fibonacci levels directly on your current chart symbol for quick reference.
- Includes an optional on-chart table showing which monitored stocks are currently below key Fib levels (enable "Show Debug Info").
- Features experimental background coloring to highlight potential bullish signals on the current chart.
Configuration:
Start Time: Crucial input – sets the anchor point for Fib calculations.
WatchList Selection: Choose between WatchList #1 (Bluechip/Midcap focus) or WatchList #2 (Defensive/Other focus) using the boolean toggles.
Symbol Customization: Easily replace the default symbols with your preferred Vietnamese stocks directly in the indicator settings.
Notification Prefix: Add custom text to the beginning of your alert messages.
Alert Setup: Remember to create an alert in TradingView, selecting this indicator and the alert() condition, usually with "Once Per Bar Close" frequency.
This tool is open-source under the MPL 2.0 license. Feel free to use, modify, and learn from it.

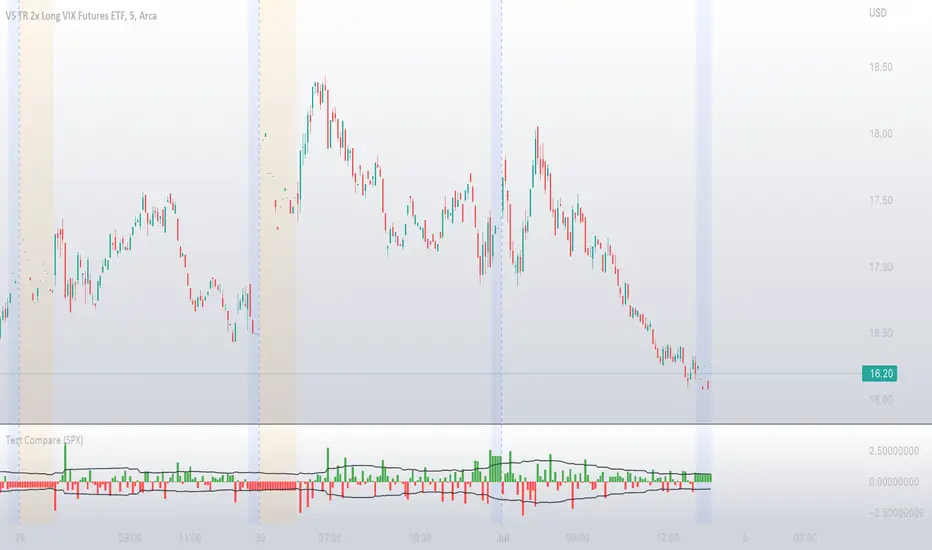
Dynamic Ticks Oscillator Model (DTOM)The Dynamic Ticks Oscillator Model (DTOM) is a systematic trading approach grounded in momentum and volatility analysis, designed to exploit behavioral inefficiencies in the equity markets. It focuses on the NYSE Down Ticks, a metric reflecting the cumulative number of stocks trading at a lower price than their previous trade. As a proxy for market sentiment and selling pressure, this indicator is particularly useful in identifying shifts in investor behavior during periods of heightened uncertainty or volatility (Jegadeesh & Titman, 1993).
Theoretical Basis
The DTOM builds on established principles of momentum and mean reversion in financial markets. Momentum strategies, which seek to capitalize on the persistence of price trends, have been shown to deliver significant returns in various asset classes (Carhart, 1997). However, these strategies are also susceptible to periods of drawdown due to sudden reversals. By incorporating volatility as a dynamic component, DTOM adapts to changing market conditions, addressing one of the primary challenges of traditional momentum models (Barroso & Santa-Clara, 2015).
Sentiment and Volatility as Core Drivers
The NYSE Down Ticks serve as a proxy for short-term negative sentiment. Sudden increases in Down Ticks often signal panic-driven selling, creating potential opportunities for mean reversion. Behavioral finance studies suggest that investor overreaction to negative news can lead to temporary mispricings, which systematic strategies can exploit (De Bondt & Thaler, 1985). By incorporating a rate-of-change (ROC) oscillator into the model, DTOM tracks the momentum of Down Ticks over a specified lookback period, identifying periods of extreme sentiment.
In addition, the strategy dynamically adjusts entry and exit thresholds based on recent volatility. Research indicates that incorporating volatility into momentum strategies can enhance risk-adjusted returns by improving adaptability to market conditions (Moskowitz, Ooi, & Pedersen, 2012). DTOM uses standard deviations of the ROC as a measure of volatility, allowing thresholds to contract during calm markets and expand during turbulent ones. This approach helps mitigate false signals and aligns with findings that volatility scaling can improve strategy robustness (Barroso & Santa-Clara, 2015).
Practical Implications
The DTOM framework is particularly well-suited for systematic traders seeking to exploit behavioral inefficiencies while maintaining adaptability to varying market environments. By leveraging sentiment metrics such as the NYSE Down Ticks and combining them with a volatility-adjusted momentum oscillator, the strategy addresses key limitations of traditional trend-following models, such as their lagging nature and susceptibility to reversals in volatile conditions.
References
• Barroso, P., & Santa-Clara, P. (2015). Momentum Has Its Moments. Journal of Financial Economics, 116(1), 111–120.
• Carhart, M. M. (1997). On Persistence in Mutual Fund Performance. The Journal of Finance, 52(1), 57–82.
• De Bondt, W. F., & Thaler, R. (1985). Does the Stock Market Overreact? The Journal of Finance, 40(3), 793–805.
• Jegadeesh, N., & Titman, S. (1993). Returns to Buying Winners and Selling Losers: Implications for Stock Market Efficiency. The Journal of Finance, 48(1), 65–91.
• Moskowitz, T. J., Ooi, Y. H., & Pedersen, L. H. (2012). Time Series Momentum. Journal of Financial Economics, 104(2), 228–250.

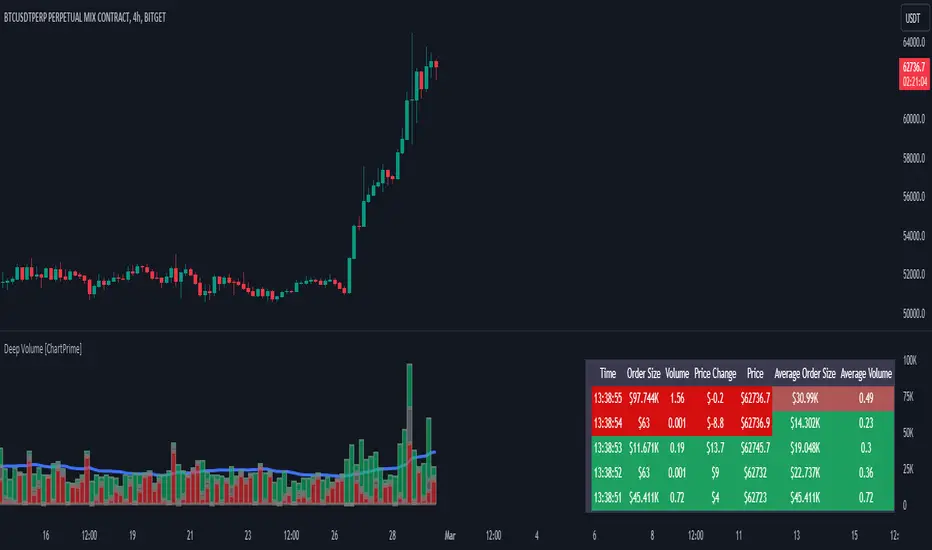
Deep Volume [ChartPrime]Deep Volume is an indicator designed to give you high fidelity volume information. It does this by utilizing real time data provided by Tradingview to generate a wide range of metrics. We have included a convenient column chart to visualize the polarity of the volume, and a table to see the real time data. This works by utilizing pine script's varip feature to get information within candles. This is convenient as it allows users to get lower time frame information without the use of ltf functions. The result is seconds level data with out the need to be on a lower time frame chart. As a result, as you increase the time frame of the chart the updates will become slower. This is because Tradingview doesn't update the chart information as frequently on higher time frames as there isn't as much of a need.
This indicator works on real time data so to compensate for this we generate a simulated history based on candle structure. This helps in estimating the state of the moving average before the real time data starts. As a result the estimated history isn't as accurate and should be treated as such. That being said it is nice to have an estimation when the indicator is first loaded onto the chart.
Finally we have included a cumulative volume comparison that shows you how much volume there is compared to the average cumulative volume for the day. This metric utilizes a gradient to help you interpret the information at a glance. Low daily volume is represented with grays by default, while normal volume and greater is represented with a green color by default.
The table is partitioned into two sections; tick data, and average data. On the left you will see color coded information based on the direction of the move. On the left, the information is color coded based on the average movement direction. You can control how much information is displayed in the table within the indicators settings. This is defaulted to 20 but it can be as long or short as you like. Every new candle open the far left of the table you will see a 🗘 symbol and at the start of a new session you will see a 🗓 symbol.
The included metrics are as follows:
Time: This displays the time of the real time data update.
Time Delta: This displays the elapsed time between updates.
Order Size: This is the volume times the price change between updates.
Volume: This is the volume change for the update.
Price Change: This is the change in price since the last update.
Price: This is the price of the asset at the time of the update.
Speed of Tape: This is the average time delta. Use this to see how quickly the market is moving.
Average Order Size: This is the average order size.
Average Volume: This is the average volume
Volume Ratio: This the the ratio of bullish to bearish volume as expressed by a percent. 100% is all bullish within the window and -100% is all bearish within the window.
Average Price Change: This is the average price change within the window.
Sensitivity: This is a volatility metric designed to show you the price change per 1 volume unit.
Relative Sensitivity: This is a volatility metric designed to show you the average price change per average volume.
Enjoy