Heikin Ashi Price DetectionThis script performs custom calculations for both bullish and bearish bars, providing a numerical result that can be used to gauge price movements and potential trading signals.
How It Works
Bullish Bars:
Calculates the absolute difference between the open and low prices (BullOpenLow).
Calculates the absolute difference between the high and close prices (BullHighClose).
Compares BullOpenLow and BullHighClose:
If BullOpenLow is greater, the difference is divided by BullOpenLow.
If BullHighClose is greater, the difference is divided by BullHighClose.
The result is normalized to a percentage and subtracted from 100 to produce a final value.
Bearish Bars:
Calculates the absolute difference between the close and low prices (BearCloseLow).
Calculates the absolute difference between the high and open prices (BearHighOpen).
Compares BearCloseLow and BearHighOpen:
If BearCloseLow is greater, the difference is divided by BearCloseLow.
If BearHighOpen is greater, the difference is divided by BearHighOpen.
The result is normalized to a percentage and subtracted from 100 to produce a final value.
Key Features
Bullish and Bearish Calculations: The script identifies bullish and bearish bars and applies separate calculations to each.
Normalized Results: The calculations provide a normalized result that can be easily interpreted.
Visual Representation: Results are plotted on the chart for quick visual reference.
"摩根纳斯达克100基金风险大吗" için komut dosyalarını ara

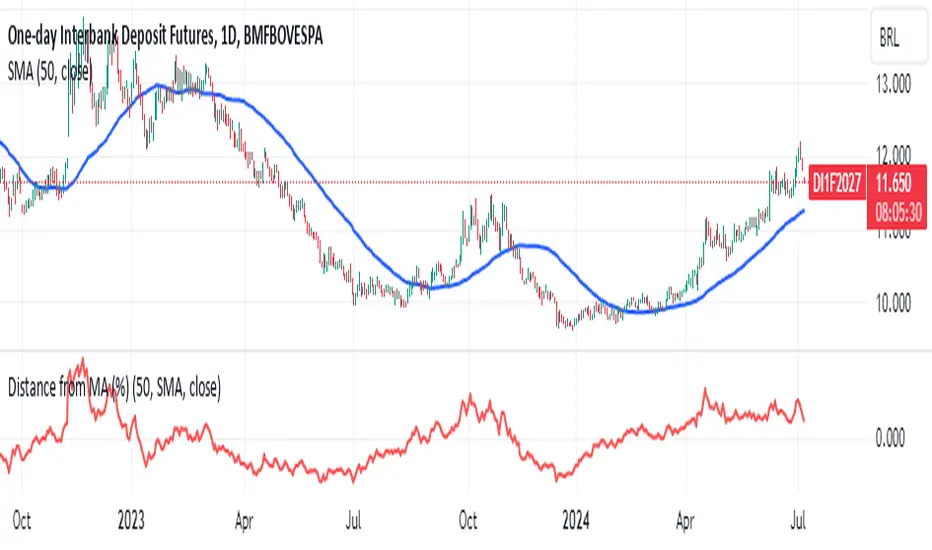
Distance from MA (%)Purpose:
This indicator calculates and plots the distance in percentage between the current price and a specified moving average. The distance is displayed in a separate window below the main price chart.
Features:
Configurable Moving Average Period: You can set the period for the moving average calculation.
Multiple Moving Average Methods: The indicator supports various moving average methods, including Simple Moving Average (SMA), Exponential Moving Average (EMA), Weighted Moving Average (WMA), and Volume Weighted Moving Average (VWMA).
Applied Price Selection: You can choose which price to use for the moving average calculation (e.g., close, open, high, low, etc.).
Parameters:
MA Period: The number of periods to use for the moving average calculation.
MA Method: The type of moving average to use (SMA, EMA, WMA, VWMA).
Applied Price: The price used for the moving average calculation.
Calculation:
Moving Average Calculation:
Depending on the selected method, the indicator calculates the moving average (MA) value for each bar using the specified period and applied price.
Distance in Percentage:
The distance is calculated as the difference between the current price and the moving average value, divided by the moving average value, and then multiplied by 100 to convert it to a percentage.
Formula: Distance %=(Applied Price−MA ValueMA Value)×100Distance %=(MA ValueApplied Price−MA Value)×100
Plotting:
The indicator plots the calculated distance in percentage as a line in a separate window below the main chart. The plot is colored red and has a linewidth of 2 for better visibility.
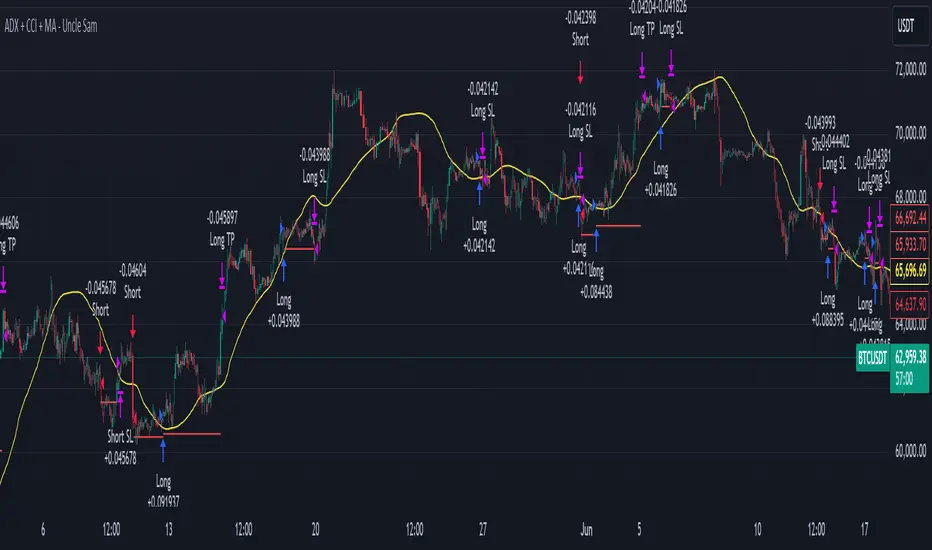
ADX + CCI + MA - Uncle SamStrategy Name: ADX + CCI + MA - Uncle Sam
Overview
This strategy aims to capitalize on trending markets by combining the Average Directional Index (ADX), Commodity Channel Index (CCI), and a customizable Moving Average (MA). It's designed for traders seeking a balanced approach to both long (buy) and short (sell) opportunities. Special thanks to the creators of the ADX and CCI indicators for their invaluable contributions to technical analysis.
Strategy Concept
The core idea is to identify strong trends with the ADX, confirm potential entry points with the CCI, and use the MA to filter trades in the direction of the broader trend. This approach seeks to avoid entering positions during periods of consolidation or when the trend is weak.
Indicator Logic
ADX (Average Directional Index): The ADX measures the strength of a trend, regardless of its direction. A value above the customizable adx_threshold (default 20) signals a strong trend, making it a prime environment for this strategy.
CCI (Commodity Channel Index): The CCI is a momentum oscillator that helps identify overbought (above 100) and oversold (below -100) conditions. We use CCI crossovers to time entries in the direction of the prevailing trend.
MA (Moving Average): The MA acts as a trend filter, ensuring we only enter trades aligned with the overall market direction. You have flexibility in choosing the MA type (SMA, EMA, etc.) and its length to suit your trading style and timeframe.
Entry Conditions
Long (Buy):
ADX is above the adx_threshold.
CCI crosses above 100.
Price is above the chosen Moving Average (if MA trend filtering is enabled).
Short (Sell):
ADX is above the adx_threshold.
CCI crosses below -100.
Price is below the chosen Moving Average (if MA trend filtering is enabled).
Exit Conditions
Stop Loss (SL): Each position has a customizable stop-loss percentage to manage risk. The default setting is 1%.
Take Profit (TP): Each position has a customizable take-profit percentage to secure gains. The default setting is 5%.
MA-Based Risk Management (Optional): This feature allows for early exits if the price closes against the MA trend for a specified number of candles. The default setting is 2 candles.
Default Settings
CCI Period: 15
ADX Length: 10
ADX Threshold: 20
MA Type: HMA
MA Length: 200
MA Source: Close
Commission Fee: $0.0
A commission fee is not added, add your trading/platform commission for realistic trading costs.
Backtest Results
The strategy has been backtested on with the default settings and a starting capital of $1000, with 0.0% commission fee. It shows promising results.
Disclaimer: Backtesting is hypothetical and does not guarantee future performance.
Important Considerations:
Customization: The strategy offers extensive customization to tailor it to your preferences. Experiment with different parameters and settings to find what works best for your trading style.
Risk Management: Always use proper risk management techniques, including position sizing and stop losses, to protect your capital.
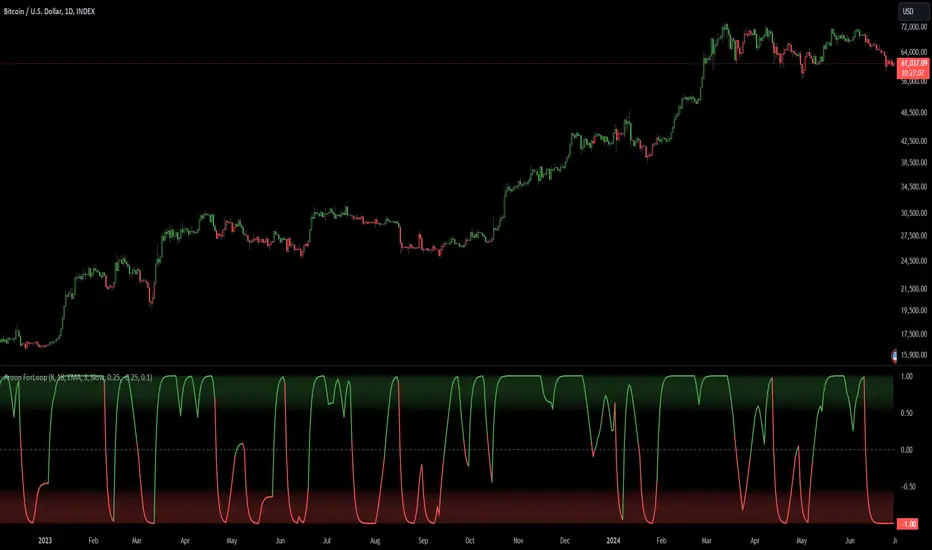
Aroon ForLoop [InvestorUnknown]Overview
The Aroon ForLoop indicator is designed to calculate an array of Aroon values over a range of lengths, providing trend signals based on various moving averages. It offers flexibility with different signal modes and visual customizations.
User Input
Start Length (a) and End Length (b): Defines the range for calculating Aroon values.
MA Type (maType) and MA Length (c): Selects the moving average type (EMA, SMA, WMA, VWMA, TMA) and its length.
Calculation Source (s): Specifies the data source for calculations.
Signal Mode (sigmode): Offers options like Fast, Slow, Thresholds Crossing, and Fast Threshold to generate signals.
Thresholds: Configures long and short thresholds for signal generation.
Visualization Options: Customizes bull and bear colors, and enables/disables bar coloring.
Alert Settings: Chooses whether to wait for bar close for alert confirmation.
Signal Calculation
Signal Mode (sigmode): Determines the type of signal generated by the indicator. Options are "Fast", "Slow", "Thresholds Crossing", and "Fast Threshold".
1. Slow: is a simple crossing of the midline (0).
2. Fast: positive signal depends if the current MA > MA or MA is above 0.99, negative signals comes if MA < MA or MA is below -0.99.
3. Thresholds Crossing: simple ta.crossover and ta.crossunder of the user defined threshold for Long and Short.
4. Fast Threshold: signal changes if the value of Aroon MA changes by more than user defined threshold against the current signal
col1 = MA > 0 ? colup : coldn
var color col2 = na
if MA > MA or MA > 0.99
col2 := colup
if MA < MA or MA < -0.99
col2 := coldn
var color col3 = na
if ta.crossover(MA,longth)
col3 := colup
if ta.crossunder(MA,shortth)
col3 := coldn
var color col4 = na
if (MA > MA + fastth)
col4 := colup
if (MA < MA - fastth)
col4 := coldn
color col = na
if sigmode == "Slow"
col := col1
if sigmode == "Fast"
col := col2
if sigmode == "Thresholds Crossing"
col := col3
if sigmode == "Fast Threshold"
col := col4
else
na
Visualization Settings
Bull Color (colup): The color used to indicate bullish signals.
Bear Color (coldn): The color used to indicate bearish signals.
Color Bars (barcol): Option to color the bars based on the signal.
Custom Function
AroonForLoop: Calculates Aroon values over the specified range, determines the trend, and averages the results using the chosen moving average type.
AroonForLoop(a, b, c) =>
var SignalArray = array.new_float(b - a + 1, 0.0)
for x = 0 to (b - a)
len = a + x
upper = 100 * (ta.highestbars(high, len + 1) + len)/len
lower = 100 * (ta.lowestbars(low, len + 1) + len)/len
trend = upper > lower ? 1 : -1
array.set(SignalArray, x, trend)
Avg = array.avg(SignalArray)
float MA = switch maType
"EMA" => ta.ema(Avg, c)
"SMA" => ta.sma(Avg, c)
"WMA" => ta.wma(Avg, c)
"VWMA" => ta.vwma(Avg, c)
"TMA" => ta.trima(Avg, c)
=>
runtime.error("No matching MA type found.")
float(na)
Important Considerations
Fast Responses: The Aroon ForLoop indicator is designed for quick identification of trend changes, making it ideal for fast-paced trading environments.
Moving Average Types: Supports various MA types (EMA, SMA, WMA, VWMA, TMA) for adaptable smoothing of trend signals.
Combination with Other Indicators: For more reliable signals, use this indicator in conjunction with other technical indicators.
BTC x M2 Divergence (Weekly)### Why the "M2 Money Supply vs BTC Divergence with Normalized RSI" Indicator Should Work
IMPORTANT
- Weekly only indicator
- Combine it with BTC Halving Cycle Profit for better results
The "M2 Money Supply vs BTC Divergence with Normalized RSI" indicator leverages the relationship between macroeconomic factors (M2 money supply) and Bitcoin price movements, combined with technical analysis tools like RSI, to provide actionable trading signals. Here's a detailed rationale on why this indicator should be effective:
1. **Macroeconomic Influence**:
- **M2 Money Supply**: Represents the total money supply, including cash, checking deposits, and easily convertible near money. Changes in M2 reflect liquidity in the economy, which can influence asset prices, including Bitcoin.
- **Bitcoin Sensitivity to Liquidity**: Bitcoin, being a digital asset, often reacts to changes in liquidity conditions. An increase in money supply can lead to higher asset prices as more money chases fewer assets, while a decrease can signal tightening conditions and lower prices.
2. **Divergence Analysis**:
- **Economic Divergence**: The indicator calculates the divergence between the percentage changes in M2 and Bitcoin prices. This divergence can highlight discrepancies between Bitcoin's price movements and broader economic conditions.
- **Market Inefficiencies**: Large divergences may indicate inefficiencies or imbalances that could lead to price corrections or trends. For example, if M2 is increasing (indicating more liquidity) but Bitcoin is not rising proportionately, it might suggest a potential upward correction in Bitcoin's price.
3. **Normalization and Smoothing**:
- **Normalized Divergence**: Normalizing the divergence to a consistent scale (-100 to 100) allows for easier comparison and interpretation over time, making the signals more robust.
- **Smoothing with EMA**: Applying Exponential Moving Averages (EMAs) to the normalized divergence helps to reduce noise and identify the underlying trend more clearly. This double-smoothed divergence provides a clearer signal by filtering out short-term volatility.
4. **RSI Integration**:
- **RSI as a Momentum Indicator**: RSI measures the speed and change of price movements, indicating overbought or oversold conditions. Normalizing the RSI and incorporating it into the divergence analysis helps to confirm the strength of the signals.
- **Combining Divergence with RSI**: By using RSI in conjunction with divergence, the indicator gains an additional layer of confirmation. For instance, a bullish divergence combined with an oversold RSI can be a strong buy signal.
5. **Dynamic Zones and Sensitivity**:
- **Good DCA Zones**: Highlighting zones where the divergence is significantly positive (good DCA zones) indicates periods where Bitcoin might be undervalued relative to economic conditions, suggesting good buying opportunities.
- **Red Zones**: Marking zones with extremely negative divergence, combined with RSI confirmation, identifies potential market tops or bearish conditions. This helps traders avoid buying into overbought markets or consider selling.
- **Peak Detection**: The sensitivity setting for detecting upside down peaks allows for early identification of potential market bottoms, providing timely entry points for traders.
6. **Visual Cues and Alerts**:
- **Clear Visualization**: The plots and background colors provide immediate visual feedback, making it easier for traders to spot significant conditions without deep analysis.
- **Alerts**: Built-in alerts for key conditions (good DCA zones, red zones, sell signals) ensure traders can act promptly based on the indicator's signals, enhancing the practicality of the tool.
### Conclusion
The "M2 Money Supply vs BTC Divergence with Normalized RSI" indicator integrates macroeconomic data with technical analysis to offer a comprehensive view of Bitcoin's market conditions. By analyzing the divergence between M2 money supply and Bitcoin prices, normalizing and smoothing the data, and incorporating RSI for momentum confirmation, the indicator provides robust signals for identifying potential buying and selling opportunities. This holistic approach increases the likelihood of capturing significant market movements and making informed trading decisions.

First 12 Candles High/Low BreakoutThis indicator identifies potential breakout opportunities based on the high and low points formed within the first 12 candles after the market opens on a 5-minute timeframe. It provides visual cues and labels to help traders make informed decisions.
Features:
Market Open High/Low: Marks the highest and lowest price of the first 12 candles following the market open with horizontal lines for reference.
Breakout Signals: Identifies potential buy or sell signals based on the first 5-minute candle closing above the open high or below the open low.
Target and Stop-Loss: Plots horizontal lines for target prices (100 points by default, adjustable) and stop-loss levels (100 points by default, adjustable) based on the entry price.
Visual Cues: Uses green triangles (up) for buy signals and red triangles (down) for sell signals.
Informative Labels: Displays labels with "Buy" or "Sell" text, target price, and stop-loss price next to the entry signals (optional).
Customization:
You can adjust the target and stop-loss point values using the provided inputs.
How to Use:
Add the script to your TradingView chart.
The indicator will automatically plot the open high, open low, potential entry signals, target levels, and stop-loss levels based on the first 12 candles after the market opens.
Use the signals and price levels in conjunction with your own trading strategy to make informed decisions.

VAWSI and Trend Persistance Reversal Strategy SL/TPThis is a completely revamped version of my "RSI and ATR Trend Reversal Strategy."
What's New?
The RSI has been replaced with an original indicator of mine, the "VAWSI," as I've elected to call it.
The standard RSI measures a change in an RMA to determine the strength of a movement.
The VAWSI performs very similarly, except it uses another original indicator of mine, the VAWMA.
VAWMA stands for "Volume (and) ATR Weight Moving Average." It takes an average of the volume and ATR and uses the ratio of each bar to weigh a moving average of the source.
It has the same formula as an RSI, but uses the VAWMA instead of an RMA.
Next we have the Trend Persistence indicator, which is an index on how long a trend has been persisting for. It is another original indicator. It takes the max deviation the source has from lowest/highest of a specified length. It then takes a cumulative measure of that amount, measures the change, then creates a strength index with that amount.
The VAWSI is a measure of an emerging trend, and the Trend Persistence indicator is a measure of how long a trend has persisted.
Finally, the 3rd main indicator, is a slight variation of an ATR. Rather than taking the max of source - low or high- source and source - source , it instead takes the max of high-low and the absolute value of source - the previous source. It then takes the absolute value of the change of this, and normalizes it with the source.
Inputs
Minimum SL/TP ensures that the Stop Loss and Take Profit still exist in untrendy markets. This is the minimum Amount that will always be applied.
VAWSI Weight is a divided by 100 multiplier for the VAWSI. So value of 200 means it is multiplied by 2. Think of it like a percentage.
Trend Persistence weight and ATR Weight are applied the same. Higher the number, the more impactful on the final calculation it is.
Combination Mult is an outright multiplier to the final calculation. So a 2.0 = * 2.0
Trend Persistence Smoothing Length is the length of the weighted moving average applied to the Trend Persistence Strength index.
Length Cycle Decimal is a replacement of length for the script.
Here we used BlackCat1402's Dynamic Length Calculation, which can be found on his page. With his permission we have implemented it into this script. Big shout out to them for not only creating, but allowing us to use it here.
The Length Cycle Decimal is used to calculate the dynamic length. Because TradingView only allows series int for their built-in library, a lot of the baseline indicators we use have to be manually recreated as functions in the following section.
The Strategy
As usual, we use Heiken Ashi values for calculations.
We begin by establishing the minimum SL/TP for use later.
Next we determine the amount of bars back since the last crossup or crossdown of our threshold line.
We then perform some normalization of our multipliers. We want a larger trend or larger VAWSI amount to narrow the threshold, so we have 1 divide them. This way, a higher reading outputs a smaller number and vice versa. We do this for both Trend Persistence, and the VAWSI.
The VAWSI we also normalize, where rather than it being a 0-100 reading of trend direction and strength, we absolute it so that as long as a trend is strong, regardless of direction, it will have a higher reading. With these normalized values, we add them together and simply subtract the ATR measurement rather than having 1 divide it.
Here you can see how the different measurements add up. A lower final number suggests imminent reversal, and a higher final number suggests an untrendy or choppy market.
ATR is in orange, the Trend Persistence is blue, the VAWSI is purple, and the final amount is green.
We take this final number and depending on the current trend direction, we multiply it by either the Highest or Lowest source since the last crossup or crossdown. We then take the highest or lowest of this calculation, and have it be our Stop Loss or Take Profit. This number cannot be higher/lower than the previous source to ensure a rapid spike doesn't immediately close your position on a still continuing trend. As well, the threshold cannot be higher/ lower than the the specified Stop Loss and Take Profit
Only after the source has fully crossed these lines do we consider it a crossup or crossdown. We confirm this with a barstate.isconfirmed to prevent repainting. Next, each time there is a crossup or crossdown we enter a long or a short respectively and plot accordingly.
I have the strategy configured to "process on order close" to ensure an accurate backtesting result. You could also set this to false and add a 1 bar delay to the "if crossup" and "if crossdown" lines under strategy so that it is calculated based on the open of the next bar.
Final Notes
The amounts have been preconfigured for performance on RIOT 5 Minute timeframe. Other timeframes are viable as well. With a few changes to the parameters, this strategy has backtested well on NVDA, AAPL, TSLA, and AMD. I recommend before altering settings to try other timeframes first.
This script does not seem to perform nearly as well in typically untrendy and choppy markets such as crypto and forex. With some setting changes, I have seen okay results with crypto, but overfitting could be the cause there.
Thank you very much, and please enjoy.

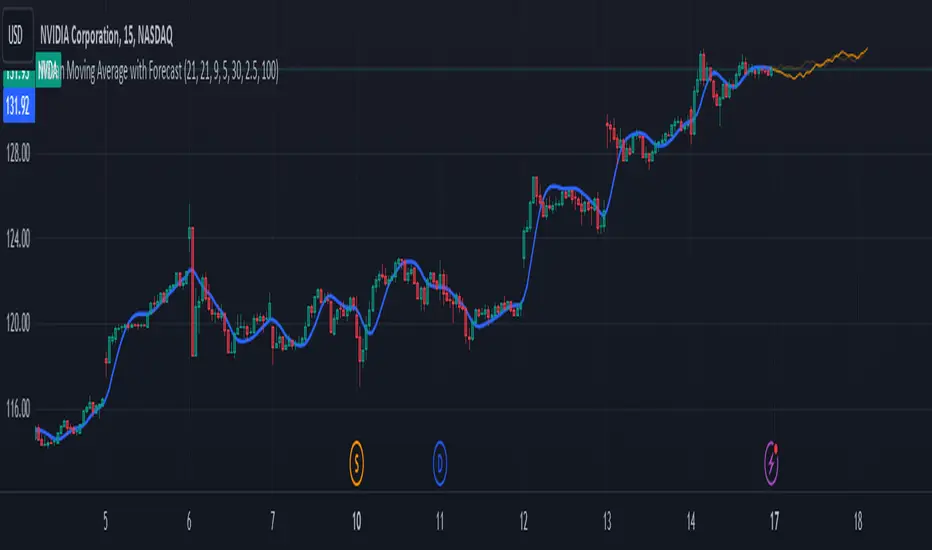
Nasan Moving Average with ForecastThe "Nasan Moving Average with Forecast" indicator is a technical analysis forecasting tool that combines the principles of historical data analysis and random walk theory. It calculates a customized moving average (Nasan Moving Average) by integrating price data and statistical measures and projects future price points by generating forecast values within calculated volatility bounds, creating a dynamic and insightful visualization of potential market movements. This indicator to blend past market behavior with probabilistic future trends to enhance forecasting.
Input Parameters:
len: Differencing length (default 21, Use a minimum of 5 and for lower time frames less than 15 min use values between 300 -3000)
len1: Correction Factor Length 1 (default 21, this determines the length of the MA you want , eg. 10 MA, 50 MA, 100 MA, )
len2: Correction Factor Length 2 (default 9, this works best if it is ~ </=1/2 of len1 )
len3: Smoothing Length (default 5, I would not change this and only use if I want to introduce lag where you want to use it for cross over strategies).
forecast_points: Number of points to forecast (default 30).
m: Multiplier for standard deviation (default 2.5).
bl: Block length for calculating max/min values (default 100).
use_calculated_max_min: Boolean to decide whether to use calculated max/min values.
Nasan Moving Average Calculation:
Calculates the simple moving average (mean) and standard deviation (sd) of the typical price (hlc3).
Computes intermediate variables (a, b, c, etc.) based on log transformation and cumulative sum.
Applies weighted moving averages (wma) to these intermediate variables to smooth them and derive the final value c6.
Plots c6 as the Nasan Moving Average if the bar is confirmed. To learn more see Nasan Moving Average.
Forecast Points Calculation:
Calculates maximum (max_val) and minimum (min_val) values for the forecast, either using a fixed value or based on standard deviation and a multiplier.
Initializes an array to store forecast values and creates polyline objects for plotting.
If the current bar is one of the last three bars and confirmed:
Clears and reinitializes the polyline.
Initializes the first forecast value from the cumulative sum c.
Generates subsequent forecast values using a random value within the range .
Updates the forecast array and plots the forecast points as an orange curved polyline.
Plotting Max/Min Values:
Plots max_val and min_val as green and red lines, respectively, to indicate the bounds of the forecast range.
Components of the Forecasting Model
Historical Dependence:
Nasan Moving Average Calculation: The script calculates a custom moving average (c6) that incorporates historical price data (hlc3), standard deviations (sd), and weighted moving averages (wma). This part of the code processes historical data to create a smoothed representation of the price trend.
Max/Min Value Calculation: The maximum (max_val) and minimum (min_val) values for the forecast can be calculated based on the historical standard deviation of a transformed variable b over a block length (bl). This introduces historical volatility into the bounds for the forecast.
Random Walk Model:
Random Value Generation: Within the forecast points calculation, a random value (random_val) is generated for each forecast point within the range . This random value introduces stochasticity into the model, characteristic of a random walk process.
Cumulative Sum for Forecasting: The script uses a cumulative sum (prev_f + random_val) to generate the next forecast point (next_f). This is a typical approach in random walk models where each new point is based on the previous point plus some random noise.
Explanation of the Forecast Model
Random Walk Characteristics: Each new forecast point is generated by adding a random value to the previous point, making the model a random walk with drift, where the drift is influenced by historical correction factors (c1, c4).
Historical and Statistical Dependence: The bounds of the random values and the initial conditions are derived from historical data, ensuring that the forecast respects historical volatility and trends.
The forecasting model in the script is a hybrid approach: It uses a random walk to generate future points, characterized by adding random values to the previous forecasted value.
The historical and statistical dependence is incorporated through initial conditions, scaling factors, and bounds derived from historical price data and its statistical properties.
This combination ensures that the forecasts are not purely stochastic but are grounded in historical price behavior, making the model more robust and potentially more accurate in reflecting market conditions.
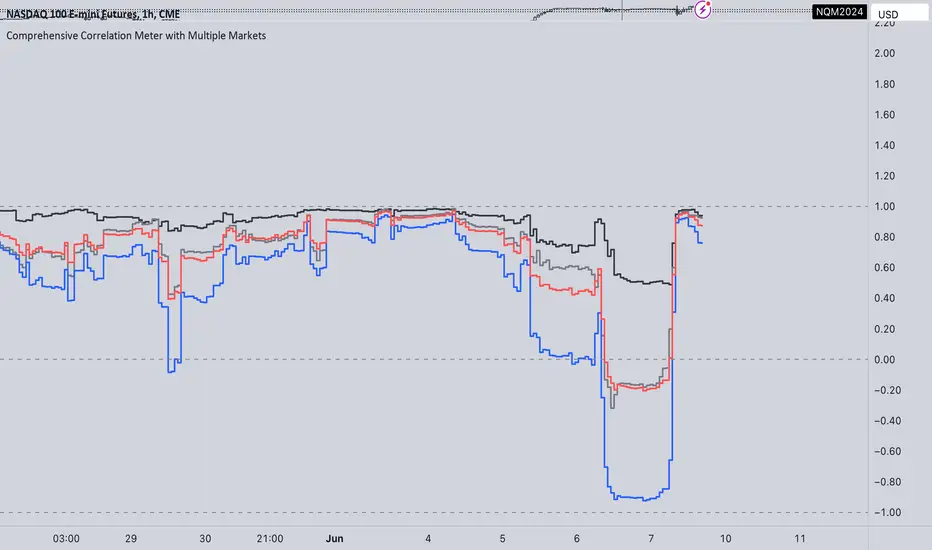
Comprehensive Correlation Meter with Multiple MarketsThe Comprehensive Correlation Meter is designed to provide traders and investors with insights into the relationships between multiple financial instruments. This script expands upon an existing idea on TradingView about correlation by introducing the ability to analyze the correlation between three markets, offering deeper insights into market relationships. It helps users understand how these markets move in relation to each other, aiding in risk management and portfolio diversification.
Key Features:
Multiple Market Analysis: This script allows you to analyze the correlation between your primary market and two other selected markets.
Customizable Inputs: Users can select any symbols for the reference and third markets, and these selections must be confirmed before use.
Correlation Coefficients: Calculates and plots the correlation coefficients for:
Current Market vs. Reference Market
Third Market vs. Reference Market
Current Market vs. Third Market
An average correlation of all three markets combined.
Visual Aids: Plots reference lines at +1, 0, and -1 to indicate maximum positive correlation, no correlation, and maximum negative correlation.
How It Works:
Input Symbols: Select the symbols for the reference and third markets. The current market is based on the chart you are viewing.
Data Collection: The script collects the closing prices of the selected markets and calculates the percentage changes.
Correlation Calculation: Using the collected data, the script computes the covariance and standard deviations to determine the correlation coefficients.
Visualization: The correlation coefficients and covariances are plotted for visual analysis.
How to Use:
Select Symbols:
Use the input fields to specify the reference and third market symbols. Confirm your selections to proceed.
Customize Display:
Choose whether to display the covariance, reference market, current market, and third market.
Select which correlation coefficients to display.
Interpret Results:
A correlation coefficient close to +1 indicates a strong positive correlation.
A coefficient close to -1 indicates a strong negative correlation.
A coefficient around 0 indicates little to no correlation.
Use these insights to manage risk and diversify your portfolio effectively.
Example Use Case:
Suppose you are trading the S&P 500 and want to understand its correlation with the NASDAQ 100 and a particular stock, such as Apple. By setting the S&P 500 as the reference market, the NASDAQ 100 as the third market, and observing the current market (Apple), you can see how these instruments move in relation to each other. This can help you decide on hedging strategies or identify opportunities for diversification. However this is Not a Financial advise
Random Entry and ExitStrategy for Researching Whether It Is Possible to Earn Consistently by Opening Random Trades
The essence of the strategy lies in generating random entries and exits based on pseudorandom numbers. The generation of pseudorandom numbers is performed by the function random_number based on the value of the seed variable. The variables entry_threshold and exit_threshold control the frequency of entries and exits. Lower values mean less frequent trades. To increase the number of trades, increase the values of these variables.
The strategy was created as part of research into whether it is possible to earn randomly in financial markets by making chaotic actions of opening and closing trades. However, it adheres to a few rules: open only long positions (in the direction of the global trend) and do not use leverage. Positions are opened with the entire available capital.
100 generations of the strategy on the daily chart of the S&P 500 (seed 1-101) give 100% positive mathematical expectations. Similar results are observed on higher timeframes of assets that are in a global uptrend.
There is also the possibility of opening only short positions for the research. Note that the logic of the strategy is built in such a way that only one trading direction can operate simultaneously (either longs or shorts). On higher timeframes, random shorts show negative results. Positive mathematical expectations for short positions can be found on lower timeframes (1 min, etc.), where a large amount of noise is observed.
---------------------------------------------------------------------------------------------------
Стратегия для исследования, можно ли стабильно зарабатывать при открытии случайных сделок
Суть стратегии заключается в генерации случайных входов и выходов на основе псевдослучайных чисел. Генерация псевдослучайных чисел происходит функцией random_number на основе значения переменной seed. Переменные entry_threshold и exit_threshold контролируют частоту входов и выходов. Более низкие значения означают менее частые сделки. Для увеличения количества сделок - увеличивайте значения переменных.
Стратегия создавалась в рамках исследования вопроса, можно ли случайным образом зарабатывать на фин. рынках, совершая хаотичные открытия и закрытия сделок. НО, придерживаясь нескольких правил: открывать только длинные позиции (в сторону глобального тренда) и не использовать кредитные плечи. Открытие позиций происходит на весь доступный капитал.
100 генераций стратегии на дневном графике S&P500 (seed 1-101) дают 100% положительных математических ожиданий. Похожие результаты наблюдаются на высоких таймфреймах активов, которые глобально находятся в восходящем тренде.
Также для исследования предусмотрена возможность открытия только коротких позиций. Обратите внимание, что логика стратегии построена таким образом, что одновременно может работать только одно направление торговли (либо лонги, либо шорты). На старших таймфреймах случайные шорты показывают негативные результаты. Положительное математическое ожидание для коротких позиций можно обнаружить на младших таймфреймах (1 min, etc), где наблюдается большое количество шумов.

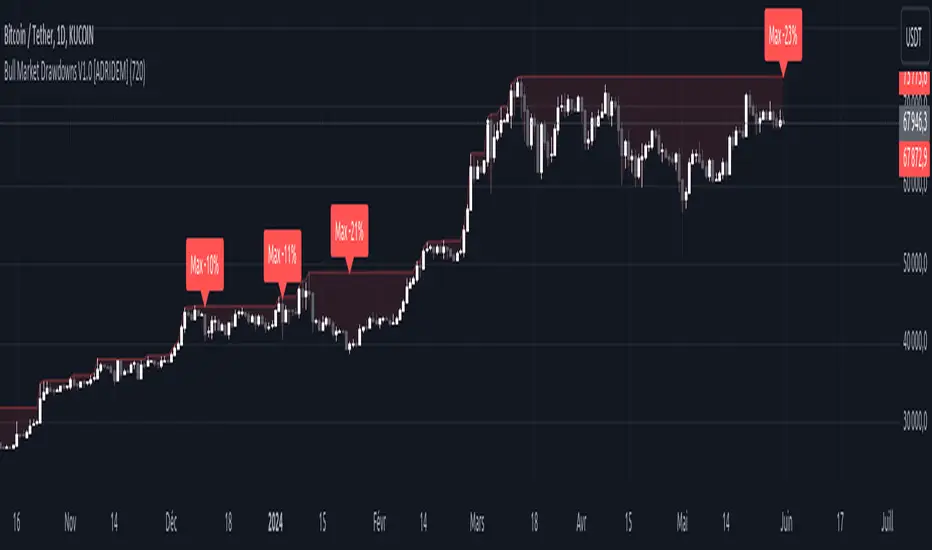
Bull Market Drawdowns V1.0 [ADRIDEM]Bull Market Drawdowns V1.0
Overview
The Bull Market Drawdowns V1.0 script is designed to help visualize and analyze drawdowns during a bull market. This script calculates the highest high price from a specified start date, identifies drawdown periods, and plots the drawdown areas on the chart. It also highlights the maximum drawdowns and marks the start of the bull market, providing a clear visual representation of market performance and potential risk periods.
Unique Features of the New Script
Default Timeframe Configuration: Allows users to set a default timeframe for analysis, providing flexibility in adapting the script to different trading strategies and market conditions.
Customizable Bull Market Start Date: Users can define the start date of the bull market, ensuring the script calculates drawdowns from a specific point in time that aligns with their analysis.
Drawdown Calculation and Visualization: Calculates drawdowns from the highest high since the bull market start date and plots the drawdown areas on the chart with distinct color fills for easy identification.
Maximum Drawdown Tracking and Labeling: Tracks the maximum drawdown for each period and places labels on the chart to indicate significant drawdowns, helping traders identify and assess periods of higher risk.
Bull Market Start Marker: Marks the start of the bull market on the chart with a label, providing a clear reference point for the beginning of the analysis period.
Originality and Usefulness
This script provides a unique and valuable tool by combining drawdown analysis with visual markers and customizable settings. By calculating and plotting drawdowns from a user-defined start date, traders can better understand the performance and risks associated with a bull market. The script’s ability to track and label maximum drawdowns adds further depth to the analysis, making it easier to identify critical periods of market retracement.
Signal Description
The script includes several key visual elements that enhance its usefulness for traders:
Drawdown Area : Plots the upper and lower boundaries of the drawdown area, filling the space between with a semi-transparent color. This helps traders easily identify periods of market retracement.
Maximum Drawdown Labels : Labels are placed on the chart to indicate the maximum drawdown for each period, providing clear markers for significant drawdowns.
Bull Market Start Marker : A label is placed at the start of the bull market, marking the beginning of the analysis period and helping traders contextualize the drawdown data.
These visual elements help quickly assess the extent and impact of drawdowns within a bull market, aiding in risk management and decision-making.
Detailed Description
Input Variables
Default Timeframe (`default_timeframe`) : Defines the timeframe for the analysis. Default is 720 minutes
Bull Market Start Date (`start_date_input`) : The starting date for the bull market analysis. Default is January 1, 2023
Functionality
Highest High Calculation : The script calculates the highest high price on the specified timeframe from the user-defined start date.
```pine
var float highest_high = na
if (time >= start_date)
highest_high := na(highest_high ) ? high : math.max(highest_high , high)
```
Drawdown Calculation : Determines the drawdown starting point and calculates the drawdown percentage from the highest high.
```pine
var float drawdown_start = na
if (time >= start_date)
drawdown_start := na(drawdown_start ) or high >= highest_high ? high : drawdown_start
drawdown = (drawdown_start - low) / drawdown_start * 100
```
Maximum Drawdown Tracking : Tracks the maximum drawdown for each period and places labels above the highest high when a new high is reached.
```pine
var float max_drawdown = na
var int max_drawdown_bar_index = na
if (time >= start_date)
if na(max_drawdown ) or high >= highest_high
if not na(max_drawdown ) and not na(max_drawdown_bar_index) and max_drawdown > 10
label.new(x=max_drawdown_bar_index, y=drawdown_start , text="Max -" + str.tostring(max_drawdown , "#") + "%",
color=color.red, style=label.style_label_down, textcolor=color.white, size=size.normal)
max_drawdown := 0
max_drawdown_bar_index := na
else
if na(max_drawdown ) or drawdown > max_drawdown
max_drawdown := drawdown
max_drawdown_bar_index := bar_index
```
Drawdown Area Plotting : Plots the drawdown area with upper and lower boundaries and fills the area with a semi-transparent color.
```pine
drawdown_area_upper = time >= start_date ? drawdown_start : na
drawdown_area_lower = time >= start_date ? low : na
p1 = plot(drawdown_area_upper, title="Drawdown Area Upper", color=color.rgb(255, 82, 82, 60), linewidth=1)
p2 = plot(drawdown_area_lower, title="Drawdown Area Lower", color=color.rgb(255, 82, 82, 100), linewidth=1)
fill(p1, p2, color=color.new(color.red, 90), title="Drawdown Fill")
```
Current Maximum Drawdown Label : Places a label on the chart to indicate the current maximum drawdown if it exceeds 10%.
```pine
var label current_max_drawdown_label = na
if (not na(max_drawdown) and max_drawdown > 10)
current_max_drawdown_label := label.new(x=bar_index, y=drawdown_start, text="Max -" + str.tostring(max_drawdown, "#") + "%",
color=color.red, style=label.style_label_down, textcolor=color.white, size=size.normal)
if (not na(current_max_drawdown_label))
label.delete(current_max_drawdown_label )
```
Bull Market Start Marker : Places a label at the start of the bull market to mark the beginning of the analysis period.
```pine
var label bull_market_start_label = na
if (time >= start_date and na(bull_market_start_label))
bull_market_start_label := label.new(x=bar_index, y=high, text="Bull Market Start", color=color.blue, style=label.style_label_up, textcolor=color.white, size=size.normal)
```
How to Use
Configuring Inputs : Adjust the default timeframe and start date for the bull market as needed. This allows the script to be tailored to different market conditions and trading strategies.
Interpreting the Indicator : Use the drawdown areas and labels to identify periods of significant market retracement. Pay attention to the maximum drawdown labels to assess the risk during these periods.
Signal Confirmation : Use the bull market start marker to contextualize drawdown data within the overall market trend. The combination of drawdown visualization and maximum drawdown labels helps in making informed trading decisions.
This script provides a detailed view of drawdowns during a bull market, helping traders make more informed decisions by understanding the extent and impact of market retracements. By combining customizable settings with visual markers and drawdown analysis, traders can better align their strategies with the underlying market conditions, thus improving their risk management and decision-making processes.
Multi-Timeframe MA Levels█ OVERVIEW
This Pine Script is an indicator for displaying multiple moving average (MA) levels from several timeframes on your TradingView charts. At the Realtime Bar (the right-most bar on your chart), it draws a line where the various moving averages currently are.
For example, it will show you where the 8 EMA on the 5 minute timeframe is on your 1-minute timeframe chart.
It derives its look and function from "Lepelle's Key Levels" and focuses on visualizing various moving averages to complement this indicator.
█ FEATURES
1 — Multi-Timeframe Analysis:
• The script allows traders to view moving averages from different timeframes on a single chart.
This multi-timeframe approach helps identify significant levels and trends that might not be apparent when looking at a single timeframe.
2 — Customization and Flexibility:
• Extensive input options for customizing the appearance of the lines (width, style, color) and labels (size, position, distance from price).
This ensures that the indicator can be tailored to individual preferences and charting styles.
3 — Multiple Moving Averages:
• Support for various types of moving averages (8 EMA, 21 EMA, 50 SMA, 100 SMA, 200 SMA).
Each moving average can be individually enabled or disabled for specific timeframes,
providing a flexible tool for technical analysis.
█ SETTINGS
Inputs for Styling:
• Controls the appearance of the lines and labels.
• Includes options for line width, line style, text size, distance from the candlesticks, label position,
and whether to hide prices or use shorthand notation.
Moving Averages Settings:
• Inputs to select different moving averages (8 EMA, 21 EMA, 50 SMA, 100 SMA, 200 SMA) and their corresponding colors.
• Boolean inputs to enable or disable these moving averages on various timeframes (2 min, 5 min, hourly, daily).
█ SUMMARY
In essence, this script provides a comprehensive tool for technical analysis by combining multi-timeframe moving averages into a single, customizable, and user-friendly indicator. It enhances traders' ability to make informed decisions by providing clear visual representations of key moving average levels across different timeframes.
═════════════════════════════════════════════════════════════
█ LIMITATIONS
This script is best used with a short timeframe such as 1-minute or lower because of the limitations of Multi-Timeframe scripts. Basically, the alternate timeframes in use should always be higher than the chart timeframe.
═════════════════════════════════════════════════════════════
█ NOTES
This indicator is intended to complement and be used with "Lepelle's Key Levels" indicator.
In that indictor settings, I recommend turning off the 5 Daily timeframe moving average levels in that script, if using this one.
═════════════════════════════════════════════════════════════

Reversal Candlestick Structure [LuxAlgo]The Reversal Candlestick Structure indicator detects multiple candlestick patterns occurring when trends are most likely to experience a reversal in real-time. The reversal detection method includes various settings allowing users to adjust the reversal detection algorithm more precisely.
A dashboard showing the percentage of patterns detected as reversals is also included.
🔶 USAGE
Candlestick patterns are ubiquitous to technical analysts, allowing them to detect trend continuations, reversals, and indecision.
The proposed tool effectively detects reversals by using the confluence between candlestick patterns and a reversal detection method based on the stochastic oscillator, acting as a filter for the patterns. If a candlestick pattern occurs while conditions suggest a potential reversal then the pattern is highlighted.
The displayed candle coloring allows users to observe the reversal detection method, with colored candles indicating potential reversals.
Users wanting to detect longer-term reversals can use a higher "Trend Length" setting, this can however lead to an increased amount of displayed candlestick patterns.
To prevent false positives users also have control over a "Threshold" setting in a range between (0, 100), with values closer to 100 preventing candlesticks from being detected at the start of trends.
The "Warmup Length" serves a similar purpose, and aims to prevent sudden moves to be classified as reversals. Higher values of this setting will require trends to be established for a longer period of time for reversal conditions to be detected.
🔹 Dashboard
To evaluate the role of individual candlestick patterns as potential reversal signals relative to the proposed reversal detection method, a dashboard displaying the percentage of candlestick patterns displayed (that occur when a potential reversal is detected) over the total amount detected.
Hovering on the dashboard cells of the "Reversal %" column allows displaying the total amount of patterns detected.
🔶 CANDLESTICKS PATTERNS
This tool detects 16 popular candlestick patterns, each listed in the sub-sections below.
🔹 Bullish Patterns
Hammer - A bullish reversal pattern that forms after a decline, characterized by a small body at the upper end of the trading range and a long lower shadow.
Inverted Hammer - A bullish reversal pattern that forms after a downtrend, featuring a small body at the lower end of the trading range and a long upper shadow.
Bullish Engulfing - A bullish reversal pattern where a small bearish candlestick is followed by a larger bullish candlestick that completely engulfs the previous candle.
Rising 3 - A bullish continuation pattern that consists of a long bullish candlestick followed by three smaller bearish candlesticks and then another long bullish candlestick.
3 White Soldiers - A bullish reversal pattern consisting of three consecutive long bullish candlesticks, each opening within the previous candle's body and closing higher.
Morning Star - A bullish reversal pattern made up of three candlesticks: a long bearish candlestick, followed by a short candlestick, and then a long bullish candlestick.
Bullish Harami - A bullish reversal pattern where a small bullish candlestick is completely within a previous larger bearish candlestick.
Tweezer Bottom - A bullish reversal pattern identified by an initial bullish candle, followed by a bearish candle, both having equal lows.
🔹 Bearish Patterns
Hanging Man - A bearish reversal pattern that forms after an uptrend, characterized by a small body at the upper end of the trading range and a long lower shadow.
Shooting Star - A bearish reversal pattern that forms after an uptrend, featuring a small body at the lower end of the trading range and a long upper shadow.
Bearish Engulfing - A bearish reversal pattern where a small bullish candlestick is followed by a larger bearish candlestick that completely engulfs the previous candle.
Falling 3 - A bearish continuation pattern that consists of a long bearish candlestick followed by three smaller bullish candlesticks and then another long bearish candlestick.
3 Black Crows - A bearish reversal pattern consisting of three consecutive long bearish candlesticks, each opening within the previous candle's body and closing lower.
Evening Star - A bearish reversal pattern made up of three candlesticks: a long bullish candlestick, followed by a short candlestick, and then a long bearish candlestick.
Bearish Harami - A bearish reversal pattern where a small bearish candlestick is completely within a previous larger bullish candlestick.
Tweezer Top - A bearish reversal pattern is identified by an initial bullish candle, followed by a bearish candle, both having equal highs."
🔶 SETTINGS
🔹 Patterns
Group including toggles for each of the supported candlestick patterns. Enabled toggles will allow detection of the associated candlestick pattern.
🔹 Reversal Detection
Trend Length: Determines the sensitivity of the reversal detection method to shorter-term variation, with higher values returning a detection method more sensitive to longer-term trends.
Threshold: Determines how easy it is for the reversal detection method to consider a trend at an extreme point.
Warmup Length: Warmup period in the reversal detection method, longer values will require a longer-term trend to detect potential reversals.
🔹 Style
Color Candles: Enable candle coloring on the user chart based on the reversal detection method.
Use Gradient: Use a gradient as candle coloring.
Label Size: Size of the labels displaying the detected candlesticks patterns.
🔹 Dashboard
Show Dashboard: Display the dashboard on the user chart when enabled.
Location: Dashboard location on the user chart.
Size: Size of the displayed dashboard.

Dynamic Gann Levels [XrayTrades]This indicator dynamically captures the highest and lowest points visible on the chart and calculates Gann Support and Resistance Levels. The inputs are detailed below.
Why create this indicator?
There is no other indicator with the same functionality on TradingView.
These calculations are time-consuming; the speed at which this indicator calculates any number of rotations and degrees and visually displays them on the chart is invaluable to me, and hopefully others who use/perform these calculations.
Works on any time frame:
Year, month, week, day, etc. Smaller timeframes (intraday) for higher prices may require adjusting the y-axis of the chart after the calculation of levels due to the nature of squaring numbers.
Inputs:
Resistance: Up (from pivot low) - This toggles on/off levels calculated from the lowest point visible on the chart’s current view.
Support: Down (from pivot high) - This toggles on/off levels calculated from the highest point visible on the chart’s current view.
360 - Toggles on/off the levels of full rotations (360 degrees) from price
180 - Toggles on/off the levels of half rotations (180 degrees) from price
90 - Toggles on/off the levels of quarter rotations (90 degrees) from price
45 - Toggles on/off the levels of eighth rotations (45 degrees) from price
Full Rotations Visible - The number of rotations to be displayed on the chart
How to use this indicator:
Adjust chart window to change the highs and lows.
Select the degrees, direction, and number of rotations in the indicator settings.
The colored values beside the indicator represent the values (high and low) used in generating the Gann levels. Should the cursor be on the chart, ensure it is to the right of the high and low pivots, as this is dynamic in TradingView depending upon cursor location. Note: This is only for the user to know which value(s) are used; cursor position does not impact actual calculations and levels displayed.
The levels will be drawn to the right of the most recent price, labeled with the degrees and direction as well as the price value at the level.
About the calculations:
These calculations are derived from the Natural Square Calculator of Gann Theory, also known as the Square of Nines.
Details:
Take the square root of the selected value (lowest and or highest point).
Add (for up or subtract for down) 0.25 for every 45 degrees of rotation to the desired calculation.
Square this. Round to two decimal places.
Ex: Low of 100. Calculate Gann resistance level for 360 degrees. (√(100)+2)² = 144.
Ex: High of 100. Calculate Gann support level for 180 degrees. (√(100)-1)² = 81.

Dual RSI Differential - Strategy [presentTrading]█ Introduction and How it is Different
The Dual RSI Differential Strategy introduces a nuanced approach to market analysis and trading decisions by utilizing two Relative Strength Index (RSI) indicators calculated over different time periods. Unlike traditional strategies that employ a single RSI and may signal premature or delayed entries, this method leverages the differential between a shorter and a longer RSI. This approach pinpoints more precise entry and exit points, providing a refined tool for traders to exploit market conditions effectively, particularly in overbought and oversold scenarios.
Most important: it is a good eductional code for swing trading.
For beginners, this Pine Script provides a complete function that includes crucial elements such as holding days and the option to configure take profit/stop loss settings:
- Hold Days: This feature ensures that trades are not exited too hastily, helping traders to ride out short-term market volatility. It's particularly valuable for swing trading where maintaining positions slightly longer can lead to capturing significant trends.
- TPSL Condition (None by default): This setting allows traders to focus solely on the strategy's robust entry and exit signals without being constrained by preset profit or loss limits. This flexibility is crucial for learning to adjust strategy settings based on personal risk tolerance and market observations.
BTCUSD 6h LS Performance
█ Strategy, How It Works: Detailed Explanation
🔶 RSI Calculation:
The RSI is a momentum oscillator that measures the speed and change of price movements. It is calculated using the formula:
RSI = 100 - (100 / (1 + RS))
Where RS (Relative Strength) = Average Gain of up periods / Average Loss of down periods.
🔶 Dual RSI Setup:
This strategy involves two RSI indicators:
RSI_Short (RSI_21): Calculated over a short period (21 days).
RSI_Long (RSI_42): Calculated over a longer period (42 days).
Differential Calculation:
The strategy focuses on the differential between these two RSIs:
RSI Differential = RSI_Long - RSI_Short
This differential helps to identify when the shorter-term sentiment diverges from longer-term trends, signaling potential trading opportunities.
BTCUSD Local picuture
🔶 Signal Triggers:
Entry Signal: A buy (long) signal is triggered when the RSI Differential exceeds -5, suggesting strengthening short-term momentum. Conversely, a sell (short) signal occurs when the RSI Differential falls below +5, indicating weakening short-term momentum.
Exit Signal: Trades are generally exited when the RSI Differential reverses past these thresholds, indicating a potential momentum shift.
█ Trade Direction
This strategy accommodates various trading preferences by allowing selections among long, short, or both directions, thus enabling traders to capitalize on diverse market movements and volatility.
█ Usage
The Dual RSI Differential Strategy is particularly suited for:
Traders who prefer a systematic approach to capture market trends.
Those who seek to minimize risks associated with rapid and unexpected market movements.
Traders who value strategies that can be finely tuned to different market conditions.
█ Default Settings
- Trading Direction: Both — allows capturing of upward and downward market movements.
- Short RSI Period: 21 days — balances sensitivity to market movements.
- Long RSI Period: 42 days — smoothens out longer-term fluctuations to provide a clearer market trend.
- RSI Difference Level: 5 — minimizes false signals by setting a moderate threshold for action.
Use Hold Days: True — introduces a temporal element to trading strategy, holding positions to potentially enhance outcomes.
- Hold Days: 5 — ensures that trades are not exited too hastily, helping to ride out short-term volatility.
- TPSL Condition: None — enables traders to focus solely on the strategy's entry and exit signals without preset profit or loss limits.
- Take Profit Percentage: 15% — aims for significant market moves to lock in profits.
- Stop Loss Percentage: 10% — safeguards against large losses, essential for long-term capital preservation.

Range Average Retest Model [LuxAlgo]The Range Average Retest Model tool highlights setups from the range average retest entry model, a model using the retest of the average between two opposite swing points as an entry.
This tool uses long-term volatility coupled with user-defined multipliers to filter out swing areas and set take profit and stop loss levels for all trades.
Key features include:
Draw up to 165 swing areas and their associated trades
Filter out swing areas using Pivot Length , Selection Mode and Threshold parameters
Filter out trades with Maximum Distance and Minimum Distance parameters
Enable or disable swing areas and select default colors
Enable or disable overlapping trades and change the default colors for Take Profit and Stop Loss zones
🔶 USAGE
The "Range Average Retest Model" is an entry model that enters a position when the price retests the average made between two swing points. Users can determine the period of the detected swing points from the "Pivot Length" setting.
The conditions for long or short trades, regardless of whether the swing area is bullish or bearish, are as follows:
Long positions: the current bar close is below the swing area average and the last bar close was above it.
Short positions: the current bar close is above the swing area average price and the last bar close was below it.
Each trade is displayed on the chart with a line connecting it to its swing area highlighting the range average, a green area for the take profit, and a red area for the stop loss.
Both the Take Profit and Stop Loss levels are calculated by applying your own multiplier in the settings panel to the long-term volatility measure, in this case, the average true range over the last 200 bars.
Trades will remain open until they reach either the Stop Loss or Take Profit price levels.
🔹 Filtering Swing Areas
The daily chart of the Nasdaq-100 futures (NQ) with pivot length 2 and bullish selection mode: it only detects bullish swing areas, but they are smaller and more numerous.
Traders can manipulate the behavior of the swing areas from the settings panel.
The Selection mode will filter areas by bias: it will detect bullish areas, bearish areas, or both.
The Threshold parameter is applied to the long-term volatility to filter out areas where the average prices are too close together; the higher the value, the greater the difference between the average prices must be.
🔹 Trades
3-minute chart of the Nasdaq-100 futures (NQ) with pivot length 5, bearish selection mode maximum distance 4, and stop loss 2: many trades detected with very asymmetric risk/reward.
The behavior of the trades is also manipulated from the settings panel.
The maximum and minimum distance parameters specify the number of bars a trade must be away from a swing area.
The Take Profit and Stop Loss parameters are applied to the long-term volatility to obtain their respective price levels.
🔹 Overlapping Trades
Same chart as before, but with overlapping trades: messy, right?
By default the tool does not show overlapping trades, this allows for a cleaner chart.
In the settings panel traders can enable overlapping mode, in which case the tool will show all available trades.
Traders must be aware that the chart can be very crowded.
🔶 SETTINGS
🔹 Swings
Pivot Length: How many bars are used to confirm a swing point. The larger this parameter is, the larger and fewer swing areas will be detected.
Selection Mode: Swing area detection mode, detect only bullish swings, only bearish swings, or both.
Threshold: Swing area comparator. This threshold is multiplied by a measure of volatility (average true range over the last 200 bars), for a new swing area to be detected it must have an average level that is sufficiently distant from the average level of any untouched swing area, this parameter controls that distance.
🔹 Trades
Maximum distance: Maximum distance allowed between a swing area and a trade.
Minimum distance: Minimum distance allowed between a swing area and a trade.
Take profit: The size of the take profit - this threshold is multiplied by a measure of volatility (the average true range over the last 200 bars).
Stop loss: The size of the stop-loss: this threshold is multiplied by a measure of volatility (the average true range over the last 200 bars).

TRADINGLibrary "TRADING"
This library is a client script for making a webhook signal formatted string to PoABOT server.
entry_message(password, percent, leverage, margin_mode, kis_number)
Create a entry message for POABOT
Parameters:
password (string) : (string) The password of your bot.
percent (float) : (float) The percent for entry based on your wallet balance.
leverage (int) : (int) The leverage of entry. If not set, your levereage doesn't change.
margin_mode (string) : (string) The margin mode for trade(only for OKX). "cross" or "isolated"
kis_number (int) : (int) The number of koreainvestment account. Default 1
Returns: (string) A json formatted string for webhook message.
order_message(password, percent, leverage, margin_mode, kis_number)
Create a order message for POABOT
Parameters:
password (string) : (string) The password of your bot.
percent (float) : (float) The percent for entry based on your wallet balance.
leverage (int) : (int) The leverage of entry. If not set, your levereage doesn't change.
margin_mode (string) : (string) The margin mode for trade(only for OKX). "cross" or "isolated"
kis_number (int) : (int) The number of koreainvestment account. Default 1
Returns: (string) A json formatted string for webhook message.
close_message(password, percent, margin_mode, kis_number)
Create a close message for POABOT
Parameters:
password (string) : (string) The password of your bot.
percent (float) : (float) The percent for close based on your wallet balance.
margin_mode (string) : (string) The margin mode for trade(only for OKX). "cross" or "isolated"
kis_number (int) : (int) The number of koreainvestment account. Default 1
Returns: (string) A json formatted string for webhook message.
exit_message(password, percent, margin_mode, kis_number)
Create a exit message for POABOT
Parameters:
password (string) : (string) The password of your bot.
percent (float) : (float) The percent for exit based on your wallet balance.
margin_mode (string) : (string) The margin mode for trade(only for OKX). "cross" or "isolated"
kis_number (int) : (int) The number of koreainvestment account. Default 1
Returns: (string) A json formatted string for webhook message.
manual_message(password, exchange, base, quote, side, qty, price, percent, leverage, margin_mode, kis_number, order_name)
Create a manual message for POABOT
Parameters:
password (string) : (string) The password of your bot.
exchange (string) : (string) The exchange
base (string) : (string) The base
quote (string) : (string) The quote of order message
side (string) : (string) The side of order messsage
qty (float) : (float) The qty of order message
price (float) : (float) The price of order message
percent (float) : (float) The percent for order based on your wallet balance.
leverage (int) : (int) The leverage of entry. If not set, your levereage doesn't change.
margin_mode (string) : (string) The margin mode for trade(only for OKX). "cross" or "isolated"
kis_number (int) : (int) The number of koreainvestment account.
order_name (string) : (string) The name of order message
Returns: (string) A json formatted string for webhook message.
in_trade(start_time, end_time, hide_trade_line)
Create a trade start line
Parameters:
start_time (int) : (int) The start of time.
end_time (int) : (int) The end of time.
hide_trade_line (bool) : (bool) if true, hide trade line. Default false.
Returns: (bool) Get bool for trade based on time range.
real_qty(qty, precision, leverage, contract_size, default_qty_type, default_qty_value)
Get exchange specific real qty
Parameters:
qty (float) : (float) qty
precision (float) : (float) precision
leverage (int) : (int) leverage
contract_size (float) : (float) contract_size
default_qty_type (string)
default_qty_value (float)
Returns: (float) exchange specific qty.
method set(this, password, start_time, end_time, leverage, initial_capital, default_qty_type, default_qty_value, margin_mode, contract_size, kis_number, entry_percent, close_percent, exit_percent, fixed_qty, fixed_cash, real, auto_alert_message, hide_trade_line)
Set bot object.
Namespace types: bot
Parameters:
this (bot)
password (string) : (string) password for poabot.
start_time (int) : (int) start_time timestamp.
end_time (int) : (int) end_time timestamp.
leverage (int) : (int) leverage.
initial_capital (float)
default_qty_type (string)
default_qty_value (float)
margin_mode (string) : (string) The margin mode for trade(only for OKX). "cross" or "isolated"
contract_size (float)
kis_number (int) : (int) kis_number for poabot.
entry_percent (float) : (float) entry_percent for poabot.
close_percent (float) : (float) close_percent for poabot.
exit_percent (float) : (float) exit_percent for poabot.
fixed_qty (float) : (float) fixed qty.
fixed_cash (float) : (float) fixed cash.
real (bool) : (bool) convert qty for exchange specific.
auto_alert_message (bool) : (bool) convert alert_message for exchange specific.
hide_trade_line (bool) : (bool) if true, Hide trade line. Default false.
Returns: (void)
method print(this, message)
Print message using log table.
Namespace types: bot
Parameters:
this (bot)
message (string)
Returns: (void)
method start_trade(this)
start trade using start_time and end_time
Namespace types: bot
Parameters:
this (bot)
Returns: (void)
method entry(this, id, direction, qty, limit, stop, oca_name, oca_type, comment, alert_message, when)
It is a command to enter market position. If an order with the same ID is already pending, it is possible to modify the order. If there is no order with the specified ID, a new order is placed. To deactivate an entry order, the command strategy.cancel or strategy.cancel_all should be used. In comparison to the function strategy.order, the function strategy.entry is affected by pyramiding and it can reverse market position correctly. If both 'limit' and 'stop' parameters are 'NaN', the order type is market order.
Namespace types: bot
Parameters:
this (bot)
id (string) : (string) A required parameter. The order identifier. It is possible to cancel or modify an order by referencing its identifier.
direction (string) : (string) A required parameter. Market position direction: 'strategy.long' is for long, 'strategy.short' is for short.
qty (float) : (float) An optional parameter. Number of contracts/shares/lots/units to trade. The default value is 'NaN'.
limit (float) : (float) An optional parameter. Limit price of the order. If it is specified, the order type is either 'limit', or 'stop-limit'. 'NaN' should be specified for any other order type.
stop (float) : (float) An optional parameter. Stop price of the order. If it is specified, the order type is either 'stop', or 'stop-limit'. 'NaN' should be specified for any other order type.
oca_name (string) : (string) An optional parameter. Name of the OCA group the order belongs to. If the order should not belong to any particular OCA group, there should be an empty string.
oca_type (string) : (string) An optional parameter. Type of the OCA group. The allowed values are: "strategy.oca.none" - the order should not belong to any particular OCA group; "strategy.oca.cancel" - the order should belong to an OCA group, where as soon as an order is filled, all other orders of the same group are cancelled; "strategy.oca.reduce" - the order should belong to an OCA group, where if X number of contracts of an order is filled, number of contracts for each other order of the same OCA group is decreased by X.
comment (string) : (string) An optional parameter. Additional notes on the order.
alert_message (string) : (string) An optional parameter which replaces the {{strategy.order.alert_message}} placeholder when it is used in the "Create Alert" dialog box's "Message" field.
when (bool) : (bool) An optional parmeter. Condition, deprecated.
Returns: (void)
method order(this, id, direction, qty, limit, stop, oca_name, oca_type, comment, alert_message, when)
It is a command to place order. If an order with the same ID is already pending, it is possible to modify the order. If there is no order with the specified ID, a new order is placed. To deactivate order, the command strategy.cancel or strategy.cancel_all should be used. In comparison to the function strategy.entry, the function strategy.order is not affected by pyramiding. If both 'limit' and 'stop' parameters are 'NaN', the order type is market order.
Namespace types: bot
Parameters:
this (bot)
id (string) : (string) A required parameter. The order identifier. It is possible to cancel or modify an order by referencing its identifier.
direction (string) : (string) A required parameter. Market position direction: 'strategy.long' is for long, 'strategy.short' is for short.
qty (float) : (float) An optional parameter. Number of contracts/shares/lots/units to trade. The default value is 'NaN'.
limit (float) : (float) An optional parameter. Limit price of the order. If it is specified, the order type is either 'limit', or 'stop-limit'. 'NaN' should be specified for any other order type.
stop (float) : (float) An optional parameter. Stop price of the order. If it is specified, the order type is either 'stop', or 'stop-limit'. 'NaN' should be specified for any other order type.
oca_name (string) : (string) An optional parameter. Name of the OCA group the order belongs to. If the order should not belong to any particular OCA group, there should be an empty string.
oca_type (string) : (string) An optional parameter. Type of the OCA group. The allowed values are: "strategy.oca.none" - the order should not belong to any particular OCA group; "strategy.oca.cancel" - the order should belong to an OCA group, where as soon as an order is filled, all other orders of the same group are cancelled; "strategy.oca.reduce" - the order should belong to an OCA group, where if X number of contracts of an order is filled, number of contracts for each other order of the same OCA group is decreased by X.
comment (string) : (string) An optional parameter. Additional notes on the order.
alert_message (string) : (string) An optional parameter which replaces the {{strategy.order.alert_message}} placeholder when it is used in the "Create Alert" dialog box's "Message" field.
when (bool) : (bool) An optional parmeter. Condition, deprecated.
Returns: (void)
method close_all(this, comment, alert_message, immediately, when)
Exits the current market position, making it flat.
Namespace types: bot
Parameters:
this (bot)
comment (string) : (string) An optional parameter. Additional notes on the order.
alert_message (string) : (string) An optional parameter which replaces the {{strategy.order.alert_message}} placeholder when it is used in the "Create Alert" dialog box's "Message" field.
immediately (bool) : (bool) An optional parameter. If true, the closing order will be executed on the tick where it has been placed, ignoring the strategy parameters that restrict the order execution to the open of the next bar. The default is false.
when (bool) : (bool) An optional parmeter. Condition, deprecated.
Returns: (void)
method cancel(this, id, when)
It is a command to cancel/deactivate pending orders by referencing their names, which were generated by the functions: strategy.order, strategy.entry and strategy.exit.
Namespace types: bot
Parameters:
this (bot)
id (string) : (string) A required parameter. The order identifier. It is possible to cancel an order by referencing its identifier.
when (bool) : (bool) An optional parmeter. Condition, deprecated.
Returns: (void)
method cancel_all(this, when)
It is a command to cancel/deactivate all pending orders, which were generated by the functions: strategy.order, strategy.entry and strategy.exit.
Namespace types: bot
Parameters:
this (bot)
when (bool) : (bool) An optional parmeter. Condition, deprecated.
Returns: (void)
method close(this, id, comment, qty, qty_percent, alert_message, immediately, when)
It is a command to exit from the entry with the specified ID. If there were multiple entry orders with the same ID, all of them are exited at once. If there are no open entries with the specified ID by the moment the command is triggered, the command will not come into effect. The command uses market order. Every entry is closed by a separate market order.
Namespace types: bot
Parameters:
this (bot)
id (string) : (string) A required parameter. The order identifier. It is possible to close an order by referencing its identifier.
comment (string) : (string) An optional parameter. Additional notes on the order.
qty (float) : (float) An optional parameter. Number of contracts/shares/lots/units to exit a trade with. The default value is 'NaN'.
qty_percent (float) : (float) Defines the percentage (0-100) of the position to close. Its priority is lower than that of the 'qty' parameter. Optional. The default is 100.
alert_message (string) : (string) An optional parameter which replaces the {{strategy.order.alert_message}} placeholder when it is used in the "Create Alert" dialog box's "Message" field.
immediately (bool) : (bool) An optional parameter. If true, the closing order will be executed on the tick where it has been placed, ignoring the strategy parameters that restrict the order execution to the open of the next bar. The default is false.
when (bool) : (bool) An optional parmeter. Condition, deprecated.
Returns: (void)
ticks_to_price(ticks, from)
Converts ticks to a price offset from the supplied price or the average entry price.
Parameters:
ticks (float) : (float) Ticks to convert to a price.
from (float) : (float) A price that can be used to calculate from. Optional. The default value is `strategy.position_avg_price`.
Returns: (float) A price level that has a distance from the entry price equal to the specified number of ticks.
method exit(this, id, from_entry, qty, qty_percent, profit, limit, loss, stop, trail_price, trail_points, trail_offset, oca_name, comment, comment_profit, comment_loss, comment_trailing, alert_message, alert_profit, alert_loss, alert_trailing, when)
It is a command to exit either a specific entry, or whole market position. If an order with the same ID is already pending, it is possible to modify the order. If an entry order was not filled, but an exit order is generated, the exit order will wait till entry order is filled and then the exit order is placed. To deactivate an exit order, the command strategy.cancel or strategy.cancel_all should be used. If the function strategy.exit is called once, it exits a position only once. If you want to exit multiple times, the command strategy.exit should be called multiple times. If you use a stop loss and a trailing stop, their order type is 'stop', so only one of them is placed (the one that is supposed to be filled first). If all the following parameters 'profit', 'limit', 'loss', 'stop', 'trail_points', 'trail_offset' are 'NaN', the command will fail. To use market order to exit, the command strategy.close or strategy.close_all should be used.
Namespace types: bot
Parameters:
this (bot)
id (string) : (string) A required parameter. The order identifier. It is possible to cancel or modify an order by referencing its identifier.
from_entry (string) : (string) An optional parameter. The identifier of a specific entry order to exit from it. To exit all entries an empty string should be used. The default values is empty string.
qty (float) : (float) An optional parameter. Number of contracts/shares/lots/units to exit a trade with. The default value is 'NaN'.
qty_percent (float) : (float) Defines the percentage of (0-100) the position to close. Its priority is lower than that of the 'qty' parameter. Optional. The default is 100.
profit (float) : (float) An optional parameter. Profit target (specified in ticks). If it is specified, a limit order is placed to exit market position when the specified amount of profit (in ticks) is reached. The default value is 'NaN'.
limit (float) : (float) An optional parameter. Profit target (requires a specific price). If it is specified, a limit order is placed to exit market position at the specified price (or better). Priority of the parameter 'limit' is higher than priority of the parameter 'profit' ('limit' is used instead of 'profit', if its value is not 'NaN'). The default value is 'NaN'.
loss (float) : (float) An optional parameter. Stop loss (specified in ticks). If it is specified, a stop order is placed to exit market position when the specified amount of loss (in ticks) is reached. The default value is 'NaN'.
stop (float) : (float) An optional parameter. Stop loss (requires a specific price). If it is specified, a stop order is placed to exit market position at the specified price (or worse). Priority of the parameter 'stop' is higher than priority of the parameter 'loss' ('stop' is used instead of 'loss', if its value is not 'NaN'). The default value is 'NaN'.
trail_price (float) : (float) An optional parameter. Trailing stop activation level (requires a specific price). If it is specified, a trailing stop order will be placed when the specified price level is reached. The offset (in ticks) to determine initial price of the trailing stop order is specified in the 'trail_offset' parameter: X ticks lower than activation level to exit long position; X ticks higher than activation level to exit short position. The default value is 'NaN'.
trail_points (float) : (float) An optional parameter. Trailing stop activation level (profit specified in ticks). If it is specified, a trailing stop order will be placed when the calculated price level (specified amount of profit) is reached. The offset (in ticks) to determine initial price of the trailing stop order is specified in the 'trail_offset' parameter: X ticks lower than activation level to exit long position; X ticks higher than activation level to exit short position. The default value is 'NaN'.
trail_offset (float) : (float) An optional parameter. Trailing stop price (specified in ticks). The offset in ticks to determine initial price of the trailing stop order: X ticks lower than 'trail_price' or 'trail_points' to exit long position; X ticks higher than 'trail_price' or 'trail_points' to exit short position. The default value is 'NaN'.
oca_name (string) : (string) An optional parameter. Name of the OCA group (oca_type = strategy.oca.reduce) the profit target, the stop loss / the trailing stop orders belong to. If the name is not specified, it will be generated automatically.
comment (string) : (string) Additional notes on the order. If specified, displays near the order marker on the chart. Optional. The default is na.
comment_profit (string) : (string) Additional notes on the order if the exit was triggered by crossing `profit` or `limit` specifically. If specified, supercedes the `comment` parameter and displays near the order marker on the chart. Optional. The default is na.
comment_loss (string) : (string) Additional notes on the order if the exit was triggered by crossing `stop` or `loss` specifically. If specified, supercedes the `comment` parameter and displays near the order marker on the chart. Optional. The default is na.
comment_trailing (string) : (string) Additional notes on the order if the exit was triggered by crossing `trail_offset` specifically. If specified, supercedes the `comment` parameter and displays near the order marker on the chart. Optional. The default is na.
alert_message (string) : (string) Text that will replace the '{{strategy.order.alert_message}}' placeholder when one is used in the "Message" field of the "Create Alert" dialog. Optional. The default is na.
alert_profit (string) : (string) Text that will replace the '{{strategy.order.alert_message}}' placeholder when one is used in the "Message" field of the "Create Alert" dialog. Only replaces the text if the exit was triggered by crossing `profit` or `limit` specifically. Optional. The default is na.
alert_loss (string) : (string) Text that will replace the '{{strategy.order.alert_message}}' placeholder when one is used in the "Message" field of the "Create Alert" dialog. Only replaces the text if the exit was triggered by crossing `stop` or `loss` specifically. Optional. The default is na.
alert_trailing (string) : (string) Text that will replace the '{{strategy.order.alert_message}}' placeholder when one is used in the "Message" field of the "Create Alert" dialog. Only replaces the text if the exit was triggered by crossing `trail_offset` specifically. Optional. The default is na.
when (bool) : (bool) An optional parmeter. Condition, deprecated.
Returns: (void)
percent_to_ticks(percent, from)
Converts a percentage of the supplied price or the average entry price to ticks.
Parameters:
percent (float) : (float) The percentage of supplied price to convert to ticks. 50 is 50% of the entry price.
from (float) : (float) A price that can be used to calculate from. Optional. The default value is `strategy.position_avg_price`.
Returns: (float) A value in ticks.
percent_to_price(percent, from)
Converts a percentage of the supplied price or the average entry price to a price.
Parameters:
percent (float) : (float) The percentage of the supplied price to convert to price. 50 is 50% of the supplied price.
from (float) : (float) A price that can be used to calculate from. Optional. The default value is `strategy.position_avg_price`.
Returns: (float) A value in the symbol's quote currency (USD for BTCUSD).
bot
Fields:
password (series__string)
start_time (series__integer)
end_time (series__integer)
leverage (series__integer)
initial_capital (series__float)
default_qty_type (series__string)
default_qty_value (series__float)
margin_mode (series__string)
contract_size (series__float)
kis_number (series__integer)
entry_percent (series__float)
close_percent (series__float)
exit_percent (series__float)
log_table (series__table)
fixed_qty (series__float)
fixed_cash (series__float)
real (series__bool)
auto_alert_message (series__bool)
hide_trade_line (series__bool)
Price Based Z-Trend - Strategy [presentTrading]█ Introduction and How it is Different
Z-score: a statistical measurement of a score's relationship to the mean in a group of scores.
Simple but effective approach.
The "Price Based Z-Trend - Strategy " leverages the Z-score, a statistical measure that gauges the deviation of a price from its moving average, normalized against its standard deviation. This strategy stands out due to its simplicity and effectiveness, particularly in markets where price movements often revert to a mean. Unlike more complex systems that might rely on a multitude of indicators, the Z-Trend strategy focuses on clear, statistically significant price movements, making it ideal for traders who prefer a streamlined, data-driven approach.
BTCUSD 6h LS Performance
█ Strategy, How It Works: Detailed Explanation
🔶 Calculation of the Z-score
"Z-score is a statistical measurement that describes a value's relationship to the mean of a group of values. Z-score is measured in terms of standard deviations from the mean. If a Z-score is 0, it indicates that the data point's score is identical to the mean score. A Z-score of 1.0 would indicate a value that is one standard deviation from the mean. Z-scores may be positive or negative, with a positive value indicating the score is above the mean and a negative score indicating it is below the mean."
The Z-score is central to this strategy. It is calculated by taking the difference between the current price and the Exponential Moving Average (EMA) of the price over a user-defined length, then dividing this by the standard deviation of the price over the same length:
z = (x - μ) /σ
Local
🔶 Trading Signals
Trading signals are generated based on the Z-score crossing predefined thresholds:
- Long Entry: When the Z-score crosses above the positive threshold.
- Long Exit: When the Z-score falls below the negative threshold.
- Short Entry: When the Z-score falls below the negative threshold.
- Short Exit: When the Z-score rises above the positive threshold.
█ Trade Direction
The strategy allows users to select their preferred trading direction through an input option.
█ Usage
To use this strategy effectively, traders should first configure the Z-score thresholds according to their risk tolerance and market volatility. It's also crucial to adjust the length for the EMA and standard deviation calculations based on historical performance and the expected "noise" in price data.
The strategy is designed to be flexible, allowing traders to refine settings to better capture profitable opportunities in specific market conditions.
█ Default Settings
- Trade Direction: Both
- Standard Deviation Length: 100
- Average Length: 100
- Threshold for Z-score: 1.0
- Bar Color Indicator: Enabled
These settings offer a balanced starting point but can be customized to suit various trading styles and market environments. The strategy's parameters are designed to be adjusted as traders gain experience and refine their approach based on ongoing market analysis.
Z-score is a must-learn approach for every algorithmic trader.

Trend Catcher Strategywhat is Trend Catcher Strategy?
it is a strategy that opens long or short positions in the direction of the trend.
what it does?
TCS detects trend formations using its own unique method. Then, it opens a position in the direction of the trend and closes a part of the opened transaction (half according to default values) when the price reaches a certain level, and moves the remaining position to the point where it thinks the trend is over. You can easily understand how it works by looking at the images:
how it does it?
It obtains a value called a "limit" by dividing the difference between the highest value and the lowest value in a certain range (that is, the vector sum) to the sum of the lengths of the candles in a certain range (the total distance traveled). then multiplies this by 100 to get a percentage value. The closer this value is to 100, the stronger the trend.

Market Structure Volume Distribution [LuxAlgo]The Market Structure Volume Distribution tool allows traders to identify the strength behind breaks of market structure at defined price ranges to measure de correlation of forces between bulls and bears visually and easily.
🔶 USAGE
This tool has three main features: market structure highlighting, grid levels, and volume profile. Each feature is covered more in depth below:
🔹 Market Structure
The basic unit of market structure is a swing point, the period of the swing point is user-defined, so traders can identify longer-term market structures. Price breaking a prior swing point will confirm the occurrence of a market structure.
The tool will plot a line after a market structure is confirmed, by default the lines on bullish MS will be green (indicative of an uptrend), and red in case of bearish MS (indicative of a downtrend).
🔹 Grid Levels
The Grid visually divides the price range contained inside the tool execution window, into equal size rows, the number of rows is user-defined so users can divide the full price range up to 100 rows.
The main objective of this feature is to help identify the execution window and the limits of each row in the volume profile so traders can know in a simple look what BoMS belongs to each row.
There is however another use for the grid, by dividing the range into equal-sized parts, this feature provides automatic support and resistance levels as good as any other.
Grid provides a visual help to know what our execution window is and to associate MS with their rows in the profile. It can provide S/R levels too.
🔹 Volume Profile
The volume profile feature shows in a visually easy way the volume behind each MS aggregated by rows and divided into buy and sell volume to spot the differences in a simple look.
This tool allows users to spot the liquidity associated with the event of a market structure in a specific price range, allowing users to know which price areas where associated with the most trading activity during the occurrence of a market structutre.
🔶 SETTINGS
🔹 Data Gathering
Execute on all visible range: Activate this to use all visible bars on the calculations. This disables the use of the next parameter "Execute on the last N bars". Default false.
Execute on the last N bars: Use last N bars on the calculations. To use this parameter "Execute on all visible range" must be disabled. Values from 20 to 5000, default 500.
Pivot Length: How many bars will be used to confirm a pivot. The bigger this parameter is the fewer breaks of structure will detect. Values from 1, default 2
🔹 Profile
Profile Rows: Number of rows in the volume profile. Values from 2 to 100, default 10.
Profile Width: Maximum width of the volume profile. Values from 25 to 500, default 200.
Profile Mode: How the volume will be displayed on each row. "TOTAL VOLUME" will aggregate buy & sell volume per row, "BUY&SELL VOLUME" will separate the buy volume from the sell volume on each row. Default BUY&SELL VOLUME.
🔹 Style
Buy Color: This is the color for the buy volume on the profile when the "BUY&SELL VOLUME" mode is activated. Default green.
Sell Color: This is the color for the sell volume on the profile when the "BUY&SELL VOLUME" mode is activated. Default red.
Show dotted grid levels: Show dotted inner grid levels. Default true.

Fibonacci Entry SignalsЭтот индикатор "Fibonacci Entry Signals" помогает определить точки входа в покупку и продажу на основе уровней Фибоначчи и скользящей средней.
Ключевые особенности:
Уровни Фибоначчи: Индикатор рисует на графике несколько уровней Фибоначчи, таких как 38.2%, 50% и 61.8%. Эти уровни определяются на основе крайних точек цены за последние 100 баров. Уровень 0% соответствует самой низкой точке, а уровень 100% - самой высокой.
Точки входа: При наступлении условий входа в покупку или продажу, индикатор отмечает на графике точки входа в виде треугольников вверх или вниз соответственно. Условия входа в покупку определяются, когда цена пересекает уровень Фибоначчи 38.2% вверх и находится выше скользящей средней за последние 50 баров. Условия входа в продажу аналогичны, но цена пересекает уровень Фибоначчи 61.8% вниз.
Этот индикатор может быть полезен для трейдеров, которые используют уровни Фибоначчи в своей торговой стратегии и ищут точки входа в рынок. Однако, перед использованием на реальном счете, рекомендуется провести тщательное тестирование и адаптацию к своим индивидуальным потребностям и стратегии торговли.
Давайте рассмотрим, как пользоваться индикатором "Fibonacci Entry Signals":
Установка на график: Для начала необходимо добавить индикатор на график вашего торгового актива. Вы можете сделать это, выбрав его из списка индикаторов в торговой платформе.
Интерпретация уровней Фибоначчи: Индикатор отображает на графике несколько уровней Фибоначчи, таких как 38.2%, 50% и 61.8%. Понимание этих уровней поможет вам определить возможные точки входа в рынок. Обычно, уровень 38.2% используется как уровень поддержки, а уровень 61.8% - как уровень сопротивления.
Точки входа в покупку и продажу: Индикатор помогает определить моменты, когда можно войти в покупку или продажу. При наступлении условий входа в покупку, индикатор отмечает на графике точку входа в виде зеленого треугольника вверх. При наступлении условий входа в продажу, индикатор отмечает точку входа на графике в виде красного треугольника вниз.
Управление позициями: После получения сигнала от индикатора, решение о входе в позицию остается за вами. Важно помнить, что индикатор является только инструментом, который помогает в принятии решений, и его сигналы всегда следует подтверждать другими аспектами вашей торговой стратегии, такими как подтверждение другими индикаторами или анализ фундаментальных данных.
Тестирование и адаптация: Прежде чем использовать индикатор на реальном счете, рекомендуется провести тщательное тестирование на исторических данных и адаптировать его к своим индивидуальным торговым потребностям и стратегии.
Индикатор "Fibonacci Entry Signals" может быть полезным инструментом для трейдеров, которые используют уровни Фибоначчи в своей торговой стратегии и ищут точки входа в рынок.
his "Fibonacci Entry Signals" indicator helps identify entry points for buying and selling based on Fibonacci levels and moving averages.
Key features:
Fibonacci Levels: The indicator draws several Fibonacci levels on the chart, such as 38.2%, 50%, and 61.8%. These levels are determined based on the extreme price points over the last 100 bars. The 0% level corresponds to the lowest point, and the 100% level corresponds to the highest point.
Entry Points: When conditions for buying or selling occur, the indicator marks entry points on the chart as upward or downward triangles, respectively. Entry conditions for buying are determined when the price crosses above the 38.2% Fibonacci level and remains above the 50-bar moving average. Entry conditions for selling are similar, but the price crosses below the 61.8% Fibonacci level.
This indicator can be useful for traders who use Fibonacci levels in their trading strategy and look for entry points in the market. However, before using it on a real account, it is recommended to conduct thorough testing and adaptation to your individual trading needs and strategy.
Let's look at how to use the "Fibonacci Entry Signals" indicator:
Installation on the Chart: First, you need to add the indicator to the chart of your trading asset. You can do this by selecting it from the list of indicators in the trading platform.
Interpreting Fibonacci Levels: The indicator displays several Fibonacci levels on the chart, such as 38.2%, 50%, and 61.8%. Understanding these levels will help you identify potential entry points in the market. Usually, the 38.2% level is used as support, and the 61.8% level is used as resistance.
Entry Points for Buying and Selling: The indicator helps identify moments when you can enter buying or selling positions. When conditions for buying occur, the indicator marks the entry point on the chart as a green upward triangle. When conditions for selling occur, the indicator marks the entry point on the chart as a red downward triangle.
Position Management: After receiving a signal from the indicator, the decision to enter a position is up to you. It's important to remember that the indicator is just a tool to help you make decisions, and its signals should always be confirmed by other aspects of your trading strategy, such as confirmation from other indicators or fundamental analysis.
Testing and Adaptation: Before using the indicator on a real account, it's recommended to conduct thorough testing on historical data and adapt it to your individual trading needs and strategy.
The "Fibonacci Entry Signals" indicator can be a useful tool for traders who use Fibonacci levels in their trading strategy and look for entry points in the market.

OBV 1min Volume SqueezeIn the vast realm of trading strategies, few terms evoke as much intrigue as the word "squeeze." It conjures images of pent-up energy, ready to burst forth in a sudden and decisive move. In this blog post, we'll delve into a new trading idea titled the "OBV 1-Minute Volume Squeeze" which aims to catch bigger market movements by fetching 1 minute OBV data on higher time charts.
The Essence of Squeeze
In trading parlance, a "squeeze" typically denotes a scenario where volatility contracts, and prices consolidate within a narrow range. Translating this concept to volume dynamics, a "volume squeeze" suggests a period of compressed volume activity. It is unclear if the Bulls or the Bears are at winning hand and price is thus consolidating. The script calculates buying and selling pressure by fetching 1 min data. The total volume presure is the sum of absolute values of the buying and selling pressure added up. By deviding the Buying volume by the total volume we know the Buying Pressure.
The trading theory suggest that when the buying pressure exceeds a certain value eg. 50% (default value in the script is 55%) it is likely the trend will continue to go up for a longer period of time. Vice Versa when selling pressure is higher, the trend is likely to continue down. In the script you can adjust the sensitivity in such way a higher "Volume Pressure %" result in less trading signals.
Fetching 1 min data
The OBV is a wonderful indicator to measure the buying and selling pressure. A disadvantage of the script is that the total volume pressure is presented as a positive (buying) or negative value (selling) value in the Oscillator. It does not offset the Bulls power against the Bears power at given time. The script aims to do measure the directional volume power by defining a volume pressure % (oulier value) by fetching 1 min OBV data on higher time frame charts comparing the Bulls power against the Bears Power. The code is included below:
// Fetch Lower Timeframe Data in an array
// nV = ZeroValue, sV = Selling Volume, bV = Buying Volume, tV = Total Volume
= request.security_lower_tf(syminfo.tickerid, '1', )
sum_bV_Lengthbars = array.sum(bV)
sum_sV_Lengthbars = array.sum(sV)
sum_tV_Lengthbars = sum_bV_Lengthbars + sum_sV_Lengthbars // Combine buying and selling volumes to get total volume
// Calculate buying and selling volume as percentage of the total volume, but ensure the denominator isn't zero.
buying_percentage = sum_tV_Lengthbars != 0 ? sum_bV_Lengthbars / sum_tV_Lengthbars * 100 : na
selling_percentage = sum_tV_Lengthbars != 0 ? -(sum_sV_Lengthbars / sum_tV_Lengthbars * 100) : na
OBV Oscillator Explanation
The On Balance Volume (OBV) indicator is a technical analysis tool used to measure buying and selling pressure in the market. It does this by keeping a running total of volume flows. OBV is typically calculated by adding the volume on a candle when the price closes higher than the previous candle's close and subtracting the volume on candles when the price closes lower than the previous candles close. If the price closes unchanged from the previous candle, the volume is not added to or subtracted from the OBV. The OBV can be presented as an oscillator. Positve value is the buying pressure and negative values is the selling pressure. In the settings the OBV is calculated based on 1 min data and comes with the following input options for visualization on the chart:
Higher Time Frame Settings (make sure the HTF is higher than the chart you have open)
Type of MA being: EMA, DEMA, TEMA, SMA, WMA, HMA, McGinley
Volume Pressure % (outlier value)
Length of number of bars (of the choosen HTF settings)
Smoothing of number candles of hte opened timechart. Note that higher number of bars to smoothen the indicator results in less signals, but lag of the indicator increases.
The Oscilator contains 3 main lines which are used to determin the entry signals:
Orange Line = the Outlier value in settings described as "Volume Pressure %"
Green Line = Total Buying Pressure OBV
Red Line = Total Selling Pressure OBV
If the Green or Red line is in between the zero line and the orange line the volume is squeezed and waiting for a directional break out.
If the Green line crosses over the orange line the buying pressure is > 55% and triggers a long entry position (green dot). If the Red line crosses under the orange line the selling pressure is > 55% and triggers an short entry (red dot). In the strategy settings this option is called: "Wait for total volume to increase?".
Alternative Strategy Options
In order to play around with different settings users can opt for two more strategy entry settings, called:
"Wait for total volume to deacrease?" --> Only gives a signal when total volume is declining, but buying or selling pressure maintains and crosses % threshold.
"Wait for Pull Back?" --> After a pullback occured and opposite buy/sell pressure gets lower than threshold (direction is shifting)
Turning on all options will logically result into more signals. Note these strategy ideas are experimental and can best be used in confirmation with other indicators.
Moving Average Filter (HTF)
The Oscillator has a horizontal line at the bottom. The line is green when the moving average is in a uptrend and red when the moving average is in a downtrend. The MA Filter comes with the following settings:
Higher Time Frame Setting
Type of MA being: EMA, DEMA, TEMA, SMA, WMA, HMA, McGinley
Length of number of bars (of the choosen HTF settings)
At last I hope you like this volume trading idea and if you have any comments let me know!
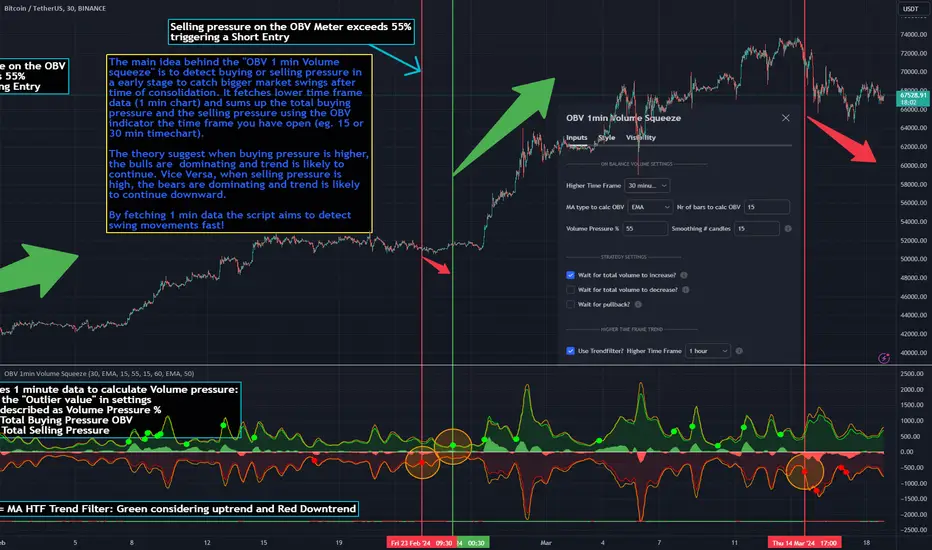
Alligator + Fractals + Divergent & Squat Bars + Signal AlertsThe indicator includes Williams Alligator, Williams Fractals, Divergent Bars, Market Facilitation Index, Highest and Lowest Bars, maximum and minimum peak of Awesome Oscillator, and signal alerts based on Bill Williams' Profitunity strategy.
MFI and Awesome Oscillator
According to the Market Facilitation Index Oscillator, the Squat bar is colored blue, all other bars are colored according to the Awesome Oscillator color, except for the Fake bars, colored with a lighter AO color. In the indicator settings, you can enable the display of "Green" bars (in the "Green Bars > Show" field). In the indicator style settings, you can disable changing the color of bars in accordance with the AO color (in the "AO bars" field), including changing the color for Fake bars (in the "Fake AO bars" field).
MFI is calculated using the formula: (high - low) / volume.
A Squat bar means that, compared to the previous bar, its MFI has decreased and at the same time its volume has increased, i.e. MFI < previous bar and volume > previous bar. A sign of a possible price reversal, so this is a particularly important signal.
A Fake bar is the opposite of a Squat bar and means that, compared to the previous bar, its MFI has increased and at the same time its volume has decreased, i.e. MFI > previous bar and volume < previous bar.
A "Green" bar means that, compared to the previous bar, its MFI has increased and at the same time its volume has increased, i.e. MFI > previous bar and volume > previous bar. A sign of trend continuation. But a more significant trend confirmation or warning of a possible reversal is the Awesome Oscillator, which measures market momentum by calculating the difference between the 5 Period and 34 Period Simple Moving Averages (SMA 5 - SMA 34) based on the midpoints of the bars (hl2). Therefore, by default, the "Green" bars and their opposite "Fade" bars are colored according to the color of the Awesome Oscillator.
According to Bill Williams' Profitunity strategy, using the Awesome Oscillator, the third Elliott wave is determined by the maximum peak of AO in the range from 100 to 140 bars. The presence of divergence between the maximum AO peak and the subsequent lower AO peak in this interval also warns of a possible correction, especially if the AO crosses the zero line between these AO peaks. Therefore, the chart additionally displays the prices of the highest and lowest bars, as well as the maximum or minimum peak of AO in the interval of 140 bars from the last bar. In the indicator settings, you can hide labels, lines, change the number of bars and any parameters for the AO indicator - method (SMA, Smoothed SMA, EMA and others), length, source (open, high, low, close, hl2 and others).
Bullish Divergent bar
🟢 A buy signal (Long) is a Bullish Divergent bar with a green circle displayed above it if such a bar simultaneously meets all of the following conditions:
The high of the bar is below all lines of the Alligator indicator.
The closing price of the bar is above its middle, i.e. close > (high + low) / 2.
The low of the bar is below the low of 2 previous bars or below the low of one previous bar, and the low of the second previous bar is a lower fractal (▼). By default, Divergent bars are not displayed, the low of which is lower than the low of only one previous bar and the low of the 2nd previous bar is not a lower fractal (▼), but you can enable the display of any Divergent bars in the indicator settings (by setting the value "no" in the " field Divergent Bars > Filtration").
The following conditions strengthen the Bullish Divergent bar signal:
The opening price of the bar, as well as the closing price, is higher than its middle, i.e. Open > (high + low) / 2.
The high of the bar is below all lines of the open Alligator indicator, i.e. the green line (Lips) is below the red line (Teeth) and the red line is below the blue line (Jaw). In this case, the color of the circle above the Bullish Divergent bar is dark green.
Squat Divergent bar.
The bar following the Bullish Divergent bar corresponds to the green color of the Awesome Oscillator.
Divergence on Awesome Oscillator.
Formation of the lower fractal (▼), in which the low of the Divergent bar is the peak of the fractal.
Bearish Divergent bar
🔴 A signal to sell (Short) is a Bearish Divergent bar under which a red circle is displayed if such a bar simultaneously meets all the following conditions:
The low of the bar is above all lines of the Alligator indicator.
The closing price of the bar is below its middle, i.e. close < (high + low) / 2.
The high of the bar is higher than the high of 2 previous bars or higher than the high of one previous bar, and the high of the second previous bar is an upper fractal (▲). By default, Divergent bars are not displayed, the high of which is higher than the high of only one previous bar and the high of the 2nd previous bar is not an upper fractal (▲), but you can enable the display of any Divergent bars in the indicator settings (by setting the value "no" in the " field Divergent Bars > Filtration").
The following conditions strengthen the Bearish Divergent bar signal:
The opening price of the bar, as well as the closing price, is below its middle, i.e. open < (high + low) / 2.
The low of the bar is above all lines of the open Alligator indicator, i.e. the green line (Lips) is above the red line (Teeth) and the red line is above the blue line (Jaw). In this case, the color of the circle under the Bearish Divergent bar is dark red.
Squat Divergent bar.
The bar following the Bearish Divergent bar corresponds to the red color of the Awesome Oscillator.
Divergence on Awesome Oscillator.
Formation of the upper fractal (▲), in which the high of the Divergent bar is the peak of the fractal.
Alligator lines crossing
Bars crossing the green line (Lips) of the open Alligator indicator is the first warning of a possible correction (price rollback) if one of the following conditions is met:
If the bar closed below the Lips line, which is above the Teeth line, and the Teeth line is above the Jaw line, while the closing price of the previous bar is above the Lips line.
If the bar closed above the Lips line, which is below the Teeth line, and the Teeth line is below the Jaw line, while the closing price of the previous bar is below the Lips line.
The intersection of all open Alligator lines by bars is a sign of a deep correction and a warning of a possible trend change.
Frequent intersection of Alligator lines with each other is a sign of a sideways trend (flat).
Signal Alerts
To receive notifications about signals when creating an alert, you must select the condition "Any alert() function is call", in which case notifications will arrive in the following format:
D — timeframe, for example: D, 4H, 15m.
🟢 BDB⎾ - a signal for a Bullish Divergent bar to buy (Long), triggers once after the bar closes and includes additional signals:
/// — if Alligator is open.
⏉ — if the opening price of the bar, as well as the closing price, is above its middle.
+ Squat 🔷 - Squat bar or + Green ↑ - "Green" bar or + Fake ↓ - Fake bar.
+ AO 🟩 - if after the Divergent bar closes, the oscillator color change for the next bar corresponds the green color of the Awesome Oscillator. ┴/┬ — AO above/below the zero line. ∇ — if there is divergence on AO in the interval of 140 bars from the last bar.
🔴 BDB⎿ - a signal for a Bearish Divergent bar to sell (Short), triggers once after the bar closes and includes additional signals:
/// — if Alligator is open.
⏊ — if the opening price of the bar, as well as the closing price, is below its middle.
+ Squat 🔷 - Squat bar or + Green ↑ - "Green" bar or + Fake ↓ - Fake bar.
+ AO 🟥 - if after the Divergent bar closes, the oscillator color change for the next bar corresponds to the red color of the Awesome Oscillator. ┴/┬ — AO above/below the zero line. ∇ — if there is divergence on AO in the interval of 140 bars from the last bar.
Alert for bars crossing the green line (Lips) of the open Alligator indicator (can be disabled in the indicator settings in the "Alligator > Enable crossing lips alerts" field):
🔴 Crossing Lips ↓ - if the bar closed below the Lips line, which is above than the other lines, while the closing price of the previous bar is above the Lips line.
🟢 Crossing Lips ↑ - if the bar closed above the Lips line, which is below the other lines, while the closing price of the previous bar is below the Lips line.
The fractal signal is triggered after the second bar closes, completing the formation of the fractal, if alerts about fractals are enabled in the indicator settings (the "Fractals > Enable alerts" field):
🟢 Fractal ▲ - upper (Bearish) fractal.
🔴 Fractal ▼ — lower (Bullish) fractal.
⚪️ Fractal ▲/▼ - both upper and lower fractal.
↳ (H=high - L=low) = difference.
If you redirect notifications to a webhook URL, for example, to a Telegram bot, then you need to set the notification template for the webhook in the indicator settings in the "Webhook > Message" field (contains a tooltip with an example), in which you just need to specify the text {{message}}, which will be automatically replaced with the alert text with a ticker and a link to TradingView.
‼️ A signal is not a call to action, but only a reason to analyze the chart to make a decision based on the rules of your strategy.
***
Индикатор включает в себя Williams Alligator, Williams Fractals, Дивергентные бары, Market Facilitation Index, самый высокий и самый низкий бары, максимальный и минимальный пик Awesome Oscillator, а также оповещения о сигналах на основе стратегии Profitunity Билла Вильямса.
MFI и Awesome Oscillator
В соответствии с осциллятором Market Facilitation Index Приседающий бар окрашен в синий цвет, все остальные бары окрашены в соответствии с цветом Awesome Oscillator, кроме Фальшивых баров, которые окрашены более светлым цветом AO. В настройках индикатора вы можете включить отображение "Зеленых" баров (в поле "Green Bars > Show"). В настройках стиля индикатора вы можете выключить изменение цвета баров в соответствии с цветом AO (в поле "AO bars"), в том числе изменить цвет для Фальшивых баров (в поле "Fake AO bars").
MFI рассчитывается по формуле: (high - low) / volume.
Приседающий бар означает, что по сравнению с предыдущим баром его MFI снизился и в тоже время вырос его объем, т.е. MFI < предыдущего бара и объем > предыдущего бара. Признак возможного разворота цены, поэтому это особенно важный сигнал.
Фальшивый бар является противоположностью Приседающему бару и означает, что по сравнению с предыдущим баром его MFI увеличился и в тоже время снизился его объем, т.е. MFI > предыдущего бара и объем < предыдущего бара.
"Зеленый" бар означает, что по сравнению с предыдущим баром его MFI увеличился и в тоже время вырос его объем, т.е. MFI > предыдущего бара и объем > предыдущего бара. Признак продолжения тренда. Но более значимым подтверждением тренда или предупреждением о возможном развороте является Awesome Oscillator, который измеряет движущую силу рынка путем вычисления разницы между 5 Периодной и 34 Периодной Простыми Скользящими Средними (SMA 5 - SMA 34) по средним точкам баров (hl2). Поэтому по умолчанию "Зеленые" бары и противоположные им "Увядающие" бары окрашены в соответствии с цветом Awesome Oscillator.
По стратегии Profitunity Билла Вильямса с помощью осциллятора Awesome Oscillator определяется третья волна Эллиота по максимальному пику AO в интервале от 100 до 140 баров. Наличие дивергенции между максимальным пиком AO и следующим за ним более низким пиком AO в этом интервале также предупреждает о возможной коррекции, особенно если AO переходит через нулевую линию между этими пиками AO. Поэтому на графике дополнительно отображаются цены самого высокого и самого низкого баров, а также максимальный или минимальный пик АО в интервале 140 баров от последнего бара. В настройках индикатора вы можете скрыть метки, линии, изменить количество баров и любые параметры для индикатора AO – метод (SMA, Smoothed SMA, EMA и другие), длину, источник (open, high, low, close, hl2 и другие).
Бычий Дивергентный бар
🟢 Сигналом на покупку (Long) является Бычий Дивергентный бар над которым отображается зеленый круг, если такой бар соответствует одновременно всем следующим условиям:
Максимум бара ниже всех линий индикатора Alligator.
Цена закрытия бара выше его середины, т.е. close > (high + low) / 2.
Минимум бара ниже минимума 2-х предыдущих баров или ниже минимума одного предыдущего бара, а минимум второго предыдущего бара является нижним фракталом (▼). По умолчанию не отображаются Дивергентные бары, минимум которых ниже минимума только одного предыдущего бара и минимум 2-го предыдущего бара не является нижним фракталом (▼), но вы можете включить отображение любых Дивергентных баров в настройках индикатора (установив значение "no" в поле "Divergent Bars > Filtration").
Усилением сигнала Бычьего Дивергентного бара являются следующие условия:
Цена открытия бара, как и цена закрытия, выше его середины, т.е. Open > (high + low) / 2.
Максимум бара ниже всех линий открытого индикатора Alligator, т.е. зеленая линия (Lips) ниже красной линии (Teeth) и красная линия ниже синей линии (Jaw). В этом случае цвет круга над Бычьим Дивергентным баром окрашен в темно-зеленый цвет.
Приседающий Дивергентный бар.
Бар, следующий за Бычьим Дивергентным баром, соответствует зеленому цвету Awesome Oscillator.
Дивергенция на Awesome Oscillator.
Образование нижнего фрактала (▼), у которого минимум Дивергентного бара является пиком фрактала.
Медвежий Дивергентный бар
🔴 Сигналом на продажу (Short) является Медвежий Дивергентный бар под которым отображается красный круг, если такой бар соответствует одновременно всем следующим условиям:
Минимум бара выше всех линий индикатора Alligator.
Цена закрытия бара ниже его середины, т.е. close < (high + low) / 2.
Максимум бара выше маскимума 2-х предыдущих баров или выше максимума одного предыдущего бара, а максимум второго предыдущего бара является верхним фракталом (▲). По умолчанию не отображаются Дивергентные бары, максимум которых выше максимума только одного предыдущего бара и максимум 2-го предыдущего бара не является верхним фракталом (▲), но вы можете включить отображение любых Дивергентных баров в настройках индикатора (установив значение "no" в поле "Divergent Bars > Filtration").
Усилением сигнала Медвежьего Дивергентного бара являются следующие условия:
Цена открытия бара, как и цена закрытия, ниже его середины, т.е. open < (high + low) / 2.
Минимум бара выше всех линий открытого индикатора Alligator, т.е. зеленая линия (Lips) выше красной линии (Teeth) и красная линия выше синей линии (Jaw). В этом случае цвет круга под Медвежьим Дивергентным Баром окрашен в темно-красный цвет.
Приседающий Дивергентный бар.
Бар, следующий за Медвежьим Дивергентным баром, соответствует красному цвету Awesome Oscillator.
Дивергенция на Awesome Oscillator.
Образование верхнего фрактала (▲), у которого максимум Дивергентного бара является пиком фрактала.
Пересечение линий Alligator
Пересечение барами зеленой линии (Lips) открытого индикатора Alligator является первым предупреждением о возможной коррекции (откате цены) при выполнении одного из следующих условий:
Если бар закрылся ниже линии Lips, которая выше линии Teeth, а линия Teeth выше линии Jaw, при этом цена закрытия предыдущего бара находится выше линии Lips.
Если бар закрылся выше линии Lips, которая ниже линии Teeth, а линия Teeth ниже линии Jaw, при этом цена закрытия предыдущего бара находится ниже линии Lips.
Пересечение барами всех линий открытого Alligator является признаком глубокой коррекции и предупреждением о возможной смене тренда.
Частое пересечение линий Alligator между собой является признаком бокового тренда (флэт).
Оповещения о сигналах
Для получения уведомлений о сигналах при создании оповещения необходимо выбрать условие "При любом вызове функции alert()", в таком случае уведомления будут приходить в следующем формате:
D — таймфрейм, например: D, 4H, 15m.
🟢 BDB⎾ — сигнал Бычьего Дивергентного бара на покупку (Long), срабатывает один раз после закрытия бара и включает дополнительные сигналы:
/// — если Alligator открыт.
⏉ — если цена открытия бара, как и цена закрытия, выше его середины.
+ Squat 🔷 — Приседающий бар или + Green ↑ — "Зеленый" бар или + Fake ↓ — Фальшивый бар.
+ AO 🟩 — если после закрытия Дивергентного бара, изменение цвета осциллятора для следующего бара соответствует зеленому цвету Awesome Oscillator. ┴/┬ — AO выше/ниже нулевой линии. ∇ — если есть дивергенция на AO в интервале 140 баров от последнего бара.
🔴 BDB⎿ — сигнал Медвежьего Дивергентного бара на продажу (Short), срабатывает один раз после закрытия бара и включает дополнительные сигналы:
/// — если Alligator открыт.
⏊ — если цена открытия бара, как и цена закрытия, ниже его середины.
+ Squat 🔷 — Приседающий бар или + Green ↑ — "Зеленый" бар или + Fake ↓ — Фальшивый бар.
+ AO 🟥 — если после закрытия Дивергентного бара, изменение цвета осциллятора для следующего бара соответствует красному цвету Awesome Oscillator. ┴/┬ — AO выше/ниже нулевой линии. ∇ — если есть дивергенция на AO в интервале 140 баров от последнего бара.
Сигнал пересечения барами зеленой линии (Lips) открытого индикатора Alligator (можно отключить в настройках индикатора в поле "Alligator > Enable crossing lips alerts"):
🔴 Crossing Lips ↓ — если бар закрылся ниже линии Lips, которая выше остальных линий, при этом цена закрытия предыдущего бара находится выше линии Lips.
🟢 Crossing Lips ↑ — если бар закрылся выше линии Lips, которая ниже остальных линий, при этом цена закрытия предыдущего бара находится ниже линии Lips.
Сигнал фрактала срабатывает после закрытия второго бара, завершающего формирование фрактала, если оповещения о фракталах включены в настройках индикатора (поле "Fractals > Enable alerts"):
🟢 Fractal ▲ — верхний (Медвежий) фрактал.
🔴 Fractal ▼ — нижний (Бычий) фрактал.
⚪️ Fractal ▲/▼ — одновременно верхний и нижний фрактал.
↳ (H=high - L=low) = разница.
Если вы перенаправляете оповещения на URL вебхука, например, в бота Telegram, то вам необходимо установить шаблон оповещения для вебхука в настройках индикатора в поле "Webhook > Message" (содержит подсказку с примером), в котором в качестве текста сообщения достаточно указать текст {{message}}, который будет автоматически заменен на текст оповещения с тикером и ссылкой на TradingView.
‼️ Сигнал — это не призыв к действию, а лишь повод проанализировать график для принятия решения на основе правил вашей стратегии.
