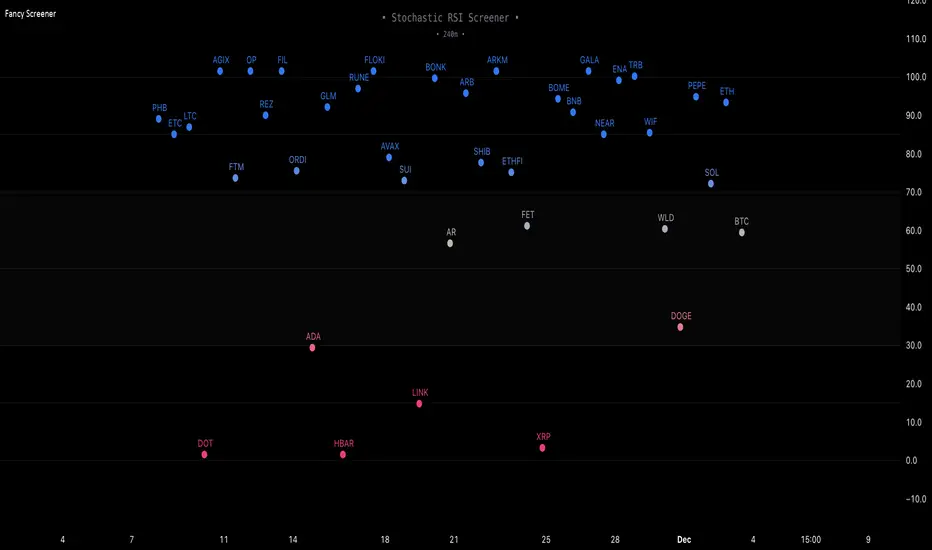
Fancy Oscillator Screener [Daveatt]⬛ OVERVIEW
Building upon LeviathanCapital original RSI Screener (), this enhanced version brings comprehensive technical analysis capabilities to your trading workflow. Through an intuitive grid display, you can monitor multiple trading instruments simultaneously while leveraging powerful indicators to identify market opportunities in real-time.
⬛ FEATURES
This script provides a sophisticated visualization system that supports both cross rates and heat map displays, allowing you to track exchange rates and percentage changes with ease. You can organize up to 40 trading pairs into seven customizable groups, making it simple to focus on specific market segments or trading strategies.
If you overlay on any circle/asset on the chart, you'll see the accurate oscillator value displayed for that asset
⬛ TECHNICAL INDICATORS
The screener supports the following oscillators:
• RSI - the oscillator from the original script version
• Awesome Oscillator
• Chaikin Oscillator
• Stochastic RSI
• Stochastic
• Volume Oscillator
• CCI
• Williams %R
• MFI
• ROC
• ATR Multiple
• ADX
• Fisher Transform
• Historical Volatility
• External : connect your own custom oscillator
⬛ DYNAMIC SCALING
One of the key improvements in this version is the implementation of dynamic chart scaling. Unlike the original script which was optimized for RSI's 0-100 range, this version automatically adjusts its scale based on the selected oscillator.
This adaptation was necessary because different indicators operate on vastly different numerical ranges - for instance, CCI typically ranges from -200 to +200, while Williams %R operates from -100 to 0.
The dynamic scaling ensures that each oscillator's data is properly displayed within its natural range, making the visualization both accurate and meaningful regardless of which indicator you choose to use.
⬛ ALERTS
I've integrated a comprehensive alert system that monitors both overbought and oversold conditions.
Users can now set custom threshold levels for their alerts.
When any asset in your monitored group crosses these thresholds, the system generates an alert, helping you catch potential trading opportunities without constant manual monitoring.
em will help you stay informed of market movements and potential trading opportunities.
I hope you'll find this tool valuable in your trading journey
All the BEST,
Daveatt
"摩根纳斯达克100基金风险大吗" için komut dosyalarını ara
DNSE VN301!, SMA & EMA Cross StrategyDiscover the tailored Pinescript to trade VN30F1M Future Contracts intraday, the strategy focuses on SMA & EMA crosses to identify potential entry/exit points. The script closes all positions by 14:25 to avoid holding any contracts overnight.
HNX:VN301!
www.tradingview.com
Setting & Backtest result:
1-minute chart, initial capital of VND 100 million, entering 4 contracts per time, backtest result from Jan-2024 to Nov-2024 yielded a return over 40%, executed over 1,000 trades (average of 4 trades/day), winning trades rate ~ 30% with a profit factor of 1.10.
The default setting of the script:
A decent optimization is reached when SMA and EMA periods are set to 60 and 15 respectively while the Long/Short stop-loss level is set to 20 ticks (2 points) from the entry price.
Entry & Exit conditions:
Long signals are generated when ema(15) crosses over sma(60) while Short signals happen when ema(15) crosses under sma(60). Long orders are closed when ema(15) crosses under sma(60) while Short orders are closed when ema(15) crosses over sma(60).
Exit conditions happen when (whichever came first):
Another Long/Short signal is generated
The Stop-loss level is reached
The Cut-off time is reached (14:25 every day)
*Disclaimers:
Futures Contracts Trading are subjected to a high degree of risk and price movements can fluctuate significantly. This script functions as a reference source and should be used after users have clearly understood how futures trading works, accessed their risk tolerance level, and are knowledgeable of the functioning logic behind the script.
Users are solely responsible for their investment decisions, and DNSE is not responsible for any potential losses from applying such a strategy to real-life trading activities. Past performance is not indicative/guarantee of future results, kindly reach out to us should you have specific questions about this script.
---------------------------------------------------------------------------------------
Khám phá Pinescript được thiết kế riêng để giao dịch Hợp đồng tương lai VN30F1M trong ngày, chiến lược tập trung vào các đường SMA & EMA cắt nhau để xác định các điểm vào/ra tiềm năng. Chiến lược sẽ đóng tất cả các vị thế trước 14:25 để tránh giữ bất kỳ hợp đồng nào qua đêm.
Thiết lập & Kết quả backtest:
Chart 1 phút, vốn ban đầu là 100 triệu đồng, vào 4 hợp đồng mỗi lần, kết quả backtest từ tháng 1/2024 tới tháng 11/2024 mang lại lợi nhuận trên 40%, thực hiện hơn 1.000 giao dịch (trung bình 4 giao dịch/ngày), tỷ lệ giao dịch thắng ~ 30% với hệ số lợi nhuận là 1,10.
Thiết lập mặc định của chiến lược:
Đạt được một mức tối ưu ổn khi SMA và EMA periods được đặt lần lượt là 60 và 15 trong khi mức cắt lỗ được đặt thành 20 tick (2 điểm) từ giá vào.
Điều kiện Mở và Đóng vị thế:
Tín hiệu Long được tạo ra khi ema(15) cắt trên sma(60) trong khi tín hiệu Short xảy ra khi ema(15) cắt dưới sma(60). Lệnh Long được đóng khi ema(15) cắt dưới sma(60) trong khi lệnh Short được đóng khi ema(15) cắt lên sma(60).
Điều kiện đóng vị thể xảy ra khi (tùy điều kiện nào đến trước):
Một tín hiệu Long/Short khác được tạo ra
Giá chạm mức cắt lỗ
Lệnh chưa đóng nhưng tới giờ cut-off (14:25 hàng ngày)
*Tuyên bố miễn trừ trách nhiệm:
Giao dịch hợp đồng tương lai có mức rủi ro cao và giá có thể dao động đáng kể. Chiến lược này hoạt động như một nguồn tham khảo và nên được sử dụng sau khi người dùng đã hiểu rõ cách thức giao dịch hợp đồng tương lai, đã đánh giá mức độ chấp nhận rủi ro của bản thân và hiểu rõ về logic vận hành của chiến lược này.
Người dùng hoàn toàn chịu trách nhiệm về các quyết định đầu tư của mình và DNSE không chịu trách nhiệm về bất kỳ khoản lỗ tiềm ẩn nào khi áp dụng chiến lược này vào các hoạt động giao dịch thực tế. Hiệu suất trong quá khứ không chỉ ra/cam kết kết quả trong tương lai, vui lòng liên hệ với chúng tôi nếu bạn có thắc mắc cụ thể về chiến lược giao dịch này.

Adapted RSI w/ Multi-Asset Regime Detection v1.1The relative strength index (RSI) is a momentum indicator used in technical analysis. RSI measures the speed and magnitude of an asset's recent price changes to detect overbought or oversold conditions in the price of said asset.
In addition to identifying overbought and oversold assets, the RSI can also indicate whether your desired asset may be primed for a trend reversal or a corrective pullback in price. It can signal when to buy and sell.
The RSI will oscillate between 0 and 100. Traditionally, an RSI reading of 70 or above indicates an overbought condition. A reading of 30 or below indicates an oversold condition.
The RSI is one of the most popular technical indicators. I intend to offer a fresh spin.
Adapted RSI w/ Multi-Asset Regime Detection
Our Adapted RSI makes necessary improvements to the original Relative Strength Index (RSI) by combining multi-timeframe analysis with multi-asset monitoring and providing traders with an efficient way to analyse market-wide conditions across different timeframes and assets simultaneously. The indicator automatically detects market regimes and generates clear signals based on RSI levels, presenting this data in an organised, easy-to-read format through two dynamic tables. Simplicity is key, and having access to more RSI data at any given time, allows traders to prepare more effectively, especially when trading markets that "move" together.
How we calculate the RSI
First, the RSI identifies price changes between periods, calculating gains and losses from one look-back period to the next. This look-back period averages gains and losses over 14 periods, which in this case would be 14 days, and those gains/losses are calculated based on the daily closing price. For example:
Average Gain = Sum of Gains over the past 14 days / 14
Average Loss = Sum of Losses over the past 14 days / 14
Then we calculate the Relative Strength (RS):
RS = Average Gain / Average Loss
Finally, this is converted to the RSI value:
RSI = 100 - (100 / (1 + RS))
Key Features
Our multi-timeframe RSI indicator enhances traditional technical analysis by offering synchronised Daily, Weekly, and Monthly RSI readings with automatic regime detection. The multi-asset monitoring system allows tracking of up to 10 different assets simultaneously, with pre-configured major pairs that can be customised to any asset selection. The signal generation system provides clear market guidance through automatic regime detection and a five-level signal system, all presented through a sophisticated visual interface with dynamic RSI line colouring and customisable display options.
Quick Guide to Use it
Begin by adding the indicator to your chart and configuring your preferred assets in the "Asset Comparison" settings.
Position the two information tables according to your preference.
The main table displays RSI analysis across three timeframes for your current asset, while the asset table shows a comparative analysis of all monitored assets.
Signals are colour-coded for instant recognition, with green indicating bullish conditions and red for bearish conditions. Pay special attention to regime changes and signal transitions, using multi-timeframe confluence to identify stronger signals.
How it Works (Regime Detection & Signals)
When we say 'Regime', a regime is determined by a persistent trend or in this case momentum and by leveraging this for RSI, which is a momentum oscillator, our indicator employs a relatively simple regime detection system that classifies market conditions as either Bullish (RSI > 50) or Bearish (RSI < 50). Our benchmark between a trending bullish or bearish market is equal to 50. By leveraging a simple classification system helps determine the probability of trend continuation and the weight given to various signals. Whilst we could determine a Neutral regime for consolidating markets, we have employed a 'neutral' signal generation which will be further discussed below...
Signal generation occurs across five distinct levels:
Strong Buy (RSI < 15)
Buy (RSI < 30)
Neutral (RSI 30-70)
Sell (RSI > 70)
Strong Sell (RSI > 85)
Each level represents different market conditions and probability scenarios. For instance, extreme readings (Strong Buy/Sell) indicate the highest probability of mean reversion, while neutral readings suggest equilibrium conditions where traders should focus on the overall regime bias (Bullish/Bearish momentum).
This approach offers traders a new and fresh spin on a popular and well-known tool in technical analysis, allowing traders to make better and more informed decisions from the well presented information across multiple assets and timeframes. Experienced and beginner traders alike, I hope you enjoy this adaptation.

RSI + Normalized Fisher Transform with SignalsThis indicator combines three tools for market analysis: the Relative Strength Index (RSI), the RSI's moving average, and the Fisher Transform. RSI is a momentum oscillator that measures the speed and change of price movements, helping identify overbought and oversold conditions. The RSI moving average is a smoothed version of the RSI that filters noise and confirms trends. The Fisher Transform is a mathematical technique that transforms price data into a Gaussian normal distribution, making it easier to identify turning points. It has been normalized to the same scale as the RSI (0-100) for consistency.
Purpose
The goal of this indicator is to identify potential buy and sell opportunities with varying degrees of strength (strong and weak). By combining the RSI, its moving average, and the Fisher Transform, the indicator ensures signals are based on both momentum and reversals, making it highly versatile across different market conditions.
Key Features
This indicator provides strong and weak buy and sell signals. A strong buy occurs when the RSI crosses above its moving average while both the RSI and its moving average are oversold (below the default threshold of 30), and the Fisher Transform reverses direction within the same or prior bar while also being oversold. A weak buy occurs when the Fisher Transform is oversold, and the RSI crosses above its moving average while its value is between the default oversold threshold (30) and 50. A strong sell occurs when the RSI crosses below its moving average while both the RSI and its moving average are overbought (above the default threshold of 70), and the Fisher Transform reverses direction within the same or prior bar while also being overbought. A weak sell occurs when the Fisher Transform is overbought, and the RSI crosses below its moving average while its value is between 50 and the default overbought threshold (70).
The indicator includes customizable thresholds and lengths. Users can adjust the oversold and overbought thresholds to suit their trading style. The RSI length, moving average length, and Fisher Transform length are also customizable. The Fisher Transform is scaled to the RSI’s range of 0-100 to simplify analysis and signal interpretation.
How to Use the Indicator
On the chart, you will see the RSI line in blue, the RSI moving average in orange, and the Fisher Transform in purple. Horizontal lines at the default oversold (30) and overbought (70) levels mark critical zones for signals. Adjust these thresholds in the indicator settings as needed.
Strong buy signals are shown as larger, darker green arrows below the price. Weak buy signals are small lime arrows below the price. Strong sell signals are larger, darker red arrows above the price. Weak sell signals are small fuchsia arrows above the price.
Signal Interpretation
A strong buy indicates a highly favorable buying opportunity. This typically occurs when the asset is in a downtrend but shows signs of reversal, particularly in oversold zones. A weak buy suggests a potential buying opportunity but with less conviction, often when the market is neutral to slightly bearish but showing upward momentum. A strong sell indicates a highly favorable selling opportunity, usually occurring when the asset is in an uptrend but shows signs of reversal, particularly in overbought zones. A weak sell suggests a potential selling opportunity but with less conviction, often in neutral to slightly bullish markets showing downward momentum.
Practical Tips
Avoid using signals in isolation. Combine this indicator with other tools such as trendlines, moving averages, or support/resistance levels for greater accuracy. Adjust the parameters for different assets to match their volatility. For volatile assets, consider wider thresholds like 20/80 for oversold/overbought levels. For less volatile assets, tighter thresholds like 35/65 may be more appropriate. Use higher timeframes to confirm signals before trading on lower timeframes. Be cautious in sideways markets, as both RSI and the Fisher Transform perform better in trending conditions.
Instructions for Adjustments
To change the oversold or overbought levels, open the indicator settings by clicking the gear icon and modify the "Oversold Threshold" and "Overbought Threshold" values. To adjust lengths for RSI and Fisher Transform, update the "RSI Length," "RSI Moving Average Length," and "Fisher Transform Length" settings. If needed, toggle signal visibility by enabling or disabling specific arrows (Strong Buy, Weak Buy, Strong Sell, Weak Sell) in the "Style" tab.
Best Practices
Risk management is essential. Always set appropriate stop-loss levels and position sizes based on your risk tolerance. Backtest the indicator on historical data to understand its performance and behavior for your chosen asset and timeframe. Combining this indicator with volume or volatility analysis (Bollinger Band Width, for example) can help confirm signal validity.
This indicator simplifies decision-making by identifying high-probability trading opportunities using a combination of momentum, trend, and reversals. Follow these instructions to fully utilize its capabilities without needing to analyze the underlying code.

Super CCI By Baljit AujlaThe indicator you've shared is a custom CCI (Commodity Channel Index) with multiple types of Moving Averages (MA) and Divergence Detection. It is designed to help traders identify trends and reversals by combining the CCI with various MAs and detecting different types of divergences between the price and the CCI.
Key Components of the Indicator:
CCI (Commodity Channel Index):
The CCI is an oscillator that measures the deviation of the price from its average price over a specific period. It helps identify overbought and oversold conditions and the strength of a trend.
The CCI is calculated by subtracting a moving average (SMA) from the price and dividing by the average deviation from the SMA. The CCI values fluctuate above and below a zero centerline.
Multiple Moving Averages (MA):
The indicator allows you to choose from a variety of moving averages to smooth the CCI line and identify trend direction or support/resistance levels. The available types of MAs include:
SMA (Simple Moving Average)
EMA (Exponential Moving Average)
WMA (Weighted Moving Average)
HMA (Hull Moving Average)
RMA (Running Moving Average)
SMMA (Smoothed Moving Average)
TEMA (Triple Exponential Moving Average)
DEMA (Double Exponential Moving Average)
VWMA (Volume-Weighted Moving Average)
ZLEMA (Zero-Lag Exponential Moving Average)
You can select the type of MA to use with a specified length to help identify the trend direction or smooth out the CCI.
Divergence Detection:
The indicator includes a divergence detection mechanism to identify potential trend reversals. Divergences occur when the price and an oscillator like the CCI move in opposite directions, signaling a potential change in price momentum.
Four types of divergences are detected:
Bullish Divergence: Occurs when the price makes a lower low, but the CCI makes a higher low. This indicates a potential reversal to the upside.
Bearish Divergence: Occurs when the price makes a higher high, but the CCI makes a lower high. This indicates a potential reversal to the downside.
Hidden Bullish Divergence: Occurs when the price makes a higher low, but the CCI makes a lower low. This suggests a continuation of the uptrend.
Hidden Bearish Divergence: Occurs when the price makes a lower high, but the CCI makes a higher high. This suggests a continuation of the downtrend.
Each type of divergence is marked on the chart with arrows and labels to alert traders to potential trading opportunities. The labels include the divergence type (e.g., "Bull Div" for Bullish Divergence) and have customizable text colors.
Visual Representation:
The CCI and its associated moving average are plotted on the indicator panel below the price chart. The CCI is plotted as a line, and its color changes depending on whether it is above or below the moving average:
Green when the CCI is above the MA (indicating bullish momentum).
Red when the CCI is below the MA (indicating bearish momentum).
Horizontal lines are drawn at specific levels to help identify key CCI thresholds:
200 and -200 levels indicate extreme overbought or oversold conditions.
75 and -75 levels represent less extreme levels of overbought or oversold conditions.
The 0 level acts as a neutral or baseline level.
A background color fill between the 75 and -75 levels helps highlight the neutral zone.
Customization Options:
CCI Length: You can customize the length of the CCI, which determines the period over which the CCI is calculated.
MA Length: The length of the moving average applied to the CCI can also be adjusted.
MA Type: Choose from a variety of moving averages (SMA, EMA, WMA, etc.) to smooth the CCI.
Divergence Detection: The indicator automatically detects the four types of divergences (bullish, bearish, hidden bullish, hidden bearish) and visually marks them on the chart.
How to Use the Indicator:
Trend Identification: When the CCI is above the selected moving average, it suggests bullish momentum. When the CCI is below the moving average, it suggests bearish momentum.
Overbought/Oversold Conditions: The CCI values above 100 or below -100 indicate overbought and oversold conditions, respectively.
Divergence Analysis: The detection of bullish or bearish divergences can signal potential trend reversals. Hidden divergences may suggest trend continuation.
Trading Signals: You can use the divergence markers (arrows and labels) as potential buy or sell signals, depending on whether the divergence is bullish or bearish.
Practical Application:
This indicator is useful for traders who want to:
Combine the CCI with different moving averages for trend-following strategies.
Identify overbought and oversold conditions using the CCI.
Use divergence detection to anticipate potential trend reversals or continuations.
Have a highly customizable tool for various trading strategies, including trend trading, reversal trading, and divergence-based trading.
Overall, this is a comprehensive tool that combines multiple technical analysis techniques (CCI, moving averages, and divergence) in a single indicator, providing traders with a robust way to analyze price action and spot potential trading opportunities.
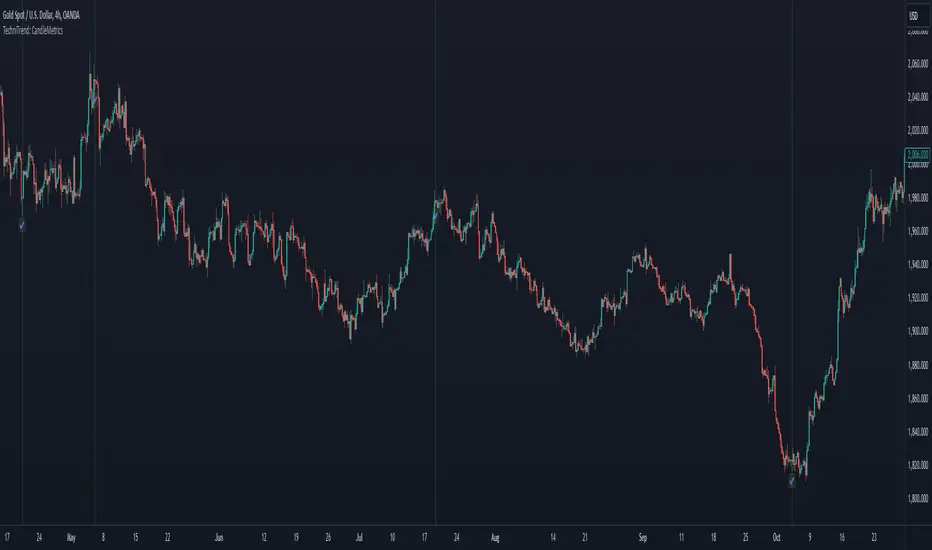
TechniTrend: CandleMetrics🟦 Overview
The TechniTrend: CandleMetrics Indicator is a powerful tool designed to give traders an in-depth analysis of candlestick structures. This indicator allows users to identify potential reversal points, trend continuations, and other crucial market behaviors by examining key ratios between candle components—such as body, shadow, and overall range—alongside volume conditions. The advanced filtering options offer flexibility for both novice and experienced traders, enabling tailored setups to suit different trading strategies.
🟦 Key Features
🔸Customizable Ratios: Set thresholds for Body-to-Range, Shadow-to-Range, Upper Shadow-to-Range, and Lower Shadow-to-Range ratios.
🔸Volume-Based Filters: Integrate volume conditions to strengthen the reliability of signals.
🔸Flexible Conditions: Choose whether filters should work independently or in combination, allowing for precise pattern identification.
🔸Visual Markers: Mark potential signals with a distinct background color and symbols on the chart.
🔸Alerts: Receive notifications for each selected condition, ensuring you never miss an opportunity.
🟦 How It Works
The CandleMetrics Indicator operates by analyzing the relationship between different components of each candlestick, combined with volume data to determine the strength of signals. Here’s a detailed breakdown of each feature:
🔸 Body to Range Ratio:
This filter compares the size of the candle's body to its total range (from high to low).
Example Setting: If you’re interested in spotting candles with small bodies relative to their total range, you might set the Body-to-Range Ratio to “Less than 0.3.”
🔸 Shadow to Range Ratio:
This examines the combined size of both shadows (upper and lower) relative to the entire candle range.
Example Setting: Use a Shadow-to-Range Ratio set to “More than 0.8” to find candles with significant wick lengths, suggesting market indecision.
🔸 Upper Shadow to Range Ratio:
This filter assesses the proportion of the upper shadow (wick) in relation to the candle’s full range.
Example Setting: “Less than 0.05” can help identify situations where the upper shadow is minimal, indicating strong downward pressure.
🔸 Lower Shadow to Range Ratio:
It measures the lower shadow compared to the entire candle range.
Example Setting: “More than 0.7” is useful for detecting potential rejection patterns at lower prices, hinting at a possible bullish reversal.
🔸 Volume Filter:
Integrates volume data to verify the reliability of each candle pattern.
Example Setting: Apply a Volume Filter Length of 100 with an SMA type to smooth volume data over a longer period, filtering out short-term noise and focusing on significant volume shifts.
🟦 Combining Filters
The indicator offers an option to Combine Filters. When this setting is enabled, all selected conditions must be met simultaneously for a candle to be marked. If disabled, each condition functions independently, allowing more flexibility in detecting diverse patterns.
🟦 Examples & Use Cases
🔸Example 1: Spotting Reversal Opportunities
I used the following configuration to find potential bullish reversals:
Upper Shadow to Range Ratio: “Less than 0.05” – Looking for candles with almost no upper shadow.
Lower Shadow to Range Ratio: “More than 0.7” – Highlighting candles with a significant lower shadow.
Volume Filter Length: 100 with SMA.
This setup effectively highlights candles where price rejection is happening at lower levels, suggesting a potential trend reversal to the upside.
🔸Example 2: Detecting Market Uncertainty
If you want to focus on candles showing market hesitation, try:
Shadow to Range Ratio: “More than 0.85” – Emphasizing long-wick candles that could indicate indecision.
Disable Combine Filters to allow flexibility, marking any candle meeting the above criteria.
🟦 Detailed Explanation of Each Option
Here’s a clear and concise breakdown of each option for a better understanding:
1. Body to Range Ratio
Purpose: This ratio shows how significant the candle's body is compared to its overall range. A smaller body-to-range ratio can indicate a potential reversal if the market appears indecisive.
How to Use: Increase the ratio to filter for stronger trend candles; decrease it to identify reversal or indecision candles.
2. Shadow to Range Ratio
Purpose: This filter captures the size of both shadows relative to the candle's total range. A larger ratio often points to market hesitation, while a smaller ratio suggests a decisive move.
How to Use: Adjust this filter to focus on candles with long wicks (indecision) or short wicks (decisiveness).
3. Upper Shadow to Range Ratio
Purpose: Helps to identify candles with strong downward moves by focusing on the upper wick length. A small upper shadow can imply sellers' dominance.
How to Use: Lower the ratio to detect candles with minimal upward rejection.
4. Lower Shadow to Range Ratio
Purpose: Targets candles with strong buying pressure by analyzing the lower shadow. A larger lower shadow may indicate a bullish reversal.
How to Use: Increase the ratio to spot rejection candles with significant lower shadows.
5. Volume Filter
Purpose: Adds a volume component to verify the validity of each candlestick pattern. Higher-than-average volume often signifies the strength of a move.
How to Use: Adjust the filter length and type to smooth out volume fluctuations based on your trading timeframe.
🟦 Indicator Alerts
Each filter has its own alert configuration, enabling traders to stay updated on market conditions that meet their selected criteria. You can customize alerts to trigger whenever a condition is met, helping to manage trades even when away from the screen.
Indicator DashboardThis script creates an 'Indicator Dashboard' designed to assist you in analyzing financial markets and making informed decisions. The indicator provides a summary of current market conditions by presenting various technical analysis indicators in a table format. The dashboard evaluates popular indicators such as Moving Averages, RSI, MACD, and Stochastic RSI. Below, we'll explain each part of this script in detail and its purpose:
### Overview of Indicators
1. **Moving Averages (MA)**:
- This indicator calculates Simple Moving Averages (“SMA”) for 5, 14, 20, 50, 100, and 200 periods. These averages provide a visual summary of price movements. Depending on whether the price is above or below the moving average, it determines the market direction as either “Bullish” or “Bearish.”
2. **RSI (Relative Strength Index)**:
- The RSI helps identify overbought or oversold market conditions. Here, the RSI is calculated for a 14-period window, and this value is displayed in the table. Additionally, the 14-period moving average of the RSI is also included.
3. **MACD (Moving Average Convergence Divergence)**:
- The MACD indicator is used to determine trend strength and potential reversals. This script calculates the MACD line, signal line, and histogram. The MACD condition (“Bullish,” “Bearish,” or “Neutral”) is displayed alongside the MACD and signal line values.
4. **Stochastic RSI**:
- Stochastic RSI is used to identify momentum changes in the market. The %K and %D lines are calculated to determine the market condition (“Bullish” or “Bearish”), which is displayed along with the calculated values for %K and %D.
### Table Layout and Presentation
The dashboard is presented in a vertical table format in the top-right corner of the chart. The table contains two columns: “Indicator” and “Status,” summarizing the condition of each technical indicator.
- **Indicator Column**: Lists each of the indicators being tracked, such as SMA values, RSI, MACD, etc.
- **Status Column**: Displays the current status of each indicator, such as “Bullish,” “Bearish,” or specific values like the RSI or MACD.
The table also includes rounded indicator values for easier interpretation. This helps traders quickly assess market conditions and make informed decisions based on multiple indicators presented in a single location.
### Detailed Indicator Status Calculations
1. **SMA Status**: For each moving average (5, 14, 20, 50, 100, 200), the script checks if the current price is above or below the SMA. The status is determined as “Bullish” if the price is above the SMA and “Bearish” if below, with the value of the SMA also displayed.
2. **RSI and RSI Average**: The RSI value for a 14-period is displayed along with its 14-period SMA, which provides an average reading of the RSI to smooth out volatility.
3. **MACD Indicator**: The MACD line, signal line, and histogram are calculated using standard parameters (12, 26, 9). The status is shown as “Bullish” when the MACD line is above the signal line, and “Bearish” when it is below. The exact values for the MACD line, signal line, and histogram are also included.
4. **Stochastic RSI**: The %K and %D lines of the Stochastic RSI are used to determine the trend condition. If %K is greater than %D, the condition is “Bullish,” otherwise it is “Bearish.” The actual values of %K and %D are also displayed.
### Conclusion
The 'Indicator Dashboard' provides a comprehensive overview of multiple technical indicators in a single, easy-to-read table. This allows traders to quickly gauge market conditions and make more informed decisions. By consolidating key indicators like Moving Averages, RSI, MACD, and Stochastic RSI into one dashboard, it saves time and enhances the efficiency of technical analysis.
This script is particularly useful for traders who prefer a clean and organized overview of their favorite indicators without needing to plot each one individually on the chart. Instead, all the crucial information is available at a glance in a consolidated format.

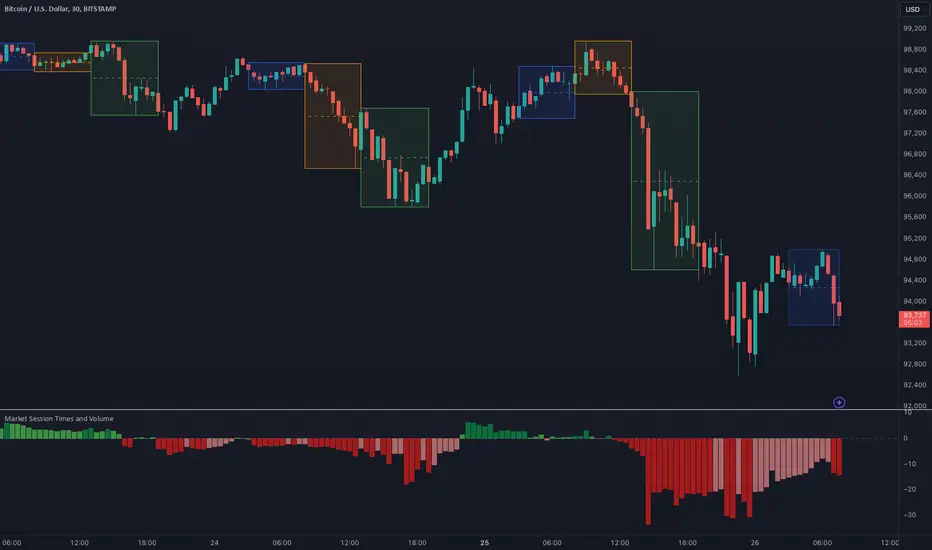
Market Session Times and Volume [Market Spotter]Market Session Times and Volume
Market Session Times
Inputs
The inputs tab consists of timezone adjustment which would be the chosen timezone for the plotting of the market sessions based on the market timings.
Further it contains settings for each box to show/hide and change box colour and timings for Asian, London and New York Sessions.
How it works
The indicator primarily works by marking the session highs and lows for the chosen time in the inputs, each of the sessions can be input a custom time value which would plot the box. It helps to identify the important price levels and the trading range for each individual session.
The midpoint of each session is marked with a dashed line. The indicator also marks a developing session while it being formed as well to identify potential secondary levels.
Usage
It can be used to trade session breakouts, false breaks and also divide the daily movement into parts and identify possible patterns while trading.
2. Volumes
Inputs
The volume part has 2 inputs - Smoothing and Normalisation. The smoothing period can simply be used to take in charge volumes of last X bars and normalisation can be used for calculating relative volumes based on last Y bars.
How it works
The indicator takes into account the buy and sell volumes of last X bars and then displays that as a relative smoothed volume which helps to identify longer term build or distribution of volume. It plots the positive volume from 0 to 100 and negative volume from 0 to -100 which has been normalised. The colors identify gradual increase or decrease in volumes
Usage
It can also be used to trade volume spikes well and can identify potential market shifts
Time Change Indicator-AYNETDetailed Scientific Explanation of the Time Change Indicator Code
This Pine Script code implements a financial indicator designed to measure and visualize the percentage change in the closing price of an asset over a specified timeframe. It uses historical data to calculate changes and displays them as a histogram for intuitive analysis. Below is a comprehensive scientific breakdown of the code:
1. User Inputs
The script begins by defining user-configurable parameters, enabling flexibility in analysis:
timeframe: The user selects the timeframe for measuring price changes (e.g., 1 hour, 1 day). This determines the granularity of the analysis.
positive_color and negative_color: Users choose the colors for positive and negative changes, enhancing visual interpretation.
2. Data Retrieval
The script employs request.security to fetch closing price data (close) for the specified timeframe. This function ensures that the indicator adapts to different timeframes, providing consistent results regardless of the chart's base timeframe.
Current Closing Price (current_close):
current_close
=
request.security(syminfo.tickerid, timeframe, close)
current_close=request.security(syminfo.tickerid, timeframe, close)
Retrieves the closing price for the defined timeframe.
Previous Closing Price (prev_close): The script uses a variable (prev_close) to store the previous closing price. This variable is updated dynamically as new data is processed.
3. Price Change Calculation
The script calculates both the absolute and percentage change in closing price:
Absolute Price Change (price_change):
price_change
=
current_close
−
prev_close
price_change=current_close−prev_close
Measures the difference between the current and previous closing prices.
Percentage Change (percent_change):
percent_change
=
price_change
prev_close
×
100
percent_change=
prev_close
price_change
×100
Normalizes the change relative to the previous closing price, making it easier to compare changes across different assets or timeframes.
4. Conditional Logic for Visualization
The script uses a conditional statement to determine the color of each histogram bar:
Positive Change: If price_change > 0, the bar is assigned the user-defined positive_color.
Negative Change: If price_change < 0, the bar is assigned the negative_color.
This differentiation provides a clear visual cue for understanding price movement direction.
5. Visualization
The script visualizes the percentage change using a histogram and enhances the chart with dynamic labels:
Histogram (plot.style_histogram):
Each bar represents the percentage change for a given timeframe.
Bars above the zero line indicate positive changes, while bars below the zero line indicate negative changes.
Zero Line (hline(0)): A reference line at zero provides a baseline for interpreting changes.
Dynamic Labels (label.new):
Each bar is annotated with its exact percentage change value.
The label's position and color correspond to the bar, improving clarity.
6. Algorithmic Flow
Data Fetching: Retrieve the current and previous closing prices for the specified timeframe.
Change Calculation: Compute the absolute and percentage changes between the two prices.
Bar Coloring: Determine the color of the histogram bar based on the change's direction.
Plotting: Visualize the changes as a histogram and add labels for precise data representation.
7. Applications
This indicator has several practical applications in financial analysis:
Volatility Analysis: By visualizing percentage changes, traders can assess the volatility of an asset over specific timeframes.
Trend Identification: Positive and negative bars highlight periods of upward or downward momentum.
Cross-Asset Comparison: Normalized percentage changes enable the comparison of price movements across different assets, regardless of their nominal values.
Market Sentiment: Persistent positive or negative changes may indicate prevailing bullish or bearish sentiment.
8. Scientific Relevance
This script applies fundamental principles of data visualization and time-series analysis:
Statistical Normalization: Percentage change provides a scale-invariant metric for comparing price movements.
Dynamic Data Processing: By updating the prev_close variable with real-time data, the script adapts to new market conditions.
Visual Communication: The use of color and labels improves the interpretability of quantitative data.
Conclusion
This indicator combines advanced Pine Script functions with robust financial analysis techniques to create an effective tool for evaluating price changes. It is highly adaptable, providing users with the ability to tailor the analysis to their specific needs. If additional features, such as smoothing or multi-timeframe analysis, are required, the code can be further extended.

Math Art with Fibonacci, Trigonometry, and Constants-AYNETScientific Explanation of the Code
This Pine Script code is a dynamic visual representation that combines mathematical constants, trigonometric functions, and Fibonacci sequences to generate geometrical patterns on a TradingView chart. The code leverages Pine Script’s drawing functions (line.new) and real-time bar data to create evolving shapes. Below is a detailed scientific explanation of its components:
1. Inputs and User-Defined Parameters
num_points: Specifies the number of points used to generate the geometrical pattern. Higher values result in more complex and smoother shapes.
scale: A scaling factor to adjust the size of the shape.
rotation: A dynamic rotation factor that evolves the shape over time based on the bar index (bar_index).
shape_color: Defines the color of the drawn shapes.
2. Mathematical Constants
The script employs essential mathematical constants:
Phi (ϕ): Known as the golden ratio
(
1
+
5
)
/
2
(1+
5
)/2, which governs proportions in Fibonacci spirals and natural growth patterns.
Pi (π): Represents the ratio of a circle's circumference to its diameter, crucial for trigonometric calculations.
Euler’s Number (e): The base of natural logarithms, incorporated in exponential growth modeling.
3. Geometric and Trigonometric Calculations
Fibonacci-Based Radius: The radius for each point is determined using a Fibonacci-inspired formula:
𝑟
=
scale
×
𝜙
⋅
𝑖
num_points
r=scale×
num_points
ϕ⋅i
Here,
𝑖
i is the point index. This ensures the shape grows proportionally based on the golden ratio.
Angle Calculation: The angular position of each point is calculated as:
𝜃
=
𝑖
⋅
Δ
𝜃
+
rotation
⋅
bar_index
100
θ=i⋅Δθ+rotation⋅
100
bar_index
where
Δ
𝜃
=
2
𝜋
num_points
Δθ=
num_points
2π
. This generates evenly spaced points along a circle, with dynamic rotation.
Coordinates: Cartesian coordinates
(
𝑥
,
𝑦
)
(x,y) for each point are derived using:
𝑥
=
𝑟
⋅
cos
(
𝜃
)
,
𝑦
=
𝑟
⋅
sin
(
𝜃
)
x=r⋅cos(θ),y=r⋅sin(θ)
These coordinates describe a polar-to-Cartesian transformation.
4. Dynamic Line Drawing
Connecting Points: For each pair of consecutive points, a line is drawn using:
line.new
(
𝑥
1
,
𝑦
1
,
𝑥
2
,
𝑦
2
)
line.new(x
1
,y
1
,x
2
,y
2
)
The coordinates are adjusted by:
bar_index: Aligns the x-axis to the chart’s time-based bar index.
int() Conversion: Ensures x-coordinates are integers, as required by line.new.
Line Properties:
Color: Set by the user.
Width: Fixed at 1 for simplicity.
5. Real-Time Adaptation
The shapes evolve dynamically as new bars form:
Rotation Over Time: The rotation parameter modifies angles proportionally to bar_index, creating a rotating effect.
Bar Index Alignment: Shapes are positioned relative to the current bar on the chart, ensuring synchronization with market data.
6. Visualization and Applications
This script generates evolving geometrical shapes, which have both aesthetic and educational value. Potential applications include:
Mathematical Visualization: Demonstrating the interplay of Fibonacci sequences, trigonometry, and geometry.
Technical Analysis: Serving as a visual overlay for price movement patterns, highlighting cyclical or wave-like behavior.
Dynamic Art: Creating visually appealing and evolving patterns on financial charts.
Scientific Relevance
This code synthesizes principles from:
Mathematical Analysis: Incorporates constants and formulas central to calculus, trigonometry, and algebra.
Geometry: Visualizes patterns derived from polar coordinates and Fibonacci scaling.
Real-Time Systems: Adapts dynamically to market data, showcasing practical applications of mathematics in financial visualization.
If further optimization or additional functionality is required, let me know! 😊

Renko Periodic Spiral of Archimedes-Secret Geometry - AYNETHow It Works
Dynamic Center:
The spiral is centered on the close price of the chart, with an optional vertical offset (center_y_offset).
Spiral Construction:
The spiral is drawn using segments_per_turn to divide each turn into small line segments.
spacing determines the radial distance between successive turns.
num_turns controls how many full rotations the spiral will have.
Line Drawing:
Each segment is computed using trigonometric functions (cos and sin) to calculate its endpoints.
These segments are drawn sequentially to form the spiral.
Inputs
Center Y Offset: Adjusts the vertical position of the spiral relative to the close price.
Number of Spiral Turns: Total number of full rotations in the spiral.
Spacing Between Turns: Distance between consecutive turns.
Segments Per Turn: Number of segments used to create each turn (higher values make the spiral smoother).
Line Color: Customize the color of the spiral lines.
Line Width: Adjust the thickness of the spiral lines.
Example
If num_turns = 5, spacing = 2, and segments_per_turn = 100:
The spiral will have 5 turns, with a radial distance of 2 between each turn, divided into 100 segments per turn.
Let me know if you have further requests or adjustments to the visualization!
CCI Threshold StrategyThe CCI Threshold Strategy is a trading approach that utilizes the Commodity Channel Index (CCI) as a momentum indicator to identify potential buy and sell signals in financial markets. The CCI is particularly effective in detecting overbought and oversold conditions, providing traders with insights into possible price reversals. This strategy is designed for use in various financial instruments, including stocks, commodities, and forex, and aims to capitalize on price movements driven by market sentiment.
Commodity Channel Index (CCI)
The CCI was developed by Donald Lambert in the 1980s and is primarily used to measure the deviation of a security's price from its average price over a specified period.
The formula for CCI is as follows:
CCI=(TypicalPrice−SMA)×0.015MeanDeviation
CCI=MeanDeviation(TypicalPrice−SMA)×0.015
where:
Typical Price = (High + Low + Close) / 3
SMA = Simple Moving Average of the Typical Price
Mean Deviation = Average of the absolute deviations from the SMA
The CCI oscillates around a zero line, with values above +100 indicating overbought conditions and values below -100 indicating oversold conditions (Lambert, 1980).
Strategy Logic
The CCI Threshold Strategy operates on the following principles:
Input Parameters:
Lookback Period: The number of periods used to calculate the CCI. A common choice is 9, as it balances responsiveness and noise.
Buy Threshold: Typically set at -90, indicating a potential oversold condition where a price reversal is likely.
Stop Loss and Take Profit: The strategy allows for risk management through customizable stop loss and take profit points.
Entry Conditions:
A long position is initiated when the CCI falls below the buy threshold of -90, indicating potential oversold levels. This condition suggests that the asset may be undervalued and due for a price increase.
Exit Conditions:
The long position is closed when the closing price exceeds the highest price of the previous day, indicating a bullish reversal. Additionally, if the stop loss or take profit thresholds are hit, the position will be exited accordingly.
Risk Management:
The strategy incorporates optional stop loss and take profit mechanisms, which can be toggled on or off based on trader preference. This allows for flexibility in risk management, aligning with individual risk tolerances and trading styles.
Benefits of the CCI Threshold Strategy
Flexibility: The CCI Threshold Strategy can be applied across different asset classes, making it versatile for various market conditions.
Objective Signals: The use of quantitative thresholds for entry and exit reduces emotional bias in trading decisions (Tversky & Kahneman, 1974).
Enhanced Risk Management: By allowing traders to set stop loss and take profit levels, the strategy aids in preserving capital and managing risk effectively.
Limitations
Market Noise: The CCI can produce false signals, especially in highly volatile markets, leading to potential losses (Bollinger, 2001).
Lagging Indicator: As a lagging indicator, the CCI may not always capture rapid market movements, resulting in missed opportunities (Pring, 2002).
Conclusion
The CCI Threshold Strategy offers a systematic approach to trading based on well-established momentum principles. By focusing on overbought and oversold conditions, traders can make informed decisions while managing risk effectively. As with any trading strategy, it is crucial to backtest the approach and adapt it to individual trading styles and market conditions.
References
Bollinger, J. (2001). Bollinger on Bollinger Bands. New York: McGraw-Hill.
Lambert, D. (1980). Commodity Channel Index. Technical Analysis of Stocks & Commodities, 2, 3-5.
Pring, M. J. (2002). Technical Analysis Explained. New York: McGraw-Hill.
Tversky, A., & Kahneman, D. (1974). Judgment under uncertainty: Heuristics and biases. Science, 185(4157), 1124-1131.

Delta Volume-ATR ChangeDelta Volume-ATR Change Indicator
The Delta Volume-ATR Change Indicator is designed to analyze the effectiveness of volume in relation to price volatility by comparing the percentage change in volume with the percentage change in ATR over the last two bars. This indicator provides insights into how volume changes impact price movement, allowing traders to gauge the strength or weakness of market momentum based on volume efficiency.
Formula:
% Volume Change = (Volume - Volume ) / Volume * 100
% ATR Change = (ATR - ATR ) / ATR * 100
Delta = % Volume Change - % ATR Change
The result, Delta, shows the difference between the volume change and ATR change, with positive delta indicating a stronger volume impact and negative delta suggesting weaker volume support relative to price movement.
Features:
Multiple Display Styles: Choose from three visualization styles — Histogram, Line, or Columns — to display delta values in a way that best fits your analysis style.
Delta Smoothing: The smoothed Delta line (using an SMA with customizable length) provides a clearer trend of volume efficiency over time.
Color Coding: Delta bars change color based on direction — green for positive values and red for negative, allowing for quick visual assessment of volume effectiveness.
Applications:
Identify market conditions where high volume is driving price effectively (positive Delta).
Detect instances of low volume efficiency, where price changes may not be fully supported by volume (negative Delta).
Useful for short-term and swing traders looking to understand volume patterns in relation to volatility.
This indicator is a valuable tool for traders seeking to gain insights into volume and volatility interplay, helping improve timing and reliability in market entries and exits.

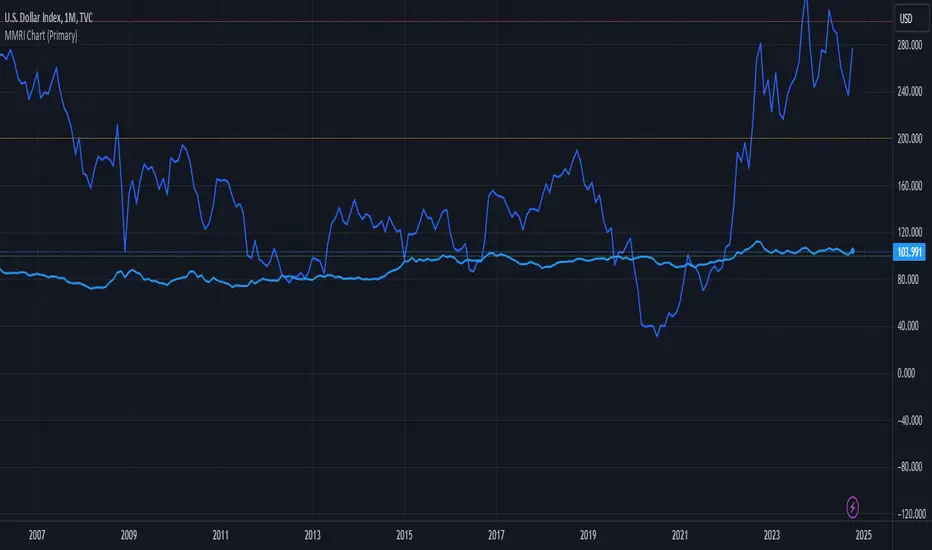
MMRI Chart (Primary)The **Mannarino Market Risk Indicator (MMRI)** is a financial risk measurement tool created by financial strategist Gregory Mannarino. It’s designed to assess the risk level in the stock market and economy based on current bond market conditions and the strength of the U.S. dollar. The MMRI considers factors like the U.S. 10-Year Treasury Yield and the Dollar Index (DXY), which indicate investor confidence in government debt and the dollar's purchasing power, respectively.
The formula for MMRI uses the 10-Year Treasury Yield multiplied by the Dollar Index, divided by a constant (1.61) to normalize the risk measure. A higher MMRI score suggests increased market risk, while a lower score indicates more stability. Mannarino has set certain thresholds to interpret the MMRI score:
- **Below 100**: Low risk.
- **100–200**: Moderate risk.
- **200–300**: High risk.
- **Above 300**: Extreme risk, indicating market instability and potential downturns.
This tool aims to provide insight into economic conditions that may affect asset classes like stocks, bonds, and precious metals. Mannarino often updates MMRI scores and risk analyses in his public market updates.
Relative Measured Volatility (RMV) – Spot Tight Entry ZonesTitle: Relative Measured Volatility (RMV) – Spot Tight Entry Zones
Introduction
The Relative Measured Volatility (RMV) indicator is designed to highlight tight price consolidation zones , making it an ideal tool for traders seeking optimal entry points before potential breakouts. By focusing on tightness rather than general volatility, RMV offers traders a practical way to detect consolidation phases that often precede significant market moves.
How RMV Works
The RMV calculates short-term tightness by averaging three ATR (Average True Range) values over different lookback periods and then normalizing them within a specified lookback window. The result is a percentage-based scale from 0 to 100, indicating how tight the current price range is compared to recent history.
Here’s the breakdown:
Three ATR values are computed using user-defined short lookback periods to represent short-term price movements. An average of the ATRs provides a smoothed measure of current tightness. The RMV normalizes this average against the highest and lowest values over the defined lookback period, scaling it from 0 to 100.
This approach helps traders identify consolidation zones that are more likely to lead to breakouts.
Key Features of RMV
Multi-Period ATR Calculation : Uses three ATR values to effectively capture market tightness over the short term. Normalization : Converts the tightness measure to a 0-100 scale for easy interpretation. Dynamic Histogram and Background Colors : The RMV indicator uses a color-coded system for clarity.
How to Use the RMV Indicator
Identify Tight Consolidation Zones:
a - RMV values between 0-10 indicate very tight price ranges, making this the most optimal zone for potential entries before breakouts.
b - RMV values between 11-20 suggest moderate tightness, still favorable for entries.
Monitor Potential Breakout Areas:
As RMV moves from 21-30 , tightness reduces, signaling expanding volatility that may require wider stops or more flexible entry strategies.
Adjust Trading Strategies:
Use RMV values to identify tight zones for entering trades, especially in trending markets or at key support/resistance levels.
Customize the Indicator:
a - Adjust the short-term ATR lookback periods to control sensitivity.
b - Modify the lookback period to match your trading horizon, whether short-term or long-term.
Color-Coding Guide for RMV
ibb.co
How to Add RMV to Your Chart
Open your chart on TradingView.
Go to the “Indicators” section.
Search for "Relative Measured Volatility (RMV)" in the Community Scripts section.
Click on the indicator to add it to your chart.
Customize the input parameters to fit your trading strategy.
Input Parameters
Lookback Period : Defines the period over which tightness is measured and normalized.
Short-term ATR Lookbacks (1, 2, 3) : Control sensitivity to short-term tightness.
Histogram Threshold : Sets the threshold for differentiating between bright (tight) and dim (less tight) histogram colors.
Conclusion
The Relative Measured Volatility (RMV) is a versatile tool designed to help traders identify tight entry zones by focusing on market consolidation. By highlighting narrow price ranges, the RMV guides traders toward potential breakout setups while providing clear visual cues for better decision-making. Add RMV to your trading toolkit today and enhance your ability to identify optimal entry points!

Harmony Signal Flow By ArunThis Pine Script strategy, titled "Harmony Signal Flow By Arun," uses the Relative Strength Index (RSI) indicator to generate buy and sell signals based on custom thresholds. The script incorporates stop-loss and target management and restricts new trades until the previous position closes. Here's a detailed description:
Custom RSI Metric:
The strategy calculates a 5-period RSI based on the closing price, aiming for a more responsive measure of price momentum.
RSI thresholds are defined:
Lower threshold (30): Indicates oversold conditions, triggering a potential buy.
Upper threshold (70): Indicates overbought conditions, prompting a possible sell.
Entry Conditions:
Buy Signal: The strategy initiates a buy order when the RSI crosses above the lower threshold (30), indicating a shift from oversold conditions.
Sell Signal: A sell order is triggered when the RSI crosses below the upper threshold (70), suggesting an overbought reversal.
Only one order (buy or sell) can be active at a time, ensuring that a new trade begins only when there’s no existing position.
Stop-Loss and Target Management:
For each trade, stop-loss and target conditions are applied to manage risk and secure profits.
For Buy Positions:
Stop-loss is set 100 points below the entry price.
Target is set 150 points above the entry price.
For Sell Positions:
Stop-loss is set 100 points above the entry price.
Target is 150 points below the entry price.
The strategy closes the trade when either the stop-loss or target is met, marking the trade as "closed" and allowing a new trade entry.
Trade Sequencing:
A new trade (buy or sell) is only permitted after the previous position hits either its stop-loss or target, preventing overlapping trades and ensuring clear trade sequences.
This sequential approach enhances risk management by ensuring only one active position at any time.
End-of-Day Closure:
All open positions are closed automatically at 3:25 PM (Indian market time) to avoid overnight exposure, ensuring the strategy remains strictly intraday.
The flag for trade entry is reset at the end of each day, enabling fresh trades the next day.
Chart Indicators:
The script plots buy and sell signals directly on the chart with visible labels.
It also displays the custom RSI metric with horizontal lines for the lower and upper thresholds, providing visual cues for entry and exit points.
Summary
This strategy is a momentum-based intraday trading approach that uses the RSI for identifying potential reversals and manages trades through predefined stop-loss and target levels. By enforcing trade sequencing and closing positions at the end of the trading day, it prioritizes risk management and seeks to capitalize on short-term trends while avoiding overnight market risks.

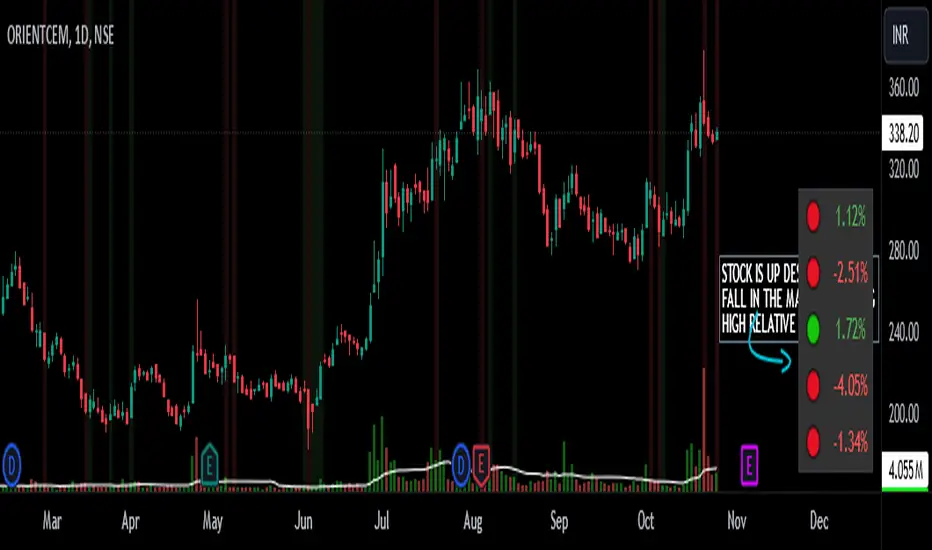
INDIA/NIFTY DOWN DAY MARKERINDIA/NIFTY DOWN DAY MARKER is indicator designed for Indian investors that provides visual cues on whole universe of stock charts marking volatile days based on the performance of selected Indian market indices. This indicator helps traders and investors assess the relative strength of individual stocks during extreme market movements
Key Features:
1) Index Selection: Users can choose from four major Indian indices: Nifty 50, Nifty Midcap 100, Nifty Smallcap 100, and Nifty MIDSMALLCAP 400. This flexibility allows for tailored analysis based on market focus.
2) Customizable Thresholds: Users can set their desired percentage thresholds for both rise and fall days, with default values of 2%. This customization enables users to adapt the indicator to their trading strategies.
3) Visual Indicators:
Rise Days: When the selected index rises by the specified percentage, the chart background turns green, indicating a bullish trend.
Fall Days: Conversely, if the index falls by the defined percentage, the background changes to red, signaling a bearish trend.
Enhanced CCI with Trend FiltersThis indicator combines the power of the Commodity Channel Index (CCI) with adaptive trend filters and divergence detection to identify high-probability trading opportunities. It's designed to reduce false signals by incorporating trend direction and divergence confirmation.
🔍 How It Works:
1. Trend Detection:
- Uses an adaptive Simple Moving Average (SMA) that automatically adjusts between daily and weekly timeframes
- Daily mode: Default 200 SMA for longer-term trend
- Weekly mode: Default 40 SMA for broader market perspective
- Trend direction is determined by comparing current SMA value to its previous value
2. CCI Component:
- Traditional CCI calculation with customizable length (default: 20)
- Adjustable overbought (default: +100) and oversold (default: -100) levels
- Color-coded CCI line for quick visual reference:
* Green: Overbought and rising
* Red: Oversold and falling
* Gray: Neutral zone
3. Signal Generation:
- Buy Signal (Green Background):
* CCI crosses above oversold level AND
* Main trend is confirmed bullish (rising SMA)
- Sell Signal (Red Background):
* CCI crosses below overbought level AND
* Main trend is confirmed bearish (falling SMA)
4. Divergence Detection:
- Automatically identifies bullish and bearish divergences
- Bullish Divergence: Price makes lower low while CCI makes higher low
- Bearish Divergence: Price makes higher high while CCI makes lower high
- Visualized with distinct markers on the CCI line
- Can be used to set up alerts for divergence confirmations
⚙️ Customization Options:
- CCI calculation length and price source
- Overbought/Oversold levels
- SMA lengths for daily and weekly modes
- Divergence lookback period
- Signal colors and visualization settings
🔔 Alert Capabilities:
- Set alerts for CCI crossovers of overbought/oversold levels
- Create divergence detection alerts
- Configure trend change notifications
- Combine multiple conditions for complex alert strategies
💡 Trading Tips:
- Combine divergence signals with trend direction for better accuracy
- Wait for signal confirmation before entering trades
- Use additional indicators or price action for exit decisions
This indicator helps traders identify potential trend reversals while keeping them aligned with the main market trend. Perfect for both trend following and counter-trend strategies when used appropriately.
Tags: CCI, trend following, divergence, momentum, signals, SMA, multi-timeframe, technical analysis, trend filter, oversold, overbought
Note: Past performance does not guarantee future results. Always combine with proper risk management.

WillStop Pro [tradeviZion]WillStop Pro : A Step-by-Step Guide for Beginners to Master Trend Trading
Welcome to an in-depth guide to the WillStop Pro indicator. This article will walk you through the key features, how to use them effectively, and how this tool can help you navigate the markets confidently. WillStop Pro is based on principles established by Larry Williams, a well-known figure in trading, and aims to help you manage trades more effectively without overcomplicating things.
This guide will help you understand the basics of the WillStop Pro indicator, how to interpret its signals, and how to use it step-by-step to manage risk and identify opportunities in your trading journey. We will also cover the underlying logic and calculations for advanced users interested in more details.
What is the WillStop Pro Indicator?
The WillStop Pro indicator is a user-friendly tool that helps traders establish stop levels dynamically. It helps you figure out optimal points to enter or exit trades, while managing risk effectively during changing market conditions. The indicator tracks trending markets and sets price levels as stops for ongoing trades, making it suitable both for deciding when to enter and exit trades.
The indicator is beginner-friendly because it simplifies complex calculations and presents the results visually. This allows traders to focus more on their decision-making process instead of spending time with complex analysis.
WillStop Pro adapts to different market conditions, whether you're trading stocks, forex, commodities, or cryptocurrencies. It adjusts stop levels dynamically based on current market momentum, providing a practical way to manage both risk and reward.
Another significant benefit of WillStop Pro is that it works well with other indicators. Beginners can use it on its own or combine it with other tools like moving averages or oscillators to form a comprehensive trading strategy. Whether you are trading daily or looking at longer-term trends, WillStop Pro helps you manage your trades effectively.
Key Features of WillStop Pro
Dynamic Stop Levels : WillStop Pro calculates real-time stop levels for both long (buy) and short (sell) positions. This helps you protect your profits and reduce risk. The stop levels adjust based on the current market environment, making them more adaptable compared to fixed stop levels.
Advanced Stop Settings : There are optional settings to make the stop calculations more advanced, which take into consideration previous price movements to refine where the stops should be placed. These settings provide more precise control over your trades.
Break Signals and Alerts : The indicator provides visual signals, like arrows, to show when a stop level has been broken. This makes it easier for you to identify possible reversals and understand when the market direction is changing.
Comprehensive Table Display : A small table on the chart shows the current trend, the stop level, and whether advanced mode is active. This simple display provides an overview of the market, making decision-making easier.
Based on Larry Williams' Methodology : WillStop Pro builds upon Larry Williams' ideas, which are designed to capture major market trends while managing risk effectively. It provides a systematic way to follow these strategies without requiring deep technical analysis skills.
How Are Stop Levels Calculated? (For Advanced Users)
The WillStop Pro indicator determines stop levels by evaluating highs, lows, and closing prices over a specific lookback period. It uses this information to identify key points that justify adjusting your stop level, and there are separate approaches for both long and short positions.
Below, we explain the mathematical logic behind the stop calculations, along with some code snippets to give advanced users a clearer understanding.
For Long Stops (buy positions): The indicator looks for the highest closing price within the lookback period and continues until it finds three valid bars that meet certain criteria. Stops are adjusted to skip bars that have consecutive upward closes to ensure that the stop is placed at a level that offers solid support. Specifically, the function iterates over recent bars to determine the highest closing value, and checks for specific conditions before finalizing the stop level. Here is an excerpt of the relevant code:
getTrueLow(idx) => math.min(low , close )
findStopLevels() =>
float highestClose = close
int highestCloseIndex = 0
for i = 0 to lookback
if close > highestClose
highestClose := close
highestCloseIndex := i
// Logic to adjust based on up close skipping
int longCount = 0
int longCurrentIndex = highestCloseIndex
while longCount < 3 and longCurrentIndex < 100
if not isInsideBar(longCurrentIndex)
longCount += 1
longCurrentIndex += 1
// Determine the lowest low for the stop level
float longStopLevel = high * 2
for i = searchIndex to highestCloseIndex
longStopLevel := math.min(longStopLevel, getTrueLow(i))
// Apply offset
longStopLevel := longStopLevel - (offsetTicks * tickSize)
In this code snippet, the function findStopLevels() calculates the long stop level by first identifying the highest close within the lookback period and then finding a suitable support level while skipping certain conditions, such as inside bars or consecutive upward closes. Finally, the user-defined offset ( offsetTicks ) is applied to determine the stop level.
For Short Stops (sell positions): Similarly, the indicator finds the lowest closing price within the lookback period and then identifies three bars that fit the conditions for a short stop. It avoids using bars with consecutive down closes to help find a more robust resistance level. Here's a relevant code snippet:
getTrueHigh(idx) => math.max(high , close )
findStopLevels() =>
float lowestClose = close
int lowestCloseIndex = 0
for i = 0 to lookback
if close < lowestClose
lowestClose := close
lowestCloseIndex := i
// Logic to adjust based on down close skipping
int shortCount = 0
int shortCurrentIndex = lowestCloseIndex
while shortCount < 3 and shortCurrentIndex < 100
if not isInsideBar(shortCurrentIndex)
shortCount += 1
shortCurrentIndex += 1
// Determine the highest high for the stop level
float shortStopLevel = 0
for i = searchIndex to lowestCloseIndex
shortStopLevel := math.max(shortStopLevel, getTrueHigh(i))
// Apply offset
shortStopLevel := shortStopLevel + (offsetTicks * tickSize)
Here, findStopLevels() calculates the short stop level by finding the lowest closing price within the lookback period. It then determines the highest value that acts as a resistance level, excluding bars that do not fit certain criteria.
Volume Confirmation for Alert Accuracy : To further enhance the stop level accuracy, volume is used as a confirmation filter. The average volume (volAvg) is calculated over a 20-period moving average, and alerts are only generated if the volume exceeds a defined threshold (volMultiplier). This ensures that price movements are significant enough to consider as meaningful signals.
volAvg = ta.sma(volume, 20)
isVolumeConfirmed() =>
result = requireVolumeConfirmation ? volume > (volAvg * volMultiplier) : true
result
This additional logic ensures that stop level breaks or adjustments are not triggered during periods of low trading activity, thus enhancing the reliability of the generated signals.
These calculations are at the core of WillStop Pro's ability to determine dynamic stop levels that respond effectively to market movements, helping traders manage risk by placing stops at levels that make sense given historical price and volume data.
How to Identify Opportunities with WillStop Pro
WillStop Pro provides various signals that help you decide when to enter or exit a trade:
When a Stop Level is Broken: If a stop level (support for long positions or resistance for short positions) is broken, it may indicate a reversal. WillStop Pro visually plots arrows whenever a stop level is breached, making it easy for you to see where changes might occur. This feature helps traders identify momentum shifts quickly.
Support and Resistance Levels: The indicator plots support and resistance levels, which show key zones to watch for opportunities. These levels often act as psychological barriers in the market, where price action may either reverse or stall temporarily.
Dynamic State Management: The indicator shifts between long and short states based on price action, providing real-time feedback. This helps traders stick to their trading plan without second-guessing the market.
A major advantage of WillStop Pro is that it responds well to changing market conditions. By identifying when key support or resistance levels break, it allows you to adjust your strategies and react to new opportunities accordingly. Whether the market is trending strongly or staying within a range, WillStop Pro provides valuable information to help guide your trades.
Setting Up Alerts
Alerts are an important feature in trading, especially when you can’t be in front of your charts all the time. WillStop Pro has been enhanced to include flexible alert settings to help you stay on top of your trades without constantly monitoring the charts.
Enable Alerts: There is a master switch to enable or disable all alerts. This way, you can control whether you want to be notified of events at any time.
Alert Frequency: Choose between receiving alerts Once Per Bar or Once Per Bar Close . This helps you manage the frequency of alerts and decide if you need real-time updates or want confirmation after a bar closes.
Break Alerts: These alerts notify you when a stop level has been broken. This can help you catch potential reversals or trading opportunities as soon as they happen.
Strong Break Alerts: Alerts are available for strong breaks, which occur when the price breaks stop levels with confirmation based on additional price, volume, and momentum criteria. These alerts help identify significant shifts in the market.
Level Change Alerts: These alerts tell you whenever a new stop level is calculated, keeping you updated about changes in market dynamics. You can set a Minimum Level Change % to ensure that alerts are only triggered when the stop level changes significantly.
Require Volume Confirmation: You can opt to receive alerts only if the volume is above a certain threshold. This confirmation helps reduce false signals by ensuring that significant price changes are backed by increased trading activity.
Volume Multiplier: The volume multiplier allows you to set a minimum volume requirement that must be met for an alert to trigger. This ensures that alerts are triggered only when there is sufficient trading interest.
Here is a part of the updated alert logic that has been implemented in the indicator:
// Alert on break conditions
if alertsEnabled
if alertOnBreaks
if longStopBroken and isVolumeConfirmed()
alert(createAlertMessage("Support Break - Short Signal", useAdvancedStops), alertFreq)
if shortStopBroken and isVolumeConfirmed()
alert(createAlertMessage("Resistance Break - Long Signal", useAdvancedStops), alertFreq)
// Strong break alerts
if alertOnStrongBreaks
if longStopBroken and isStrongBreak(false)
alert(createAlertMessage("Strong Support Break - Short Signal", useAdvancedStops), alertFreq)
if shortStopBroken and isStrongBreak(true)
alert(createAlertMessage("Strong Resistance Break - Long Signal", useAdvancedStops), alertFreq)
// Level change alerts
if alertOnLevelChanges and isSignificantChange() and isVolumeConfirmed()
alert(createAlertMessage("Significant Level Change", useAdvancedStops), alertFreq)
Setting alerts allows you to react to market changes without having to watch the charts constantly. Alerts are particularly helpful if you have other responsibilities and can’t be actively monitoring your trades all day.
Understanding the Table Display
The WillStop Pro indicator provides a status table that gives an overview of the current market state. Here’s what the table shows:
Indicator Status: The table indicates whether the indicator is in a LONG or SHORT state. This helps you quickly understand the market trend.
Stop Level: The active stop level is shown, whether it is acting as support (long) or resistance (short). This is important for knowing where to set your protective stops.
Mode: The table also displays whether the advanced calculation mode is being used. This keeps you informed about how stop levels are being calculated and why they are positioned where they are.
Empowering Messages: The table also includes motivational messages that rotate periodically, such as 'Trade with Clarity, Stop with Precision' and 'Let Winners Run, Cut Losses Short.' These messages are designed to keep you focused, motivated, and disciplined during your trading journey.
The table is simple and easy to follow, helping you maintain discipline in your trading plan. By having all the essential information in one place, the table reduces the need to make quick, emotional decisions and promotes more thoughtful analysis.
Tips for Using WillStop Pro Effectively
Here are some practical ways to make the most of the WillStop Pro indicator:
Start with Default Settings: If you’re new to the indicator, start with the default settings. This will give you an idea of how stop levels are determined and how they adjust to different markets.
Experiment with Advanced Settings: Once you are comfortable, try using the advanced stop settings to see how they refine the stop levels. This can be useful in certain market conditions to improve accuracy.
Use Alerts to Stay Updated: Set up alerts for when a stop level is broken or when new levels are calculated. This helps you take action without constantly watching the chart. Swing traders may find alerts especially helpful for monitoring longer-term moves.
Monitor the Status Table: Keep an eye on the status table to understand the current market condition. Whether the indicator is in a LONG or SHORT state can help you make more informed decisions.
Focus on Risk Management: WillStop Pro is designed to help you manage risk by dynamically adjusting stop levels. Make sure you are using these levels to protect your trades, especially during strong trends or volatile periods.
Acknowledging Larry Williams' Influence
WillStop Pro is inspired by the work of Larry Williams, who described the approach as one of his best trading techniques. His method aims to ride major market trends while reducing the risk of giving back gains during corrections. WillStop Pro builds upon this approach, adding features like advanced stop settings and visual alerts that make it easier to apply in modern markets.
By using WillStop Pro, you are essentially leveraging a well-established trading strategy with additional tools that help improve its effectiveness. The indicator is designed to provide a reliable way to manage trades, stay on top of market conditions, and reduce emotional decision-making.
Conclusion: Why WillStop Pro is Great for Beginners and Advanced Users
The WillStop Pro is a powerful yet easy-to-use tool that helps traders ride trends while managing risk during market corrections. It can be used both for entering and exiting trades, and its visual features make it accessible for those who are new to trading, while the underlying logic appeals to advanced users seeking greater control and understanding.
WillStop Pro is more than just a tool for setting stops. It is a comprehensive solution for managing trades, with features like dynamic stop levels, customizable alerts, and an easy-to-understand status table. This combination of simplicity and advanced features makes it suitable for beginners as well as more experienced traders.
We hope this guide helps you get started with WillStop Pro and improves your trading confidence. Remember to start with the basics, explore the advanced features, and set alerts to stay informed without getting overwhelmed. Whether you’re just beginning or want to simplify your strategy, WillStop Pro is a valuable tool to have in your trading arsenal.
Trading can be challenging, but the right tools make it more manageable. WillStop Pro helps you keep track of market movements, identify opportunities, and manage risk effectively. Give it a try and see how it can improve your trading decisions and help you navigate the markets more efficiently.
By incorporating WillStop Pro into your strategy, you are following a systematic approach that has been refined over time. It’s designed to help you make sense of the markets, plan your trades, and manage your risks with greater clarity and confidence.
Note: Always practice proper risk management and thoroughly test the indicator to ensure it aligns with your trading strategy. Past performance is not indicative of future results.
Trade smarter with TradeVizion—unlock your trading potential today!

AndreundCristianIndicator Overview:
The "Trade Signals with Volume" indicator is a custom script that generates buy and sell signals based on the crossover of two moving averages (a fast one and a slow one) and adds a volume filter to validate these signals. It plots these signals directly on the chart, using arrows or labels to indicate where buy and sell signals occur.
Key Features:
Moving Averages (MA):
The indicator uses two Simple Moving Averages (SMA): a fast SMA and a slow SMA.
A buy signal is triggered when the fast MA crosses above the slow MA, signaling potential bullish momentum.
A sell signal is triggered when the fast MA crosses below the slow MA, indicating potential bearish momentum.
Volume Filter:
To ensure that signals are more reliable, the indicator only triggers a buy or sell signal if the volume is above a certain threshold. This threshold can be adjusted by the user in the input settings.
For example, if the volume exceeds 100,000 (or any set value), and a crossover occurs, the signal is validated.
Visual Representation:
Buy signals are represented with green labels or arrows below the price bars.
Sell signals are represented with red labels or arrows above the price bars.
The MAs are also plotted on the chart for visual reference.
Input Parameters:
Fast Moving Average Length: The number of periods for the fast SMA (default is 9 periods).
Slow Moving Average Length: The number of periods for the slow SMA (default is 21 periods).
Volume Threshold: The minimum volume required to validate a buy or sell signal (default is 100,000).
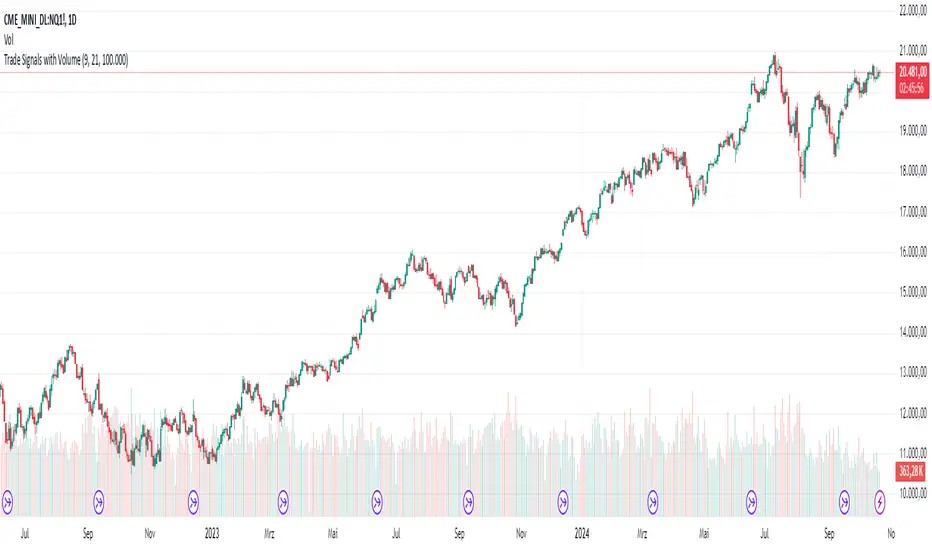
Financial Crisis Predictor - Doomsday ClockThe **Financial Crisis Predictor - Doomsday Clock** is a composite indicator that evaluates multiple market conditions to determine financial risk levels. It combines four key metrics: market volatility (via VIX), yield curve spread, stock market momentum, and credit risk (via high-yield spread). Each metric contributes to a weighted "risk score," scaled between 0 and 100, which helps gauge the probability of a financial crisis. Here's a breakdown of how it works:
### 1. **Market Volatility (VIX)**
- **How it's measured:**
- Uses the VIX index, which represents expected market volatility.
- Applies two exponential moving averages (EMAs) to smooth out the data—one fast and one slow.
- Triggers a signal if the fast EMA crosses above the slow EMA and VIX exceeds a defined threshold (default is 30).
- **Weighting:**
- Contributes up to 35% of the total risk score when active.
### 2. **Yield Curve Spread**
- **How it's measured:**
- Takes the difference between the yields of 10-year and 2-year U.S. Treasury bonds (inversion indicates recession risk).
- If the spread drops below a certain threshold (default is 0.2), it signals a potential recession.
- **Weighting:**
- Contributes up to 25% of the risk score.
### 3. **Stock Market Momentum**
- **How it's measured:**
- Analyzes the S&P 500 (SPY) using a 20-day EMA for price momentum.
- Checks for a cross under the 20-day EMA and if the 5-day rate of change (ROC) is less than -2.
- This combination signals bearish market momentum.
- **Weighting:**
- Contributes up to 20% of the risk score.
### 4. **Credit Risk (High Yield Spread)**
- **How it's measured:**
- Assesses high-yield corporate bond spreads using EMAs, similar to the VIX logic.
- A crossover of the fast EMA above the slow EMA combined with spreads exceeding a defined threshold (default is 5.0) indicates increased credit risk.
- **Weighting:**
- Contributes up to 20% of the total risk score.
### 5. **Risk Score Calculation**
- The final **risk score** ranges from 0 to 100 and is calculated using the weighted sum of the four indicators.
- The score is smoothed to minimize false signals and maintain stability.
### 6. **Risk Zones**
- **Extreme Risk:** If the risk score is ≥ 75, indicating a severe crisis warning.
- **High Risk:** If the risk score is between 15 and 75, signaling heightened risk.
- **Moderate Risk:** If the risk score is between 10 and 15, representing potential concerns.
- **Low Risk:** If the risk score is < 10, suggesting stable conditions.
### 7. **Visual & Alerts**
- The indicator plots the risk score on a chart with color-coded backgrounds to indicate risk levels: green (low), yellow (moderate), orange (high), and red (extreme).
- Alert conditions are set for each risk zone, notifying users when the risk level transitions into a higher zone.
This indicator aims to quickly detect potential financial crises by aggregating signals from key market factors, making it a versatile tool for traders, analysts, and risk managers.
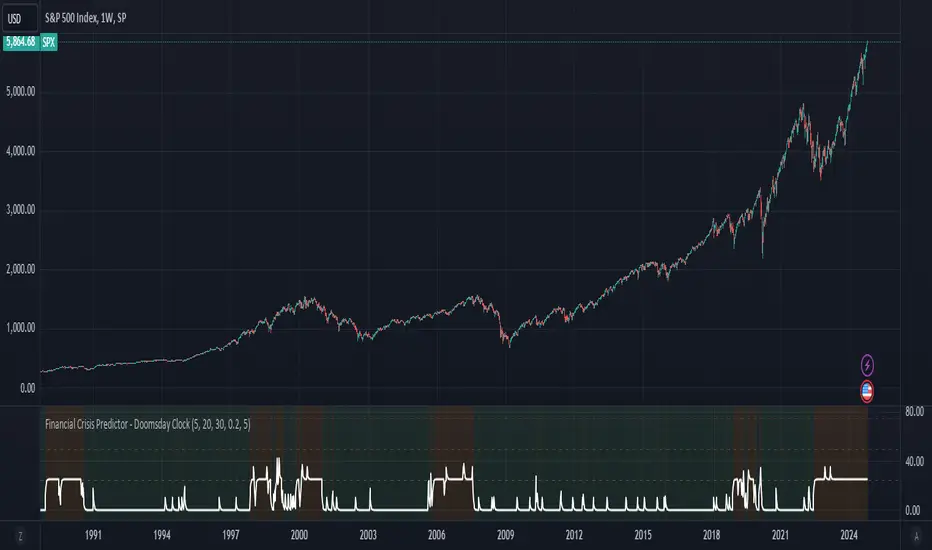
Chande Momentum Oscillator StrategyThe Chande Momentum Oscillator (CMO) Trading Strategy is based on the momentum oscillator developed by Tushar Chande in 1994. The CMO measures the momentum of a security by calculating the difference between the sum of recent gains and losses over a defined period. The indicator offers a means to identify overbought and oversold conditions, making it suitable for developing mean-reversion trading strategies (Chande, 1997).
Strategy Overview:
Calculation of the Chande Momentum Oscillator (CMO):
The CMO formula considers both positive and negative price changes over a defined period (commonly set to 9 days) and computes the net momentum as a percentage.
The formula is as follows:
CMO=100×(Sum of Gains−Sum of Losses)(Sum of Gains+Sum of Losses)
CMO=100×(Sum of Gains+Sum of Losses)(Sum of Gains−Sum of Losses)
This approach distinguishes the CMO from other oscillators like the RSI by using both price gains and losses in the numerator, providing a more symmetrical measurement of momentum (Chande, 1997).
Entry Condition:
The strategy opens a long position when the CMO value falls below -50, signaling an oversold condition where the price may revert to the mean. Research in mean-reversion, such as by Poterba and Summers (1988), supports this approach, highlighting that prices often revert after sharp movements due to overreaction in the markets.
Exit Conditions:
The strategy closes the long position when:
The CMO rises above 50, indicating that the price may have become overbought and may not provide further upside potential.
Alternatively, the position is closed 5 days after the buy signal is triggered, regardless of the CMO value, to ensure a timely exit even if the momentum signal does not reach the predefined level.
This exit strategy aligns with the concept of time-based exits, reducing the risk of prolonged exposure to adverse price movements (Fama, 1970).
Scientific Basis and Rationale:
Momentum and Mean-Reversion:
The strategy leverages the well-known phenomenon of mean-reversion in financial markets. According to research by Jegadeesh and Titman (1993), prices tend to revert to their mean over short periods following strong movements, creating opportunities for traders to profit from temporary deviations.
The CMO captures this mean-reversion behavior by monitoring extreme price conditions. When the CMO reaches oversold levels (below -50), it signals potential buying opportunities, whereas crossing overbought levels (above 50) indicates conditions for selling.
Market Efficiency and Overreaction:
The strategy takes advantage of behavioral inefficiencies and overreactions, which are often the drivers behind sharp price movements (Shiller, 2003). By identifying these extreme conditions with the CMO, the strategy aims to capitalize on the market’s tendency to correct itself when price deviations become too large.
Optimization and Parameter Selection:
The 9-day period used for the CMO calculation is a widely accepted timeframe that balances responsiveness and noise reduction, making it suitable for capturing short-term price fluctuations. Studies in technical analysis suggest that oscillators optimized over such periods are effective in detecting reversals (Murphy, 1999).
Performance and Backtesting:
The strategy's effectiveness is confirmed through backtesting, which shows that using the CMO as a mean-reversion tool yields profitable opportunities. The use of time-based exits alongside momentum-based signals enhances the reliability of the strategy by ensuring that trades are closed even when the momentum signal alone does not materialize.
Conclusion:
The Chande Momentum Oscillator Trading Strategy combines the principles of momentum measurement and mean-reversion to identify and capitalize on short-term price fluctuations. By using a widely tested oscillator like the CMO and integrating a systematic exit approach, the strategy effectively addresses both entry and exit conditions, providing a robust method for trading in diverse market environments.
References:
Chande, T. S. (1997). The New Technical Trader: Boost Your Profit by Plugging into the Latest Indicators. John Wiley & Sons.
Fama, E. F. (1970). Efficient Capital Markets: A Review of Theory and Empirical Work. The Journal of Finance, 25(2), 383-417.
Jegadeesh, N., & Titman, S. (1993). Returns to Buying Winners and Selling Losers: Implications for Stock Market Efficiency. The Journal of Finance, 48(1), 65-91.
Murphy, J. J. (1999). Technical Analysis of the Financial Markets: A Comprehensive Guide to Trading Methods and Applications. New York Institute of Finance.
Poterba, J. M., & Summers, L. H. (1988). Mean Reversion in Stock Prices: Evidence and Implications. Journal of Financial Economics, 22(1), 27-59.
Shiller, R. J. (2003). From Efficient Markets Theory to Behavioral Finance. Journal of Economic Perspectives, 17(1), 83-104.

[3Commas] Signal BuilderSignal Builder is a tool designed to help traders create custom buy and sell signals by combining multiple technical indicators. Its flexibility allows traders to set conditions based on their specific strategy, whether they’re into scalping, swing trading, or long-term investing. Additionally, its integration with 3Commas bots makes it a powerful choice for those looking to automate their trades, though it’s also ideal for traders who prefer receiving alerts and making manual decisions.
🔵 How does Signal Builder work?
Signal Builder allows users to define custom conditions using popular technical indicators, which, when met, generate clear buy or sell signals. These signals can be used to trigger TradingView alerts, ensuring that you never miss a market opportunity. Additionally, all conditions are evaluated using "AND" logic, meaning signals are only activated when all user-defined conditions are met. This increases precision and helps avoid false signals.
🔵 Available indicators and recommended settings:
Signal Builder provides access to a wide range of technical indicators, each customizable to popular settings that maximize effectiveness:
RSI (Relative Strength Index): An oscillator that measures the relative strength of price over a specific period. Traders typically configure it with 14 periods, using levels of 30 (oversold) and 70 (overbought) to identify potential reversals.
MACD (Moving Average Convergence Divergence): A key indicator tracking the crossover between two moving averages. Common settings include 12 and 26 periods for the moving averages, with a 9-period signal line to detect trend changes.
Ultimate Oscillator: Combines three different time frames to offer a comprehensive view of buying and selling pressure. Popular settings are 7, 14, and 28 periods.
Bollinger Bands %B: Provides insight into where the price is relative to its upper and lower bands. Standard settings include a 20-period moving average and a standard deviation of 2.
ADX (Average Directional Index): Measures the strength of a trend. Values above 25 typically indicate a strong trend, while values below suggest weak or sideways movement.
Stochastic Oscillator: A momentum indicator comparing the closing price to its range over a defined period. Popular configurations include 14 periods for %K and 3 for %D smoothing.
Parabolic SAR: Ideal for identifying trend reversals and entry/exit points. Commonly configured with a 0.02 step and a 0.2 maximum.
Money Flow Index (MFI): Similar to RSI but incorporates volume into the calculation. Standard settings use 14 periods, with levels of 20 and 80 as oversold and overbought thresholds.
Commodity Channel Index (CCI): Measures the deviation of price from its average. Traders often use a 20-period setting with levels of +100 and -100 to identify extreme overbought or oversold conditions.
Heikin Ashi Candles: These candles smooth out price fluctuations to show clearer trends. Commonly used in trend-following strategies to filter market noise.
🔵 How to use Signal Builder:
Configure indicators: Select the indicators that best fit your strategy and adjust their settings as needed. You can combine multiple indicators to define precise entry and exit conditions.
Define custom signals: Create buy or sell conditions that trigger when your selected indicators meet the criteria you’ve set. For example, configure a buy signal when RSI crosses above 30 and MACD confirms with a bullish crossover.
TradingView alerts: Set up alerts in TradingView to receive real-time notifications when the conditions you’ve defined are met, allowing you to react quickly to market opportunities without constantly monitoring charts.
Monitor with the panel: Signal Builder includes a visual panel that shows active conditions for each indicator in real time, helping you keep track of signals without manually checking each indicator.
🔵 3Commas integration:
In addition to being a valuable tool for any trader, Signal Builder is optimized to work seamlessly with 3Commas bots through Webhooks. This allows you to automate your trades based on the signals you’ve configured, ensuring that no opportunity is missed when your defined conditions are met. If you prefer automation, Signal Builder can send buy or sell signals to your 3Commas bots, enhancing your trading process and helping you manage multiple trades more efficiently.
🔵 Example of use:
Imagine you trade in volatile markets and want to trigger a sell signal when:
Stochastic Oscillator indicates overbought conditions with the %K value crossing below 80.
Bollinger Bands %B shows the price has surpassed the upper band, suggesting a potential reversal.
ADX is below 20, indicating that the trend is weak and could be about to change.
With Signal Builder , you can configure these conditions to trigger a sell signal only when all are met simultaneously. Then, you can set up a TradingView alert to notify you as soon as the signal is activated, giving you the opportunity to react quickly and adjust your strategy accordingly.
👨🏻💻💭 If this tool helps your trading strategy, don’t forget to give it a boost! Feel free to share in the comments how you're using it or if you have any questions.
_________________________________________________________________
The information and publications within the 3Commas TradingView account are not meant to be and do not constitute financial, investment, trading, or other types of advice or recommendations supplied or endorsed by 3Commas and any of the parties acting on behalf of 3Commas, including its employees, contractors, ambassadors, etc.
