Multi-indicator Signal Builder [Skyrexio]Overview
Multi-Indicator Signal Builder is a versatile, all-in-one script designed to streamline your trading workflow by combining multiple popular technical indicators under a single roof. It features a single-entry, single-exit logic, intrabar stop-loss/take-profit handling, an optional time filter, a visually accessible condition table, and a built-in statistics label. Traders can choose any combination of 12+ indicators (RSI, Ultimate Oscillator, Bollinger %B, Moving Averages, ADX, Stochastic, MACD, PSAR, MFI, CCI, Heikin Ashi, and a “TV Screener” placeholder) to form entry or exit conditions. This script aims to simplify strategy creation and analysis, making it a powerful toolkit for technical traders.
Indicators Overview
1. RSI (Relative Strength Index)
Measures recent price changes to evaluate overbought or oversold conditions on a 0–100 scale.
2. Ultimate Oscillator (UO)
Uses weighted averages of three different timeframes, aiming to confirm price momentum while avoiding false divergences.
3. Bollinger %B
Expresses price relative to Bollinger Bands, indicating whether price is near the upper band (overbought) or lower band (oversold).
4. Moving Average (MA)
Smooths price data over a specified period. The script supports both SMA and EMA to help identify trend direction and potential crossovers.
5. ADX (Average Directional Index)
Gauges the strength of a trend (0–100). Higher ADX signals stronger momentum, while lower ADX indicates a weaker trend.
6. Stochastic
Compares a closing price to a price range over a given period to identify momentum shifts and potential reversals.
7. MACD (Moving Average Convergence/Divergence)
Tracks the difference between two EMAs plus a signal line, commonly used to spot momentum flips through crossovers.
8. PSAR (Parabolic SAR)
Plots a trailing stop-and-reverse dot that moves with the trend. Often used to signal potential reversals when price crosses PSAR.
9. MFI (Money Flow Index)
Similar to RSI but incorporates volume data. A reading above 80 can suggest overbought conditions, while below 20 may indicate oversold.
10. CCI (Commodity Channel Index)
Identifies cyclical trends or overbought/oversold levels by comparing current price to an average price over a set timeframe.
11. Heikin Ashi
A type of candlestick charting that filters out market noise. The script uses a streak-based approach (multiple consecutive bullish or bearish bars) to gauge mini-trends.
12. TV Screener
A placeholder condition designed to integrate external buy/sell logic (like a TradingView “Buy” or “Sell” rating). Users can override or reference external signals if desired.
Unique Features
1. Multi-Indicator Entry and Exit
You can selectively enable any subset of 12+ classic indicators, each with customizable parameters and conditions. A position opens only if all enabled entry conditions are met, and it closes only when all enabled exit conditions are satisfied, helping reduce false triggers.
2. Single-Entry / Single-Exit with Intrabar SL/TP
The script supports a single position at a time. Once a position is open, it monitors intrabar to see if the price hits your stop-loss or take-profit levels before the bar closes, making results more realistic for fast-moving markets.
3. Time Window Filter
Users may specify a start/end date range during which trades are allowed, making it convenient to focus on specific market cycles for backtesting or live trading.
4. Condition Table and Statistics
A table at the bottom of the chart lists all active entry/exit indicators. Upon each closed trade, an integrated statistics label displays net profit, total trades, win/loss count, average and median PnL, etc.
5. Seamless Alerts and Automation
Configure alerts in TradingView using “Any alert() function call.”
The script sends JSON alert messages you can route to your own webhook.
The indicator can be integrated with Skyrexio alert bots to automate execution on major cryptocurrency exchanges
6. Optional MA/PSAR Plots
For added visual clarity, optionally plot the chosen moving averages or PSAR on the chart to confirm signals without stacking multiple indicators.
Methodology
1. Multi-Indicator Entry Logic
When multiple entry indicators are enabled (e.g., RSI + Stochastic + MACD), the script requires all signals to align before generating an entry. Each indicator can be set for crossovers, crossunders, thresholds (above/below), etc. This “AND” logic aims to filter out low-confidence triggers.
2. Single-Entry Intrabar SL/TP
One Position At a Time: Once an entry signal triggers, a trade opens at the bar’s close.
Intrabar Checks: Stop-loss and take-profit levels (if enabled) are monitored on every tick. If either is reached, the position closes immediately, without waiting for the bar to end.
3. Exit Logic
All Conditions Must Agree: If the trade is still open (SL/TP not triggered), then all enabled exit indicators must confirm a closure before the script exits on the bar’s close.
4. Time Filter
Optional Trading Window: You can activate a date/time range to constrain entries and exits strictly to that interval.
Justification of Methodology
Indicator Confluence: Combining multiple tools (RSI, MACD, etc.) can reduce noise and false signals.
Intrabar SL/TP: Capturing real-time spikes or dips provides a more precise reflection of typical live trading scenarios.
Single-Entry Model: Straightforward for both manual and automated tracking (especially important in bridging to bots).
Custom Date Range: Helps refine backtesting for specific market conditions or to avoid known irregular data periods.
How to Use
1. Add the Script to Your Chart
In TradingView, open Indicators , search for “Multi-indicator Signal Builder”.
Click to add it to your chart.
2. Configure Inputs
Time Filter: Set a start and end date for trades.
Alerts Messages: Input any JSON or text payload needed by your external service or bot.
Entry Conditions: Enable and configure any indicators (e.g., RSI, MACD) for a confluence-based entry.
Close Conditions: Enable exit indicators, along with optional SL (negative %) and TP (positive %) levels.
3. Set Up Alerts
In TradingView, select “Create Alert” → Condition = “Any alert() function call” → choose this script.
Entry Alert: Triggers on the script’s entry signal.
Close Alert: Triggers on the script’s close signal (or if SL/TP is hit).
Skyrexio Alert Bots: You can route these alerts via webhook to Skyrexio alert bots to automate order execution on major crypto exchanges (or any other supported broker).
4. Visual Reference
A condition table at the bottom summarizes active signals.
Statistics Label updates automatically as trades are closed, showing PnL stats and distribution metrics.
Backtesting Guidelines
Symbol/Timeframe: Works on multiple assets and timeframes; always do thorough testing.
Realistic Costs: Adjust commissions and potential slippage to match typical exchange conditions.
Risk Management: If using the built-in stop-loss/take-profit, set percentages that reflect your personal risk tolerance.
Longer Test Horizons: Verify performance across diverse market cycles to gauge reliability.
Example of statistic calculation
Test Period: 2023-01-01 to 2025-12-31
Initial Capital: $1,000
Commission: 0.1%, Slippage ~5 ticks
Trade Count: 468 (varies by strategy conditions)
Win rate: 76% (varies by strategy conditions)
Net Profit: +96.17% (varies by strategy conditions)
Disclaimer
This indicator is provided strictly for informational and educational purposes .
It does not constitute financial or trading advice.
Past performance never guarantees future results.
Always test thoroughly in demo environments before using real capital.
Enjoy exploring the Multi-Indicator Signal Builder! Experiment with different indicator combinations and adjust parameters to align with your trading preferences, whether you trade manually or link your alerts to external automation services. Happy trading and stay safe!
"摩根纳斯达克100基金风险大吗" için komut dosyalarını ara

Closing Prices for Indices AMMOthe "Closing Prices for Indices" indicator displays the daily closing prices of four major stock indices: FTSE 100, DAX 40, Dow Jones Industrial Average, and NASDAQ Composite. The indicator updates the prices based on their respective market closing times:
FTSE 100 and DAX 40: Updates at 4:30 PM UK time.
Dow Jones and NASDAQ Composite: Updates at 9:00 PM UK time.
Key features:
Customizable Labels: Option to display labels showing the closing prices directly on the chart.
Color-Coded Lines: Plots each index's closing price using distinct, customizable colors for easy differentiation.
User-Friendly Settings: Includes options for customizing line and label colors.
This indicator is perfect for traders and analysts looking to monitor and compare key index closing prices visually on their charts.

Timeframe-Based Dynamic MA [odnac]
This code is a Timeframe-Based Dynamic MA indicator, written in Pine Script, that dynamically calculates and displays the Simple Moving Average (SMA), Exponential Moving Average (EMA), and Volume Weighted Moving Average (VWMA) based on a 24-hour period, according to the selected timeframe. It automatically adjusts the length of the moving averages for each timeframe, showing the appropriate value optimized for that specific timeframe.
Code Explanation:
Settings:
inputLength: A user input that allows setting the base time (24 hours by default). This value determines the reference for calculating the length of the moving averages according to the timeframe.
transp: A setting for the transparency of the moving average lines. It can accept values from 0 to 100 (0 is opaque, 100 is fully transparent).
Timeframe-Based Moving Average Calculation:
The length variable is dynamically calculated based on the current chart's timeframe.
For shorter timeframes like 1-minute, 2-minute, 3-minute, 5-minute, 10-minute, 15-minute, 30-minute, and 45-minute, the length is calculated by multiplying 60 / selected timeframe to obtain the moving average length based on a 24-hour period.
For longer timeframes like 1 hour, 4 hours, and 1 day, fixed values are used to set the moving average length.
Moving Average Calculation:
sma, ema, vwma: These are the Simple Moving Average, Exponential Moving Average, and Volume Weighted Moving Average calculated based on the length.
else_sma, else_ema, else_vwma: These represent the moving averages fetched from the 1-hour chart. For timeframes that are not calculated directly, the values are taken from the 1-hour chart.
Displaying the Moving Averages:
The moving averages are plotted according to the length calculated for the current timeframe.
If the length for the current timeframe is valid, the corresponding SMA, EMA, and VWMA values are displayed. Otherwise, the values fetched from the 1-hour chart are used.
The moving averages are displayed with the transparency (transp) value set by the user, controlling their opacity on the chart.
How to Use:
Base Time: The user sets a base time. For example, setting inputLength to 24 will calculate the moving average length based on a 24-hour period, which will be dynamically adjusted and displayed according to the selected timeframe.
Transparency Setting: The transparency of the moving average lines can be adjusted using the transp value.
Supported Timeframes:
For shorter timeframes (1-minute, 2-minute, 3-minute, 5-minute, 10-minute, 15-minute, 30-minute, 45-minute), the moving average lengths are dynamically calculated and displayed.
For longer timeframes (1 hour, 4 hours, 1 day), fixed length values are used.
This indicator allows you to dynamically calculate daily moving averages across different timeframes and visually check which moving average is the most appropriate for the selected timeframe.

MTF RSI CandlesThis Pine Script indicator is designed to provide a visual representation of Relative Strength Index (RSI) values across multiple timeframes. It enhances traditional candlestick charts by color-coding candles based on RSI levels, offering a clearer picture of overbought, oversold, and sideways market conditions. Additionally, it displays a hoverable table with RSI values for multiple predefined timeframes.
Key Features
1. Candle Coloring Based on RSI Levels:
Candles are color-coded based on predefined RSI ranges for easy interpretation of market conditions.
RSI Levels:
75-100: Strongest Overbought (Green)
65-75: Stronger Overbought (Dark Green)
55-65: Overbought (Teal)
45-55: Sideways (Gray)
35-45: Oversold (Light Red)
25-35: Stronger Oversold (Dark Red)
0-25: Strongest Oversold (Bright Red)
2. Multi-Timeframe RSI Table:
Displays RSI values for the following timeframes:
1 Min, 2 Min, 3 Min, 4 Min, 5 Min
10 Min, 15 Min, 30 Min, 1 Hour, 1 Day, 1 Week
Helps traders identify RSI trends across different time horizons.
3. Hoverable RSI Values:
Displays the RSI value of any candle when hovering over it, providing additional insights for analysis.
Inputs
1. RSI Length:
Default: 14
Determines the calculation period for the RSI indicator.
2. RSI Levels:
Configurable thresholds for RSI zones:
75-100: Strongest Overbought
65-75: Stronger Overbought
55-65: Overbought
45-55: Sideways
35-45: Oversold
25-35: Stronger Oversold
0-25: Strongest Oversold
How It Works:
1. RSI Calculation:
The RSI is calculated for the current timeframe using the input RSI Length.
It is also computed for 11 additional predefined timeframes using request.security.
2. Candle Coloring:
Candles are colored based on their RSI values and the specified RSI levels.
3. Hoverable RSI Values:
Each candle displays its RSI value when hovered over, via a dynamically created label.
Multi-Timeframe Table:
A table at the bottom-left of the chart displays RSI values for all predefined timeframes, making it easy to compare trends.
Usage:
1. Trend Identification:
Use candle colors to quickly assess market conditions (overbought, oversold, or sideways).
2. Timeframe Analysis:
Compare RSI values across different timeframes to determine long-term and short-term momentum.
3. Signal Confirmation:
Combine RSI signals with other indicators or patterns for higher-confidence trades.
Best Practices
Use this indicator in conjunction with volume analysis, support/resistance levels, or trendline strategies for better results.
Customize RSI levels and timeframes based on your trading strategy or market conditions.
Limitations
RSI is a lagging indicator and may not always predict immediate market reversals.
Multi-timeframe analysis can lead to conflicting signals; consider your trading horizon.

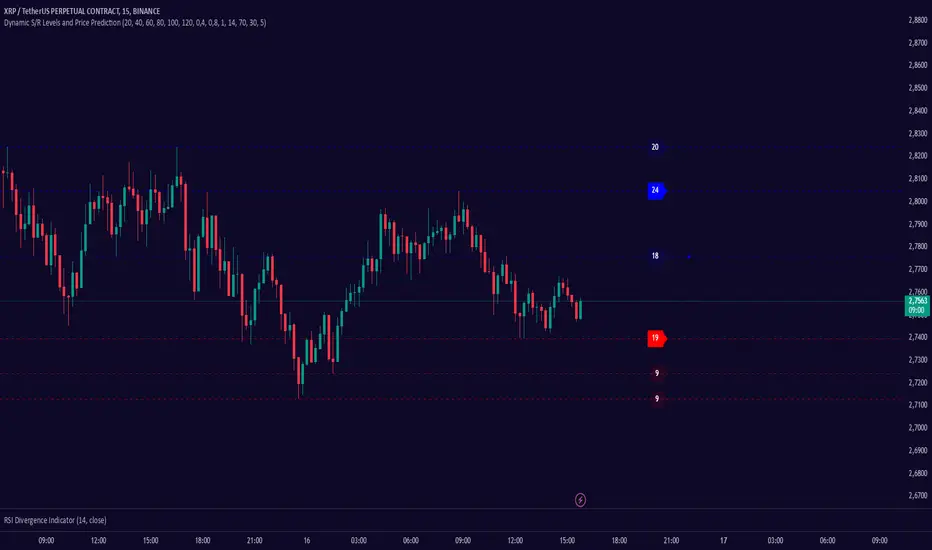
Dynamic S/R Levels: Edge FinderOverview
The Dynamic S/R Levels: Edge Finder indicator is designed to identify dynamic support and resistance levels based on historical price action. It uses a combination of price extremes (highs and lows) over user-defined lookback periods, weighted moving averages (WMAs), and touch-count analysis to provide actionable insights into key market levels.
This tool is ideal for traders who want to:
Identify dynamic support and resistance zones.
Understand the strength of these levels based on price touches.
Make informed decisions using clear, adaptive levels.
How It Works
Dynamic Levels Calculation:
The indicator calculates dynamic support levels using the lowest lows and dynamic resistance levels using the highest highs over user-defined lookback periods (e.g., 20, 40, 60 bars, etc.).
These levels are updated dynamically as new price data becomes available.
Touch Count Analysis:
The indicator counts how many times the price has touched or come close to each support/resistance level within the lookback period.
Levels with more touches are considered stronger and are highlighted accordingly.
Weighted Moving Averages (WMAs):
The indicator uses 50-period and 100-period WMAs to identify the closest support/resistance levels to the current trend.
Levels near these WMAs are given additional weight, as they are more likely to act as significant barriers.
Level Merging:
If two support or resistance levels are too close to each other (based on the minimum distance percentage), the weaker level (with fewer touches) is removed to avoid clutter.
Visualization:
Support levels are displayed as dashed red lines, and resistance levels are displayed as dashed blue lines.
Each level is labeled with its corresponding touch count, allowing traders to quickly assess its strength.
How to Interpret the Indicator
Strong Support/Resistance Levels:
Levels with higher touch counts (e.g., 5, 10, or more) are considered stronger and are more likely to hold in the future.
Use these levels to plan entries, exits, or stop-loss placements.
Proximity to WMAs:
Levels closest to the 50-period or 100-period WMA are more significant, especially in trending markets.
These levels often act as dynamic barriers where price reactions are more likely.
Breakouts and Rejections:
If the price breaks through a strong resistance level, it may indicate a potential bullish trend.
If the price rejects a strong support level, it may indicate a potential bearish trend.
Always confirm breakouts or rejections with additional analysis (e.g., volume, candlestick patterns).
Level Merging:
Merged levels indicate areas of high confluence, where multiple support/resistance zones overlap.
These areas are particularly important for decision-making, as they represent stronger market reactions.
Key Features
Customizable Lookback Periods: Adjust the lookback periods for each dynamic level to suit your trading style.
Touch Count Labels: Quickly identify the strength of each level based on the number of price touches.
Adaptive Levels: The indicator dynamically updates levels based on recent price action.
Clean Visualization: Levels are automatically merged to avoid clutter and provide a clear view of the market structure.
Usage Tips
Trend Identification: Combine the indicator with trend-following tools (e.g., moving averages, trendlines) to confirm the overall market direction.
Risk Management: Use the identified levels to set stop-loss orders or take-profit targets.
Timeframe Flexibility: The indicator works on all timeframes, but it is particularly effective on higher timeframes (e.g., 1H, 4H, Daily) for more reliable levels.
Example Scenarios
Bounce Trade:
If the price approaches a strong support level (high touch count) and shows signs of rejection (e.g., bullish candlestick patterns), consider a long position with a stop-loss below the support level.
Breakout Trade:
If the price breaks above a strong resistance level with high volume, consider a long position with a target at the next resistance level.
Range-Bound Market:
In a sideways market, use the support and resistance levels to identify range boundaries and trade bounces between them.
Disclaimer
Dynamic S/R Levels: Edge Finder is a technical analysis tool designed to identify dynamic support and resistance levels based on historical price action. It is intended for informational and educational purposes only. This indicator does not provide financial, investment, or trading advice. Users are solely responsible for their trading decisions and should conduct their own research and analysis before making any trades. The developer of this tool is not liable for any financial losses or damages resulting from the use of this indicator. Trading in financial markets involves risk, and you should only trade with capital you can afford to lose.
VWMACD-MFI-OBV Composite# MACD-MFI-OBV Composite
A dynamic volume-based technical indicator combining Volume-Weighted MACD, Money Flow Index (MFI), and normalized On Balance Volume (OBV). This composite indicator excels at identifying breakouts and strong trend movements through multiple volume confirmations, making it particularly effective for momentum and high-volatility trading environments.
## Overview
The indicator integrates trend, momentum, and cumulative volume analysis into a unified visualization system. Each component is carefully normalized to enable direct comparison, while the background color system provides instant trend recognition. This version is specifically optimized for breakout detection and strong trend confirmation.
## Core Components
### Volume-Weighted MACD
Visualized through the background color system, this enhanced MACD implementation uses Volume-Weighted Moving Averages (VWMA) instead of traditional EMAs. This modification ensures greater sensitivity to volume-supported price movements while filtering out less significant low-volume price changes. The background alternates between green (bullish) and red (bearish) to provide immediate trend feedback.
### Money Flow Index (MFI)
Displayed as the purple line, the MFI functions as a volume-weighted momentum oscillator. Operating within a natural 0-100 range, it helps identify potential overbought and oversold conditions while confirming volume support for price movements. The MFI is particularly effective at validating breakout momentum.
### Normalized On Balance Volume (OBV)
The white line represents normalized OBV, providing insight into cumulative buying and selling pressure. The normalization process scales OBV to match other components while maintaining its ability to confirm price trends through volume analysis. This component excels at identifying strong breakout movements and volume surges.
## Signal Integration
The indicator generates its most powerful signals when all three components align, particularly during breakout conditions:
Strong Bullish Signals develop when:
- Background shifts to green (VWMACD bullish)
- MFI shows strong upward momentum
- OBV demonstrates sharp volume accumulation
Strong Bearish Signals emerge when:
- Background turns red (VWMACD bearish)
- MFI exhibits downward momentum
- OBV shows significant volume distribution
## Market Application
This indicator variant is specifically designed for:
Breakout Trading:
The OBV component provides excellent sensitivity to volume surges, making it ideal for breakout confirmation and momentum validation.
Trend Following:
Sharp OBV movements combined with MFI momentum help identify and confirm strong trending conditions.
High Volatility Markets:
The indicator's design excels in active, volatile markets where clear signal generation is crucial for decision-making.
## Technical Implementation
Default Parameters:
Volume-Weighted MACD maintains traditional periods (12/26/9) while leveraging volume weighting. MFI uses standard 14-period calculation with 80/20 overbought/oversold thresholds. All components undergo normalization over a 100-period lookback for stable comparison.
Visual Elements:
- Background: VWMACD trend indication (green/red)
- Purple Line: Money Flow Index
- White Line: Normalized OBV
- Yellow Line: Combined signal (arithmetic mean of normalized components)
- Reference Lines: Key levels at 20, 50, and 80
## Trading Methodology
The indicator supports a systematic approach to breakout and momentum trading:
1. Breakout Identification
Monitor for background color changes accompanied by significant OBV movement, indicating potential breakout conditions.
2. Volume Surge Confirmation
Examine OBV slope and magnitude to confirm genuine breakout scenarios versus false moves.
3. Momentum Validation
Use MFI to confirm breakout strength and identify potential exhaustion points.
4. Combined Signal Analysis
The yellow line provides a unified view of all components, helping identify high-probability breakout opportunities.
## Interpretation Guidelines
Breakout Confirmation:
Strong breakouts typically show alignment of all three components with notable OBV surge. This configuration often precedes significant price movements.
Trend Strength:
Continuous OBV expansion during trends, supported by steady MFI readings, suggests sustained momentum.
## Market Selection
Optimal Markets Include:
- High-beta growth stocks
- Momentum-driven securities
- Stocks with significant volatility
- Active trading instruments
- Examples: TSLA, NVDA, growth stocks
## Version Information
Current Version: 2.0.0
This indicator represents a specialized adaptation of volume-based analysis, optimized for breakout trading and momentum strategies in high-volatility environments.

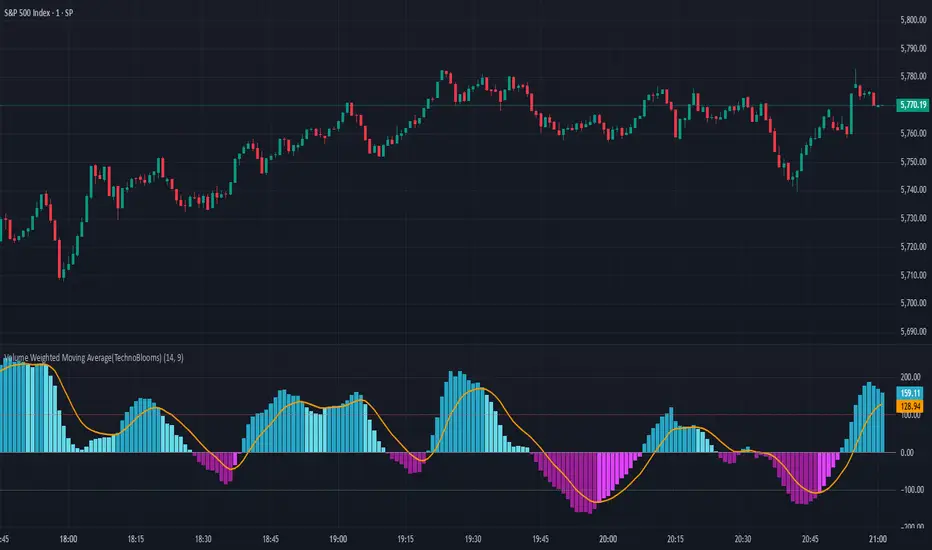
Volume Weighted Moving Average (TechnoBlooms)The Volume Weighted Moving Average Oscillator (VWMO) is a custom technical indicator designed to measure market momentum while accounting for volume. It helps traders assess whether price movements are supported by strong or weak trading volumes. The VWMO provides insights into potential trends by comparing current momentum with historical averages.
Indicator Overview:
The VWMO is based on a combination of price and volume data, highlighting the relationship between these two components to generate a clear oscillation value. The oscillator displays dynamic insights into market strength, capturing price directionality and volume alignment.
Key Features:
1. Dynamic Visualization of Momentum:
o The oscillator displays positive and negative momentum by analyzing the relationship between price movements and trading volume over a specified period.
o Positive momentum typically represents a bullish market, while negative momentum reflects bearish conditions.
2. Volume-Weighted Analysis:
o Volume is incorporated to give an adjusted price perspective, where price movements on high-volume days have more influence on the resulting oscillator values.
3. Trend Confirmation via EMA:
o An Exponential Moving Average (EMA) of the oscillator is plotted to smooth the raw oscillator values and provide trend confirmation.
o The EMA is essential for identifying whether the oscillator is in an upward or downward trend. It also serves as a support for evaluating when momentum might reverse.
4. Visual Indicators and Color Coding:
o The indicator uses varying color intensities to differentiate between strong and weak momentum.
o Bullish and bearish momentum is visually reflected by colors, offering at-a-glance guidance on potential trade opportunities.
5. Overbought and Oversold Thresholds:
o Horizontal lines at predefined levels (e.g., +100 and -100) help to define overbought and oversold areas, which assist in identifying overextended price movements that may signal reversals.
6. Scalability & Adaptability:
o The indicator allows for adjustment of the period, EMA length, and other key parameters to tailor its usage according to different asset classes or timeframe preferences.
Choppiness Index (levels)This Pine Script is a Choppiness Index Indicator with gradient visual enhancements. The Choppiness Index is a technical analysis tool that measures the "choppiness" or sideways movement of the market. It ranges from 0 to 100, where higher values indicate a more consolidated or sideways market, and lower values suggest a trending market.
Key Features:
Choppiness Index Calculation:
The script calculates the Choppiness Index based on the Average True Range (ATR) and the highest and lowest prices over a user-defined period (length).
Visual Bands:
Horizontal dashed lines are drawn at levels 55 (Upper Band), 50 (Middle Band), and 45 (Lower Band) to define key levels for interpreting the indicator.
Gradient Fills:
A blue fill is applied between the upper and lower bands (45–55) for visual clarity.
Dynamic gradients are applied to the areas:
Above the Upper Band (55–100): A green gradient fill where the color intensity increases with higher values.
Below the Lower Band (0–45): A red gradient fill where the color intensity increases with lower values.
Offset Option:
The offset input allows users to shift the Choppiness Index plot horizontally for visualization or alignment purposes.
Usage:
This indicator helps traders quickly assess market conditions:
Values above 55 indicate a choppy, non-trending market.
Values below 45 indicate a trending market.
The gradient fills make it easier to spot extreme conditions visually.
Customization:
Users can adjust:
length: The calculation period for the Choppiness Index.
offset: Horizontal shift of the Choppiness Index plot.
The gradient colors (green and red) and transparency levels are customizable in the script.
This enhanced visualization is ideal for traders who want a clear and intuitive representation of market choppiness, combined with visually striking gradient fills for quick analysis of market conditions.

Buy/Sell Signals for CM_Williams_Vix_FixThis script in Pine Script is designed to create an indicator that generates buy and sell signals based on the Williams VIX Fix (WVF) indicator. Here’s a brief explanation of how this script works:
Main Components:
Williams VIX Fix (WVF) – This volatility indicator is calculated using the formula:
WVF
=
(
highest(close, pd)
−
low
highest(close, pd)
)
×
100
WVF=(
highest(close, pd)
highest(close, pd)−low
)×100
where highest(close, pd) represents the highest closing price over the period pd, and low represents the lowest price over the same period.
Bollinger Bands are used to determine levels of overbought and oversold conditions. They are constructed around the moving average (SMA) of the WVF value using standard deviation (SD).
Ranges based on percentiles help identify extreme levels of WVF values to spot entry and exit points.
Buy and sell signals are generated when the WVF crosses the Bollinger Bands lines or reaches the ranges based on percentiles.
Adjustable Parameters:
LookBack Period Standard Deviation High (pd): The lookback period for calculating the highest closing price.
Bolinger Band Length (bbl): The length of the period for constructing the Bollinger Bands.
Bollinger Band Standard Devaition Up (mult): The multiplier for the standard deviation used for the upper Bollinger Band.
Look Back Period Percentile High (lb): The lookback period for calculating maximum and minimum WVF values.
Highest Percentile (ph): The percentile threshold for determining the high level.
Lowest Percentile (pl): The percentile threshold for determining the low level.
Show High Range (hp): Option to display the range based on percentiles.
Show Standard Deviation Line (sd): Option to display the standard deviation line.
Signals:
Buy Signal: Generated when the WVF crosses above the lower Bollinger Band or falls below the lower boundary of the percentile-based range.
Sell Signal: Generated when the WVF crosses below the upper Bollinger Band or rises above the upper boundary of the percentile-based range.
These signals are displayed as triangles below or above the candles respectively.
Application:
The script can be used by traders to analyze market conditions and make buying or selling decisions based on volatility and price behavior.

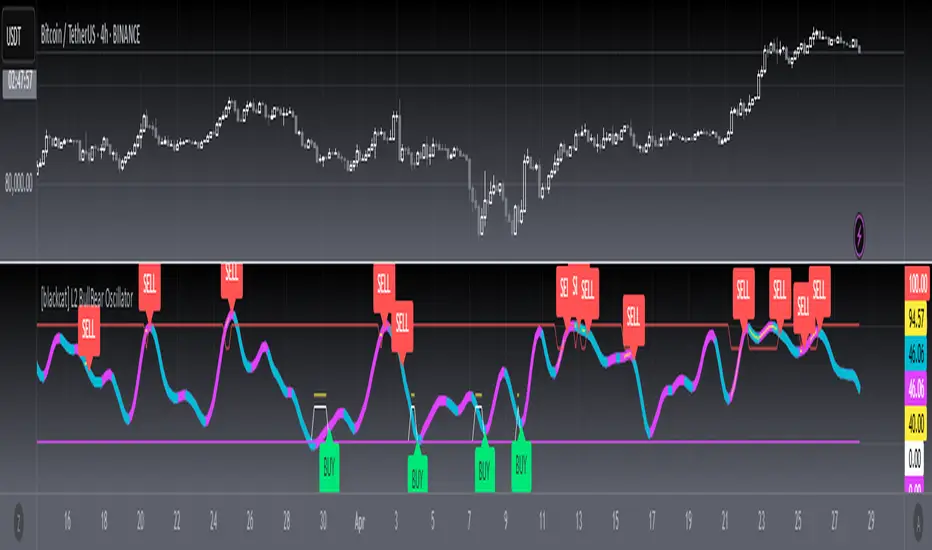
[blackcat] L2 BullBear OscillatorOVERVIEW
The " L2 BullBear Oscillator" is a custom trading indicator for TradingView that helps traders identify market trends, potential tops and bottoms, and the strength of trends using various moving averages and price relationships.
FEATURES
Calculates a base oscillator based on the close price relative to the highest and lowest prices over the past 60 periods.
Smoothes the oscillator using exponential moving averages (EMAs).
Determines market strength through relative strength indicators and moving averages.
Identifies potential tops and strong support levels based on specific conditions involving oscillators and price actions.
Plots several signals to help traders make informed decisions.
HOW TO USE
Install the script on your TradingView chart.
Customize the settings in the "Inputs" section:
Set the periods for the short-term and long-term EMAs.
Set the periods for the three SMAs used in calculations.
Interpret the plots:
BullBear Signal (Fuchsia Line): Indicates the overall market trend. Uptrends suggest buying opportunities, while downtrends suggest selling.
Decreasing BullBear Signal (Aqua Line): Highlights periods when the trend is weakening or turning bearish, signaling possible selling opportunities.
Potential Top Condition (Yellow Plot): Signals possible trend reversals from bullish to bearish, indicating times to consider taking profits or preparing for a downtrend.
High Price Condition (Yellow Plot): Indicates strong bullish momentum but also potentially overbought conditions, which might precede a correction.
Earning Condition (Red Line): Possibly signifies strong bullish signals, indicating good times to enter long positions.
Strong Support Condition (White Arrows): Signals potential bottoms or support levels, indicating buying opportunities.
Start Hiding Condition (Fuchsia Plot): Might indicate times to exit positions or reduce exposure due to unfavorable market conditions.
ALGORITHMS
Moving Averages:
Simple Moving Averages (SMAs): Used to calculate averages of price data over specified periods.
Exponential Moving Averages (EMAs): Used to give more weight to recent prices, making the moving averages more responsive to new data.
Oscillator Calculation:
The base oscillator is calculated based on the close price's position within the highest and lowest prices over 60 periods, normalized to a 0-100 scale.
This oscillator is then smoothed using EMAs to reduce noise and make trends more visible.
Relative Strength Indicator:
Calculated based on the close price's position within the highest and lowest prices over 20 periods, also normalized to a 0-100 scale.
This is smoothed using SMAs to get a more stable signal.
Condition Checks:
Various conditions are checked to identify potential tops, strong support, and other market states based on the relationships between these indicators and price actions.
LIMITATIONS
The script is based on historical data and does not guarantee future performance.
It is recommended to use the script in conjunction with other analysis tools.
The effectiveness of the strategy may vary depending on the market conditions and asset being traded.
NOTES
The script is designed for educational purposes and should not be considered financial advice.
Users are encouraged to backtest the strategy on a demo account before applying it to live trades.
THANKS
Special thanks to the TradingView community for their support and feedback.
Green/Red Candle Probability (EMA 7, SMA 20, SMA 200)### Strategy Explanation for Candle Probability Indicator
This script is designed to calculate the **probability of bullish (green) and bearish (red) candles** over a given analysis period. It leverages three key moving averages to identify market trends and display these probabilities directly on the chart, making it easier for traders to make informed decisions.
#### **How the Script Works:**
1. **Trend Detection Using Moving Averages:**
- The script calculates three moving averages:
- **EMA (Exponential Moving Average) over 7 periods**
- **SMA (Simple Moving Average) over 20 periods**
- **SMA over 200 periods**
The trend is classified as:
- **Bullish:** When EMA 7 > SMA 20 > SMA 200
- **Bearish:** When EMA 7 < SMA 20 < SMA 200
2. **Candle Analysis:**
The script analyzes the last "n" candles (based on the user-defined lookback period) to count the number of bullish and bearish candles:
- **Bullish (green) candle:** The closing price is higher than the opening price.
- **Bearish (red) candle:** The closing price is lower than the opening price.
3. **Probability Calculation:**
The probabilities are calculated as a percentage of bullish and bearish candles in the lookback period:
- **Green Probability (%) = (Number of Green Candles / Lookback Period) × 100**
- **Red Probability (%) = (Number of Red Candles / Lookback Period) × 100**
4. **Displaying Results in a Table:**
The results are displayed in a table on the chart, including:
- **Green Probability (%)**
- **Red Probability (%)**
- **Current Trend (Bullish, Bearish, or Neutral)**
#### **Strategy Overview:**
This indicator provides traders with a quick overview of the candle probabilities and the current market trend based on moving averages. It helps traders:
- Gauge the likelihood of bullish or bearish candles appearing in the near future.
- Identify the prevailing trend (bullish, bearish, or neutral).
- Adjust their trading strategies based on statistical probabilities rather than assumptions.
### **Important Notes:**
- The lookback period can be customized between **10 and 200 periods**.
- The indicator does not provide buy/sell signals but gives insights into market behavior.
By understanding the candle probabilities and the trend, traders can better assess market conditions and improve their decision-making process.

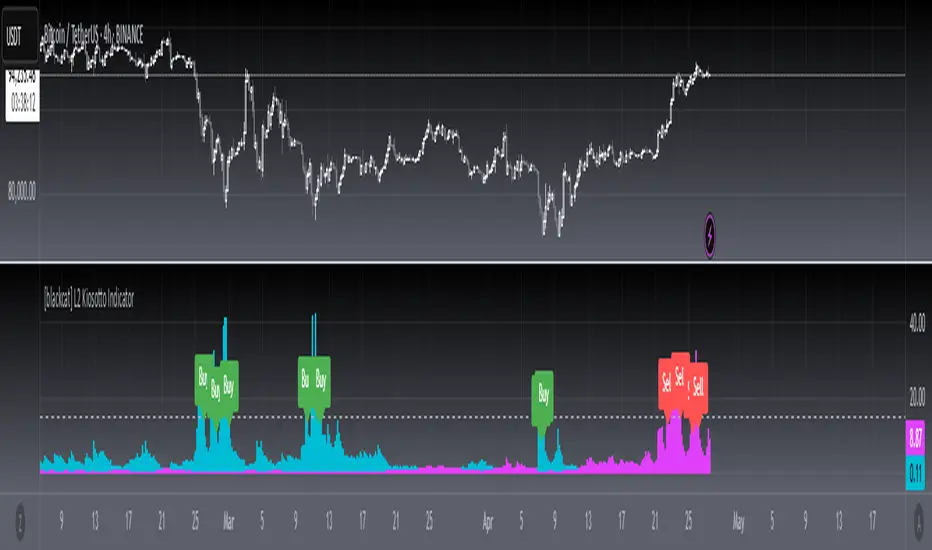
[blackcat] L2 Kiosotto IndicatorOVERVIEW
The Kiosotto Indicator is a versatile technical analysis tool designed for forex trading but applicable to other financial markets. It excels in detecting market reversals and trends without repainting, ensuring consistent and reliable signals. The indicator has evolved over time, with different versions focusing on specific aspects of market analysis.
KEY FEATURES
Reversal Detection: Identifies potential market reversals, crucial for traders looking to capitalize on turning points.
Trend Detection: Earlier versions focused on detecting trends, useful for traders who prefer to follow the market direction.
Non-Repainting: Signals remain consistent on the chart, providing reliable and consistent signals.
Normalization: Later versions, such as Normalized Kiosotto and Kiosotto_2025, incorporate normalization to assess oversold and overbought conditions, enhancing interpretability.
VERSIONS AND EVOLUTION
Early Versions: Focused on trend detection, useful for following market direction.
2 in 1 Kiosotto: Emphasizes reversal detection and is considered an improvement by users.
Normalized Versions (e.g., Kiosotto_2025, Kiosotto_3_2025): Introduce normalization to assess oversold and overbought conditions, enhancing interpretability.
HOW TO USE THE KIOSOTTO INDICATOR
Understanding Signals:
Reversals: Look for the indicator's signals that suggest a potential reversal, indicated by color changes, line crossings, or other visual cues.
Trends: Earlier versions might show stronger trending signals, indicated by the direction or slope of the indicator's lines.
Normalization Interpretation (for normalized versions):
Oversold: When the indicator hits the lower boundary, it might indicate an oversold condition, suggesting a potential buy signal.
Overbought: Hitting the upper boundary could signal an overbought condition, suggesting a potential sell signal.
PINE SCRIPT IMPLEMENTATION
The provided Pine Script code is a version of the Kiosotto indicator. Here's a detailed explanation of the code:
//@version=5
indicator(" L2 Kiosotto Indicator", overlay=false)
//Pine version of Kiosotto 2015 v4 Alert ms-nrp
// Input parameters
dev_period = input.int(150, "Dev Period")
alerts_level = input.float(15, "Alerts Level")
tsbul = 0.0
tsber = 0.0
hpres = 0.0
lpres = 9999999.0
for i = 0 to dev_period - 1
rsi = ta.rsi(close , dev_period)
if high > hpres
hpres := high
tsbul := tsbul + rsi * close
if low < lpres
lpres := low
tsber := tsber + rsi * close
buffer1 = tsber != 0 ? tsbul / tsber : 0
buffer2 = tsbul != 0 ? tsber / tsbul : 0
// Plotting
plot(buffer1, color=color.aqua, linewidth=3, style=plot.style_histogram)
plot(buffer2, color=color.fuchsia, linewidth=3, style=plot.style_histogram)
hline(alerts_level, color=color.silver)
EXPLANATION OF THE CODE
Indicator Definition:
indicator(" L2 Kiosotto Indicator", overlay=false): Defines the indicator with the name " L2 Kiosotto Indicator" and specifies that it should not be overlaid on the price chart.
Input Parameters:
dev_period = input.int(150, "Dev Period"): Allows users to set the period for the deviation calculation.
alerts_level = input.float(15, "Alerts Level"): Allows users to set the level for alerts.
Initialization:
tsbul = 0.0: Initializes the tsbul variable to 0.0.
tsber = 0.0: Initializes the tsber variable to 0.0.
hpres = 0.0: Initializes the hpres variable to 0.0.
lpres = 9999999.0: Initializes the lpres variable to a very high value.
Loop for Calculation:
The for loop iterates over the last dev_period bars.
rsi = ta.rsi(close , dev_period): Calculates the RSI for the current bar.
if high > hpres: If the high price of the current bar is greater than hpres, update hpres and add the product of RSI and close price to tsbul.
if low < lpres: If the low price of the current bar is less than lpres, update lpres and add the product of RSI and close price to tsber.
Buffer Calculation:
buffer1 = tsber != 0 ? tsbul / tsber : 0: Calculates the first buffer as the ratio of tsbul to tsber if tsber is not zero.
buffer2 = tsbul != 0 ? tsber / tsbul : 0: Calculates the second buffer as the ratio of tsber to tsbul if tsbul is not zero.
Plotting:
plot(buffer1, color=color.aqua, linewidth=3, style=plot.style_histogram): Plots the first buffer as a histogram with an aqua color.
plot(buffer2, color=color.fuchsia, linewidth=3, style=plot.style_histogram): Plots the second buffer as a histogram with a fuchsia color.
hline(alerts_level, color=color.silver): Draws a horizontal line at the alerts_level with a silver color.
FUNCTIONALITY
The Kiosotto indicator calculates two buffers based on the RSI and price levels over a specified period. The buffers are plotted as histograms, and a horizontal line is drawn at the alerts level. The indicator helps traders identify potential reversals and trends by analyzing the relationship between the RSI and price levels.
ALGORITHMS
RSI Calculation:
The Relative Strength Index (RSI) measures the speed and change of price movements. It is calculated using the formula:
RSI=100− (1+RS) / 100
where RS is the ratio of the average gain to the average loss over the specified period.
Buffer Calculation:
The buffers are calculated as the ratio of the sum of RSI multiplied by the close price for high and low price conditions. This helps in identifying the balance between buying and selling pressure.
Signal Generation:
The indicator generates signals based on the values of the buffers and the alerts level. Traders can use these signals to make informed trading decisions, such as entering or exiting trades based on potential reversals or trends.
APPLICATION SCENARIOS
Reversal Trading: Traders can use the Kiosotto indicator to identify potential reversals by looking for significant changes in the buffer values or crossings of the alerts level.
Trend Following: The indicator can also be used to follow trends by analyzing the direction and slope of the buffer lines.
Oversold/Overbought Conditions: For normalized versions, traders can use the indicator to identify oversold and overbought conditions, which can provide buy or sell signals.
THANKS
Special thanks to the TradingView community and the original developers for their contributions and support in creating and refining the Kiosotto Indicator.
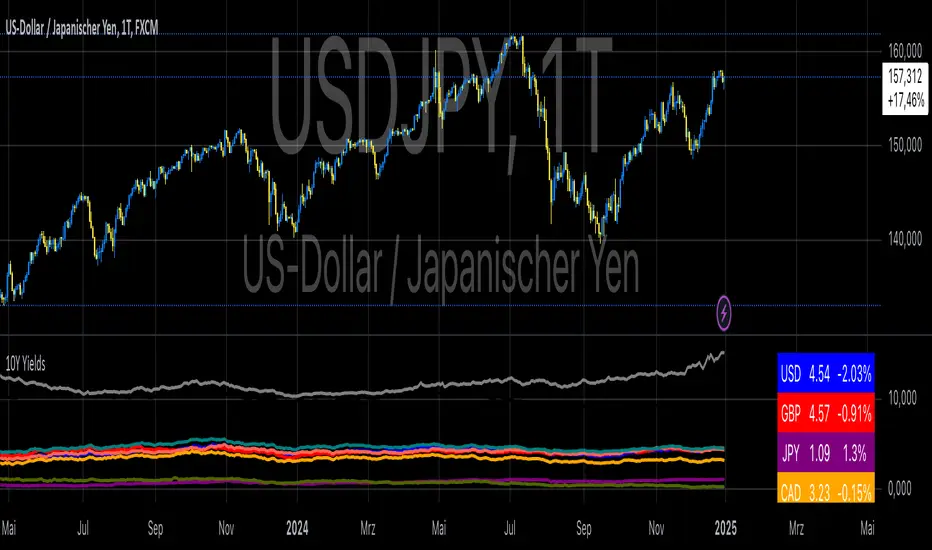
10-Year Yields Table for Major CurrenciesThe "10-Year Yields Table for Major Currencies" indicator provides a visual representation of the 10-year government bond yields for several major global economies, alongside their corresponding Rate of Change (ROC) values. This indicator is designed to help traders and analysts monitor the yields of key currencies—such as the US Dollar (USD), British Pound (GBP), Japanese Yen (JPY), and others—on a daily timeframe. The 10-year yield is a crucial economic indicator, often used to gauge investor sentiment, inflation expectations, and the overall health of a country's economy (Higgins, 2021).
Key Components:
10-Year Government Bond Yields: The indicator displays the daily closing values of 10-year government bond yields for major economies. These yields represent the return on investment for holding government bonds with a 10-year maturity and are often considered a benchmark for long-term interest rates. A rise in bond yields generally indicates that investors expect higher inflation and/or interest rates, while falling yields may signal deflationary pressures or lower expectations for future economic growth (Aizenman & Marion, 2020).
Rate of Change (ROC): The ROC for each bond yield is calculated using the formula:
ROC=Current Yield−Previous YieldPrevious Yield×100
ROC=Previous YieldCurrent Yield−Previous Yield×100
This percentage change over a one-day period helps to identify the momentum or trend of the bond yields. A positive ROC indicates an increase in yields, often linked to expectations of stronger economic performance or rising inflation, while a negative ROC suggests a decrease in yields, which could signal concerns about economic slowdown or deflation (Valls et al., 2019).
Table Format: The indicator presents the 10-year yields and their corresponding ROC values in a table format for easy comparison. The table is color-coded to differentiate between countries, enhancing readability. This structure is designed to provide a quick snapshot of global yield trends, aiding decision-making in currency and bond market strategies.
Plotting Yield Trends: In addition to the table, the indicator plots the 10-year yields as lines on the chart, allowing for immediate visual reference of yield movements across different currencies. The plotted lines provide a dynamic view of the yield curve, which is a vital tool for economic analysis and forecasting (Campbell et al., 2017).
Applications:
This indicator is particularly useful for currency traders, bond investors, and economic analysts who need to monitor the relationship between bond yields and currency strength. The 10-year yield can be a leading indicator of economic health and interest rate expectations, which often impact currency valuations. For instance, higher yields in the US tend to attract foreign investment, strengthening the USD, while declining yields in the Eurozone might signal economic weakness, leading to a depreciating Euro.
Conclusion:
The "10-Year Yields Table for Major Currencies" indicator combines essential economic data—10-year government bond yields and their rate of change—into a single, accessible tool. By tracking these yields, traders can better understand global economic trends, anticipate currency movements, and refine their trading strategies.
References:
Aizenman, J., & Marion, N. (2020). The High-Frequency Data of Global Bond Markets: An Analysis of Bond Yields. Journal of International Economics, 115, 26-45.
Campbell, J. Y., Lo, A. W., & MacKinlay, A. C. (2017). The Econometrics of Financial Markets. Princeton University Press.
Higgins, M. (2021). Macroeconomic Analysis: Bond Markets and Inflation. Harvard Business Review, 99(5), 45-60.
Valls, A., Ferreira, M., & Lopes, M. (2019). Understanding Yield Curves and Economic Indicators. Financial Markets Review, 32(4), 72-91.
HV-RV Oscillator by DINVESTORQ(PRABIR DAS)Description:
The HV-RV Oscillator is a powerful tool designed to help traders track and compare two types of volatility measures: Historical Volatility (HV) and Realized Volatility (RV). This indicator is useful for identifying periods of market volatility and can be employed in various trading strategies. It plots both volatility measures on a normalized scale (0 to 100) to allow easy comparison and analysis.
How It Works:
Historical Volatility (HV):
HV is calculated by taking the log returns of the closing prices and finding the standard deviation over a specified period (default is 14 periods).
The value is then annualized assuming 252 trading days in a year.
Realized Volatility (RV):
RV is based on the True Range, which is the maximum of the current high-low range, the difference between the high and the previous close, and the difference between the low and the previous close.
Like HV, the standard deviation of the True Range over a specified period is calculated and annualized.
Normalization:
Both HV and RV values are normalized to a 0-100 scale, making it easy to see their relative magnitude over time.
The highest and lowest values within the period are used to normalize the data, which smooths out short-term volatility spikes.
Smoothing:
The normalized values of both HV and RV are then smoothed using a Simple Moving Average (SMA) to reduce noise and provide a clearer trend.
Crossover Signals:
Buy Signal : When the Normalized HV crosses above the Normalized RV, it indicates that the historical volatility is increasing relative to the realized volatility, which could be interpreted as a buy signal.
Sell Signal : When the Normalized HV crosses below the Normalized RV, it suggests that the historical volatility is decreasing relative to the realized volatility, which could be seen as a sell signal.
Features:
Two Volatility Lines: The blue line represents Normalized HV, and the orange line represents Normalized RV.
Neutral Line: A gray dashed line at the 50 level indicates a neutral state between the two volatility measures.
Buy/Sell Markers: Green upward arrows are shown when the Normalized HV crosses above the Normalized RV, and red downward arrows appear when the Normalized HV crosses below the Normalized RV.
Inputs:
HV Period: The number of periods used to calculate Historical Volatility (default = 14).
RV Period: The number of periods used to calculate Realized Volatility (default = 14).
Smoothing Period: The number of periods used for smoothing the normalized values (default = 3).
How to Use:
This oscillator is designed for traders who want to track the relationship between Historical Volatility and Realized Volatility.
Buy signals occur when HV increases relative to RV, which can indicate increased market movement or potential breakout conditions.
Sell signals occur when RV is greater than HV, signaling reduced volatility or potential trend exhaustion.
Example Use Cases:
Breakout/Trend Strategy: Use the oscillator to identify potential periods of increased volatility (when HV crosses above RV) for breakout trades.
Mean Reversion: Use the oscillator to detect periods of low volatility (when RV crosses above HV) that might signal a return to the mean or consolidation.
This tool can be used on any asset class such as stocks, forex, commodities, or indices to help you make informed decisions based on the comparison of volatility measures.
NOTE: FOR INTRDAY PURPOSE USE 30/7/9 AS SETTING AND FOR DAY TRADE USE 14/7/9

Wickiness IndexWickiness Index - Detect Indecision and Trend Exhaustion
The Wickiness Index is a versatile technical indicator designed to measure the proportion of wicks (upper and lower shadows) relative to the total range of price bars over a specified lookback period. It provides insights into market indecision, reversals, and trend exhaustion by analyzing the structural composition of candlesticks. The indicator calculates the lengths of upper and lower wicks along with the body of each candlestick. Each bar's wick length is expressed as a percentage of the total range (High - Low). The ratio is scaled to 0–100, where 100 represents entirely wicks with no body (indicating pure indecision) and 0 represents no wicks with only body (indicating strong directional movement). These values are then averaged over the lookback period (default = 5 bars) to provide a smoothed representation of wickiness, reducing noise and highlighting trends.
A high value, especially above 70, suggests indecision or potential reversals, as candlesticks dominated by wicks often appear near tops or bottoms. Conversely, low values below 30 indicate trend strength and strong momentum, useful for spotting breakouts and trend continuation. Mid-range values between 30 and 70 often indicate consolidation phases or gradual transitions between trends. Traders can adjust the lookback period to match their trading style, with shorter periods offering faster responses and longer periods providing smoother trends.
This indicator is particularly useful for trend reversal detection, breakout confirmation, and volatility filtering. It scales effectively across all timeframes, making it suitable for both intraday traders and long-term investors. When combined with volume analysis or trend-following indicators, the Wickiness Index can further strengthen trade signals. The visual design includes a blue line for the index and horizontal reference lines at 30 and 70, allowing for quick and intuitive interpretation.
The Wickiness Index offers a unique perspective on market sentiment and price action behavior, providing traders with valuable insights into potential turning points, momentum shifts, and market indecision. It is a powerful tool for improving decision-making in volatile markets and identifying areas where price trends may weaken or reverse.

WD Gann: Close Price X Bars Ago with Line or Candle PlotThis indicator is inspired by the principles of WD Gann, a legendary trader known for his groundbreaking methods in time and price analysis. It helps traders track the close price of a security from X bars ago, a technique that is often used to identify key price levels in relation to past price movements. This concept is essential for Gann’s market theories, which emphasize the relationship between time and price.
WD Gann’s analysis often revolved around specific numbers that he considered significant, many of which correspond to squared numbers (e.g., 1, 4, 9, 16, 25, 36, 49, 64, 81, 100, 121, 144, 169, 196, 225, 256, 289, 324, 361, 400, 441, 484, 529, 576, 625, 676, 729, 784, 841, 900, 961, 1024, 1089, 1156, 1225, 1296, 1369, 1444, 1521, 1600, 1681, 1764, 1849, 1936). These numbers are believed to represent natural rhythms and cycles in the market. This indicator can help you explore how past price levels align with these significant numbers, potentially revealing key price zones that could act as support, resistance, or reversal points.
Key Features:
- Historical Close Price Calculation: The indicator calculates and displays the close price of a security from X bars ago (where X is customizable). This method aligns with Gann's focus on price relationships over specific time intervals, providing traders with valuable reference points to assess market conditions.
- Customizable Plot Type: You can choose between two plot types for visualizing the historical close price:
- Line Plot: A simple line that represents the close price from X bars ago, ideal for those who prefer a clean and continuous representation.
- Candle Plot: Displays the close price as a candlestick chart, providing a more detailed view with open, high, low, and close prices from X bars ago.
- Candle Color Coding: For the candle plot type, the script color-codes the candles. Green candles appear when the close price from X bars ago is higher than the open price, indicating bullish sentiment; red candles appear when the close is lower, indicating bearish sentiment. This color coding gives a quick visual cue to market sentiment.
- Customizable Number of Bars: You can adjust the number of bars (X) to look back, providing flexibility for analyzing different timeframes. Whether you're conducting short-term or long-term analysis, this input can be fine-tuned to suit your trading strategy.
- Gann Method Application: WD Gann's methods involved analyzing price action over specific time periods to predict future movements. This indicator offers traders a way to assess how the price of a security has behaved in the past in relation to a chosen time interval, a critical concept in Gann's theories.
How to Use:
1. Input Settings:
- Number of Bars (X): Choose the number of bars to look back (e.g., 100, 200, or any custom period).
- Plot Type: Select whether to display the data as a Line or Candles.
2. Interpretation:
- Using the Line plot, observe how the close price from X bars ago compares to the current market price.
- Using the Candles plot, analyze the full price action of the chosen bar from X bars ago, noting how the close price relates to the open, high, and low of that bar.
3. Gann Analysis: Integrate this indicator into your broader Gann-based analysis. By looking at past price levels and their relationship to significant squared numbers, traders can uncover potential key levels of support and resistance or even potential reversal points. The historical close price can act as a benchmark for predicting future market movements.
Suggestions on WD Gann's Emphasis in Trading:
WD Gann’s trading methods were rooted in several key principles that emphasized the relationship between time and price. These principles are vital to understanding how the "Close Price X Bars Ago" indicator fits into his overall analysis:
1. Time Cycles: Gann believed that markets move in cyclical patterns. By studying price levels from specific time intervals, traders can spot these cycles and predict future market behavior. This indicator allows you to see how the close price from X bars ago relates to current market conditions, helping to spot cyclical highs and lows.
2. Price and Time Squaring: A core concept in Gann’s theory is that certain price levels and time periods align, often marking significant reversal points. The squared numbers (e.g., 1, 4, 9, 16, 25, etc.) serve as potential key levels where price and time might "square" to create support or resistance. This indicator helps traders spot these historical price levels and their potential relevance to future price action.
3. Geometric Angles: Gann used angles (like the 45-degree angle) to predict market movements, with the belief that prices move at specific geometric angles over time. This indicator gives traders a reference for past price levels, which could align with key angles, helping traders predict future price movement based on Gann's geometry.
4. Numerology and Key Intervals: Gann paid particular attention to numbers that held significance, including squared numbers and numbers related to the Fibonacci sequence. This indicator allows traders to analyze price levels based on these key numbers, which can help in identifying potential turning points in the market.
5. Support and Resistance Levels: Gann’s methods often involved identifying levels of support and resistance based on past price action. By tracking the close price from X bars ago, traders can identify past support and resistance levels that may become significant again in future market conditions.
Perfect for:
Traders using WD Gann’s methods, such as Gann angles, time cycles, and price theory.
Analysts who focus on historical price levels to predict future price action.
Those who rely on numerology and geometric principles in their trading strategies.
By integrating this indicator into your trading strategy, you gain a powerful tool for analyzing market cycles and price movements in relation to key time intervals. The ability to track and compare the historical close price to significant numbers—like Gann’s squared numbers—can provide valuable insights into potential support, resistance, and reversal points.
Disclaimer:
This indicator is based on the methods and principles of WD Gann and is for educational purposes only. It is not intended as financial advice. Trading involves significant risk, and you should not trade with money that you cannot afford to lose. Past performance is not indicative of future results. The use of this indicator is at your own discretion and risk. Always do your own research and consider consulting a licensed financial advisor before making any investment decisions.

Pi Cycle Top & Bottom OscillatorThis TradingView script implements the Pi Cycle Top & Bottom Oscillator, a technical indicator designed to identify potential market tops and bottoms using moving average relationships. Here's a detailed breakdown:
Indicator Overview
Purpose: The indicator calculates an oscillator based on the ratio of a 111-day simple moving average (SMA) to double the 350-day SMA. It identifies potential overbought (market tops) and oversold (market bottoms) conditions.
Visualization: The oscillator is displayed in a standalone pane with dynamic color coding to represent different market conditions.
Inputs
111-Day Moving Average Length (length_111): Adjustable parameter for the short-term moving average. Default is 111 days.
350-Day Moving Average Length (length_350): Adjustable parameter for the long-term moving average. Default is 350 days.
Overheat Threshold (upper_threshold): Percentage level above which the market is considered overheated. Default is 100%.
Cooling Down Threshold (lower_threshold): Percentage level below which the market is cooling down. Default is 75%.
Calculation
Moving Averages:
111-day SMA of the closing price.
350-day SMA of the closing price.
Double the 350-day SMA (
𝑚
𝑎
_
2
_
350
=
𝑚
𝑎
_
350
×
2
ma_2_350=ma_350×2).
Oscillator:
Ratio of the 111-day SMA to double the 350-day SMA, expressed as a percentage:
oscillator
=
𝑚
𝑎
_
111
𝑚
𝑎
_
2
_
350
×
100
oscillator=
ma_2_350
ma_111
×100
Market Conditions
Overheated Market (Potential Top): Oscillator >= Overheat Threshold (100% by default). Highlighted in red.
Cooling Down Market (Potential Bottom): Oscillator <= Cooling Down Threshold (75% by default). Highlighted in green.
Normal Market Condition: Oscillator is between these thresholds. Highlighted in blue.
Visual Features
Dynamic Oscillator Plot:
Color-coded to indicate market conditions:
Red: Overheated.
Green: Cooling down.
Blue: Normal condition.
Threshold Lines:
Red Dashed Line: Overheat Threshold.
Green Dashed Line: Cooling Down Threshold.
White Dashed Line: Additional high-value marker at 30 for reference.
Alerts
Overheat Alert: Triggers when the oscillator crosses the overheat threshold, signaling a potential market top.
Cooling Down Alert: Triggers when the oscillator crosses the cooling down threshold, signaling a potential market bottom.
Use Case
This script is particularly useful for traders seeking early signals of market reversals. The thresholds and dynamic color coding provide visual cues and alerts to aid decision-making in identifying overbought or oversold conditions.

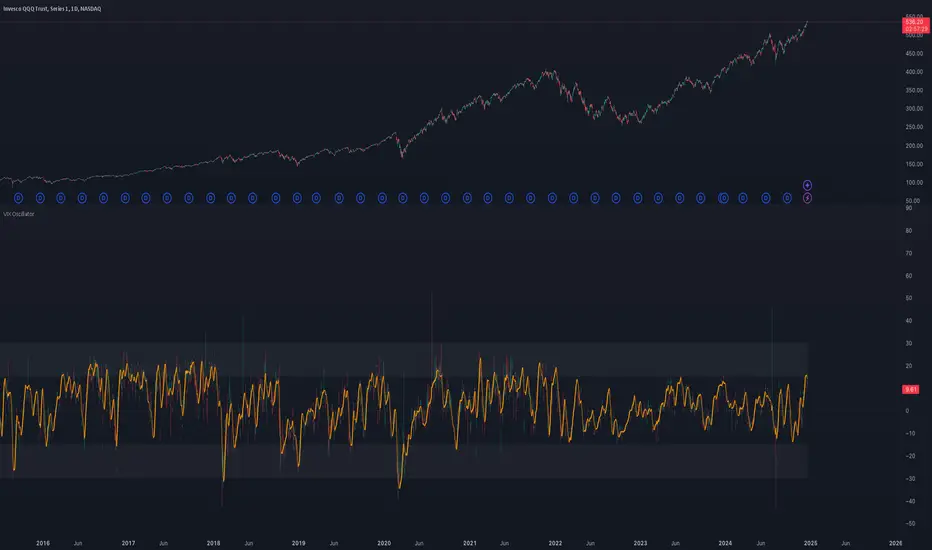
VIX OscillatorOVERVIEW
Plots an oscillating value as a percentage, derived from the VIX and VIX3M . This can help identify broader market trends and pivots on higher time frames (ie. 1D), useful when making swing trades.
DATA & MATH
The VIX is a real-time index of expected S&P 500 volatility over the next 30 days, derived from option prices with near-term expirations. Similarly, the VIX3M measures expected volatility over the next 90 days.
Dividing one by the other yields an oscillating value, normalizing the relative strength of the expected volatility. Most commonly the VIX is divided by the VIX3M. However, because the VIX is inversely correlated to market sentiment (typically), this indicator divides the VIX3M by the VIX to visually correlate the plot direction with the anticipated market direction. Further, it subtracts 1.1 from the quotient to visually center the plot, and multiplies that difference by 100 to amplify the value as a percentage:
( VIX3M / VIX - 1.1 ) * 100
This variation makes identifying sentiment extremes easier within a buy-low-sell-high paradigm, where values below zero are bearish and values above zero are bullish.
PLOTS
Two plots are used, maximizing data fidelity and convenience. Candles are used to accurately reflect the quantized math and a Linear Regression is used to simplify contextualization. If you're not familiar with what a Linear Regression is, you can think of it like a better moving average. High / Low zones are also plotted to help identify sentiment extremes.
This combination allows you to quickly identify the expected sentiment (bullish / bearish) and its relative value (normal / extreme), which you can then use to anticipate if a trend continuation or pivot is more likely.
INPUTS
Candle colors (rise and fall)
Linear regression colors and length
Zone thresholds and zero line
Cryptocurrency SentimentOverview
This script focuses on calculating and visualizing the sentiment difference between LONG positions and SHORT positions for a selected cryptocurrency pair on the Bitfinex exchange. It provides a clean and clear visual representation of the sentiment, helping traders analyze market behavior.
Key Features
Dynamic Symbol Selection:
The script automatically detects the cryptocurrency symbol from the chart (syminfo.basecurrency) and dynamically constructs the LONGS and SHORTS ticker symbols.
Works seamlessly for pairs like BTCUSD, ETHUSD, and others available on Bitfinex.
Sentiment Calculation:
The sentiment difference is calculated as:
Sentiment Difference=−1×(100− SHORTS/LONGS ×100)
LONGS : The total number of long positions.
SHORTS : The total number of short positions.
If SHORTS is 0, the value is safely skipped to avoid division errors.
Color Coding:
The script visually highlights the sentiment difference:
Green Line: Indicates that LONG positions are dominant (bullish sentiment).
Red Line: Indicates that SHORT positions are dominant (bearish sentiment).
Zero Reference Line:
A gray horizontal line at 0 helps users quickly identify the transition between bullish (above zero) and bearish (below zero) sentiment.
How It Works
Fetching Data:
The script uses request.security to fetch LONGS and SHORTS data at the current chart timeframe (timeframe.period) for the dynamically generated Bitfinex tickers.
Handling Data:
Missing or invalid data (NaN) is filtered out to prevent errors.
Extreme spikes or irregular values are safely avoided.
Visualization:
The sentiment difference is plotted with dynamic color coding:
Green when LONGS > SHORTS (bullish sentiment).
Red when SHORTS > LONGS (bearish sentiment).
Benefits
Market Sentiment Insight: Helps traders quickly identify if the market is leaning towards bullish or bearish sentiment based on actual LONG and SHORT position data.
Dynamic and Adaptive: Automatically adjusts to the selected cryptocurrency symbol on the chart.
Clean Visualization: Focuses solely on sentiment difference with color-coded signals, making it easy to interpret.
Best Use Cases
Trend Confirmation: Use the sentiment difference to confirm trends during bullish or bearish moves.
Market Reversals: Identify potential reversals when sentiment shifts from positive (green) to negative (red) or vice versa.
Sentiment Monitoring: Monitor the overall market bias for cryptocurrencies like BTC, ETH, XRP, etc., in real-time.
Sample Chart Output
Above Zero → Green Line: Bullish sentiment dominates.
Below Zero → Red Line: Bearish sentiment dominates.
Zero Line → Transition point for shifts in sentiment.

Log Regression OscillatorThe Log Regression Oscillator transforms the logarithmic regression curves into an easy-to-interpret oscillator that displays potential cycle tops/bottoms.
🔶 USAGE
Calculating the logarithmic regression of long-term swings can help show future tops/bottoms. The relationship between previous swing points is calculated and projected further. The calculated levels are directly associated with swing points, which means every swing point will change the calculation. Importantly, all levels will be updated through all bars when a new swing is detected.
The "Log Regression Oscillator" transforms the calculated levels, where the top level is regarded as 100 and the bottom level as 0. The price values are displayed in between and calculated as a ratio between the top and bottom, resulting in a clear view of where the price is situated.
The main picture contains the Logarithmic Regression Alternative on the chart to compare with this published script.
Included are the levels 30 and 70. In the example of Bitcoin, previous cycles showed a similar pattern: the bullish parabolic was halfway when the oscillator passed the 30-level, and the top was very near when passing the 70-level.
🔹 Proactive
A "Proactive" option is included, which ensures immediate calculations of tentative unconfirmed swings.
Instead of waiting 300 bars for confirmation, the "Proactive" mode will display a gray-white dot (not confirmed swing) and add the unconfirmed Swing value to the calculation.
The above example shows that the "Calculated Values" of the potential future top and bottom are adjusted, including the provisional swing.
When the swing is confirmed, the calculations are again adjusted, showing a red dot (confirmed top swing) or a green dot (confirmed bottom swing).
🔹 Dashboard
When less than two swings are available (top/bottom), this will be shown in the dashboard.
The user can lower the "Threshold" value or switch to a lower timeframe.
🔹 Notes
Logarithmic regression is typically used to model situations where growth or decay accelerates rapidly at first and then slows over time, meaning some symbols/tickers will fit better than others.
Since the logarithmic regression depends on swing values, each new value will change the calculation. A well-fitted model could not fit anymore in the future.
Users have to check the validity of swings; for example, if the direction of swings is downwards, then the dataset is not fitted for logarithmic regression.
In the example above, the "Threshold" is lowered. However, the calculated levels are unreliable due to the swings, which do not fit the model well.
Here, the combination of downward bottom swings and price accelerates slower at first and faster recently, resulting in a non-fit for the logarithmic regression model.
Note the price value (white line) is bound to a limit of 150 (upwards) and -150 (down)
In short, logarithmic regression is best used when there are enough tops/bottoms, and all tops are around 100, and all bottoms around 0.
Also, note that this indicator has been developed for a daily (or higher) timeframe chart.
🔶 DETAILS
In mathematics, the dot product or scalar product is an algebraic operation that takes two equal-length sequences of numbers (arrays) and returns a single number, the sum of the products of the corresponding entries of the two sequences of numbers.
The usual way is to loop through both arrays and sum the products.
In this case, the two arrays are transformed into a matrix, wherein in one matrix, a single column is filled with the first array values, and in the second matrix, a single row is filled with the second array values.
After this, the function matrix.mult() returns a new matrix resulting from the product between the matrices m1 and m2.
Then, the matrix.eigenvalues() function transforms this matrix into an array, where the array.sum() function finally returns the sum of the array's elements, which is the dot product.
dot(x, y)=>
if x.size() > 1 and y.size() > 1
m1 = matrix.new()
m2 = matrix.new()
m1.add_col(m1.columns(), y)
m2.add_row(m2.rows (), x)
m1.mult (m2)
.eigenvalues()
.sum()
🔶 SETTINGS
Threshold: Period used for the swing detection, with higher values returning longer-term Swing Levels.
Proactive: Tentative Swings are included with this setting enabled.
Style: Color Settings
Dashboard: Toggle, "Location" and "Text Size"

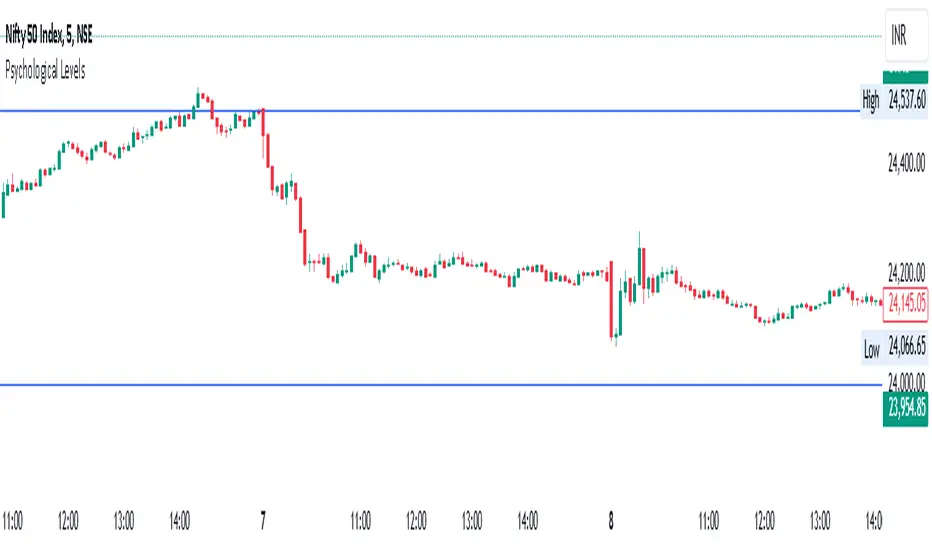
Psychological Levels- Rounding Numbers Psychological Levels Indicator
Overview:
The Psychological Levels Indicator automatically identifies and plots significant price levels based on psychological thresholds, which are key areas where market participants often focus their attention. These levels act as potential support or resistance zones due to human behavioral tendencies to round off numbers. This indicator dynamically adjusts the levels based on the stock's price range and ensures seamless visibility across the chart.
Key Features:
Dynamic Step Sizes:
The indicator adjusts the levels dynamically based on the stock price:
For prices below 500: Levels are spaced at 10.
For prices between 500 and 3000: Levels are spaced at 50, 100, and 1000.
For prices between 3000 and 10,000: Levels are spaced at 100 and 1000.
For prices above 10,000: Levels are spaced at 500 and 1000.
Extended Visibility:
The plotted levels are extended across the entire chart for improved visualization, ensuring traders can easily monitor these critical zones over time.
Customization Options:
Line Color: Choose the color for the levels to suit your charting style.
Line Style: Select from solid, dashed, or dotted lines.
Line Width: Adjust the thickness of the lines for better clarity.
Clean and Efficient Design:
The indicator only plots levels relevant to the visible chart range, avoiding unnecessary clutter and ensuring a clean workspace.
How It Works:
It calculates the relevant step sizes based on the price:
Smaller step sizes for lower-priced stocks.
Larger step sizes for higher-priced stocks.
Primary, secondary, and (if applicable) tertiary levels are plotted dynamically:
Primary Levels: The most granular levels based on the stock price.
Secondary Levels: Higher-order levels for broader significance.
Tertiary Levels: Additional levels for lower-priced stocks to enhance detail.
These levels are plotted across the chart, allowing traders to visualize key psychological areas effortlessly.
Use Cases:
Day Trading: Identify potential intraday support and resistance levels.
Swing Trading: Recognize key price zones where trends may pause or reverse.
Long-Term Investing: Gain insights into significant price zones for entry or exit strategies.
IndicatorsLibrary "Indicators"
cmf(lookback, n_to_smooth)
Calculates the Chaikin's Money Flow.
Parameters:
lookback (simple int)
n_to_smooth (simple int)
Returns: float The Money Flow value.
cmma(lookback, atr_length)
Calculates the CMMA (Close Minus Moving Average) indicator.
Parameters:
lookback (simple int)
atr_length (simple int)
Returns: float The CMMA value.
macd(fast_length, slow_length, n_to_smooth)
Calculates the normalized and scaled MACD.
Parameters:
fast_length (simple int)
slow_length (simple int)
n_to_smooth (simple int)
Returns: A tuple containing .
stochK(length, n_to_smooth)
Calculates a simplified Stochastic Oscillator.
Uses: 100 * ta.sma((close - lowest_low) / (highest_high - lowest_low), n_to_smooth)
Parameters:
length (simple int)
n_to_smooth (simple int)
Returns: float The Stochastic %K value.
williamsR(length)
Calculates the Williams %R using the stochK function.
Uses: -1 * (100 - stoch(length, 1))
Parameters:
length (simple int)
Returns: float The Williams %R value.

Scatter PlotThe Price Volume Scatter Plot publication aims to provide intrabar detail as a Scatter Plot .
🔶 USAGE
A dot is drawn at every intrabar close price and its corresponding volume , as can seen in the following example:
Price is placed against the white y-axis, where volume is represented on the orange x-axis.
🔹 More detail
A Scatter Plot can be beneficial because it shows more detail compared with a Volume Profile (seen at the right of the Scatter Plot).
The Scatter Plot is accompanied by a "Line of Best Fit" (linear regression line) to help identify the underlying direction, which can be helpful in interpretation/evaluation.
It can be set as a screener by putting multiple layouts together.
🔹 Easier Interpretation
Instead of analysing the 1-minute chart together with volume, this can be visualised in the Scatter Plot, giving a straightforward and easy-to-interpret image of intrabar volume per price level.
One of the scatter plot's advantages is that volumes at the same price level are added to each other.
A dot on the scatter plot represents the cumulated amount of volume at that particular price level, regardless of whether the price closed one or more times at that price level.
Depending on the setting "Direction" , which sets the direction of the Volume-axis, users can hoover to see the corresponding price/volume.
🔹 Highest Intrabar Volume Values
Users can display up to 5 last maximum intrabar volume values, together with the intrabar timeframe (Res)
🔹 Practical Examples
When we divide the recent bar into three parts, the following can be noticed:
Price spends most of its time in the upper part, with relative medium-low volume, since the intrabar close prices are mostly situated in the upper left quadrant.
Price spends a shorter time in the middle part, with relative medium-low volume.
Price moved rarely below 61800 (the lowest part), but it was associated with high volume. None of the intrabar close prices reached the lowest area, and the price bounced back.
In the following example, the latest weekly candle shows a rejection of the 45.8 - 48.5K area, with the highest volume at the 45.8K level.
The next three successive candles show a declining maximum intrabar volume, after which the price broke through the 45.8K area.
🔹 Visual Options
There are many visual options available.
🔹 Change Direction
The Scatter Plot can be set in 4 different directions.
🔶 NOTES
🔹 Notes
The script uses the maximum available resources to draw the price/volume dots, which are 500 boxes and 500 labels. When the population size exceeds 1000, a warning is provided ( Not all data is shown ); otherwise, only the population size is displayed.
The Scatter Plot ideally needs a chart which contains at least 100 bars. When it contains less, a warning will be shown: bars < 100, not all data is shown
🔹 LTF Settings
When 'Auto' is enabled ( Settings , LTF ), the LTF will be the nearest possible x times smaller TF than the current TF. When 'Premium' is disabled, the minimum TF will always be 1 minute to ensure TradingView plans lower than Premium don't get an error.
Examples with current Daily TF (when Premium is enabled):
500 : 3 minute LTF
1500 (default): 1 minute LTF
5000: 30 seconds LTF (1 minute if Premium is disabled)
🔶 SETTINGS
Direction: Direction of Volume-axis; Left, Right, Up or Down
🔹 LTF
LTF: LTF setting
Auto + multiple: Adjusts the initial set LTF
Premium: Enable when your TradingView plan is Premium or higher
🔹 Character
Character: Style of Price/Volume dot
Fade: Increasing this number fades dots at lower price/volume
Color
🔹 Linear Regression
Toggle (enable/disable), color, linestyle
Center Cross: Toggle, color
🔹 Background Color
Fade: Increasing this number fades the background color near lower values
Volume: Background color that intensifies as the volume value on the volume-axis increases
Price: Background color that intensifies as the price value on the price-axis increases
🔹 Labels
Size: Size of price/volume labels
Volume: Color for volume labels/axis
Price: Color for price labels/axis
Display Population Size: Show the population size + warning if it exceeds 1000
🔹 Dashboard
Location: Location of dashboard
Size: Text size
Display LTF: Display the intrabar Lower Timeframe used
Highest IB volume: Display up to 5 previous highest Intrabar Volume values
