ALL Philakone's EMA's (8,13,21,55,100, 200)These are Philakone's EMA's. I added the 100 day in there as I didn't see that anyone had done that.
The 100 might be the same color as the 200 looking at the code, I changed it on my chart, but just make sure you check the colors.
"摩根纳斯达克100基金风险大吗" için komut dosyalarını ara

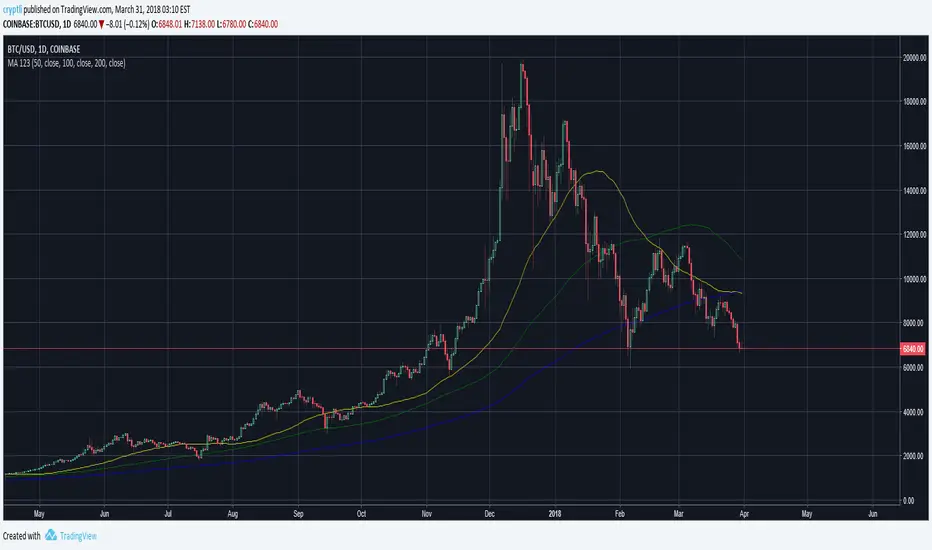
Moving Averages MA 50,100 and 200Just a simple collection of 3 most used Moving Averages 50,100 and 200
50=Yellow
100=Green
200=Blue
Moving Average 50,100 and 200Just a simple collection of 3 most used Moving Averages 50,100 and 200
50=Yellow
100=Green
200=Blue
FX Sniper: T3-CCI Strategy - With 100 IndicatorsEntry signal when moving above -100, sell signal when going below 100


Moving Averages 7 & 15 & 50 & 100 & 200 & 400we can use 7 moving averages for one indicator.
base moving averages are 7, 15, 50, 100, 200 and 400.
it can be used for determining of trend
Green Arrow Signal: Close > EMA9 and EMA9 of RSI123 > 100Plot a green arrow below the bar when:
Close price > EMA9
EMA9 of RSI(123) > 100

EMA 10/20/50/100/200plot 10, 20, 50,100,200 EMA on the chart. can be used to determine on any timeframe EMA
Blended EMA (50 & 100)Plots EMA 50, EMA 100, and a blended EMA (average of the two)
Option to hide/show the original EMAs
Clean and lightweight — great for trend filtering on 1hr/4hr

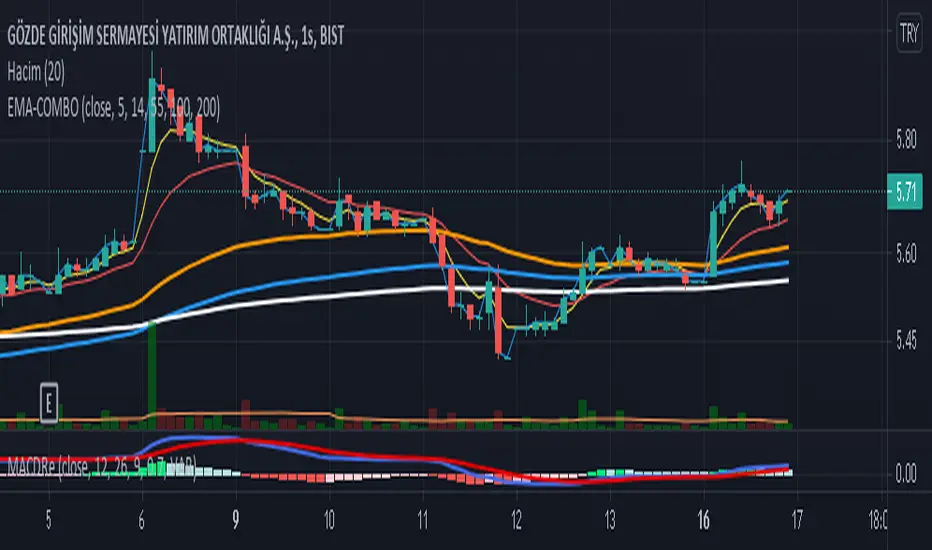
Moyenne des EMA (5, 9, 20, 50, 100, 200)La moyenne des EMA 5,9,20,50,100,200 haut, bas, ouverture ou fermeture pour le calcul.

ORB with 100 EMAORB Trading Strategy for FX Pairs on the 30-Minute Time Frame
Overview
This Opening Range Breakout (ORB) strategy is designed for trading FX pairs on the 30-minute time frame. The strategy is structured to take advantage of price momentum while aligning trades with the overall trend using the 100-period Exponential Moving Average (100EMA). The primary objective is to enter trades when price breaks and closes above or below the Opening Range (OR), with additional confirmation from a retest of the OR level if the initial entry is missed.
Strategy Rules
1. Defining the Opening Range (OR)
- The OR is determined by the high and low of the first 30-minute candle after market open.
- This range acts as the key level for breakout trading.
2. Trend Confirmation Using the 100EMA
- The 100EMA serves as a filter to determine trade direction:
- Buy Setup: Only take buy trades when the OR is above the 100EMA.
- Sell Setup: Only take sell trades when the OR is below the 100EMA.
3. Entry Criteria
- Buy Trade: Enter a long position when a candle breaks and closes above the OR high, confirming the breakout.
- Sell Trade: Enter a short position when a candle breaks and closes below the OR low, confirming the breakout.
- Retest Entry: If the initial entry is missed, wait for a price retest of the OR level for a secondary entry opportunity.
4. Risk-to-Reward Ratio (R2R)
- The goal is to target a 1:1 Risk-to-Reward (R2R) ratio.
- Stop-loss placement:
- Buy Trade: Place stop-loss just below the OR low.
- Sell Trade: Place stop-loss just above the OR high.
- Take profit at a distance equal to the stop-loss for a 1:1 R2R.
5. Risk Management
- Risk per trade should be based on personal risk tolerance.
- Adjust lot sizes accordingly to maintain a controlled risk percentage of account balance.
- Avoid over-leveraging, and consider moving stop-loss to breakeven if the price moves favourably.
Additional Considerations
- Avoid trading during major news events that may cause high volatility and unpredictable price movements.
- Monitor market conditions to ensure breakout confirmation with strong momentum rather than false breakouts.
- Use additional confluences such as candlestick patterns, support/resistance zones, or volume analysis for stronger trade validation.
This ORB strategy is designed to provide structured trade opportunities by combining breakout momentum with trend confirmation via the 100EMA. The strategy is straightforward, allowing traders to capitalise on clear breakout movements while implementing effective risk management practices. While the 1:1 R2R target provides a balanced approach, traders should always adapt their risk tolerance and market conditions to optimise trade performance.
By following these rules and maintaining discipline, traders can use this strategy effectively across various FX pairs on the 30-minute time frame.
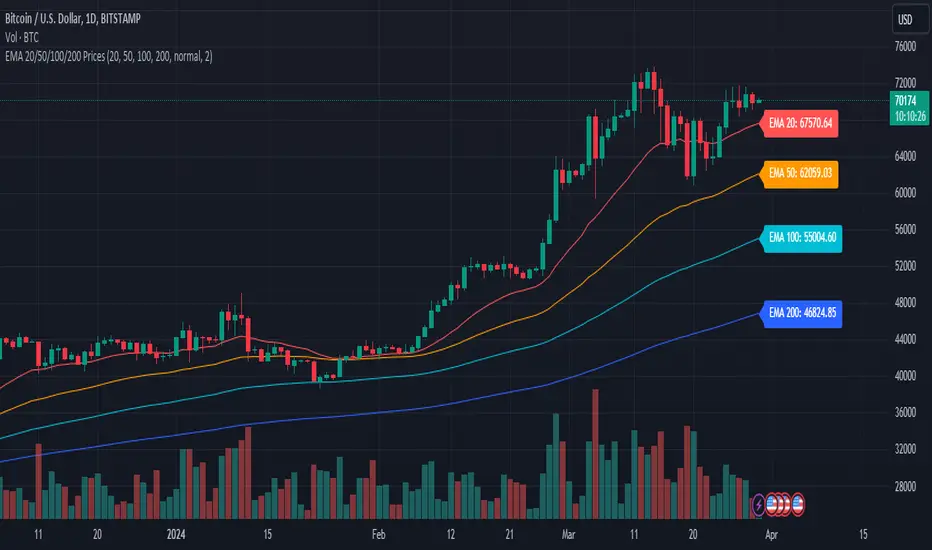
EMA 20/50/100/200 PricesDescription:
Introducing the EMA Indicator with Dynamic Labels, a unique addition to the TradingView Public Library. This innovative script enhances trend analysis and decision-making by overlaying four Exponential Moving Averages (EMAs) – 20, 50, 100, and 200 periods – on your chart, each with a distinct color for quick identification.
What sets this script apart?
Unlike standard EMA indicators, this script includes dynamic labels that display the current price level of each EMA at the latest price bar. This feature provides an instant snapshot of market sentiment, offering insights into potential dynamic support or resistance levels.
Key Features:
Customizable EMA Periods: Tailor the EMA periods according to your trading strategy, allowing for flexibility across different timeframes and assets.
Adaptive Label Sizes: A unique function adjusts label sizes based on user input, ensuring optimal readability across various display settings.
Color-Coded EMAs: Quickly differentiate between the EMAs with pre-defined colors, enhancing visual clarity and trend recognition.
How to Use:
Trend Analysis: Use the EMAs to identify the overall market trend. When shorter EMAs are above longer ones, it suggests a bullish trend, and vice versa.
Trade Entries and Exits: Look for crossovers of the EMAs as potential entry or exit signals. Dynamic labels will help you pinpoint the exact levels.
Customization: Adjust the EMA periods and label sizes under the indicator settings to match your trading style and preferences.
Underlying Concepts:
This script utilizes the classic EMA calculation but innovates by integrating dynamic, real-time labels and customizable periods. The choice of four different periods allows for a nuanced analysis of trend strength and direction, catering to both short-term traders and long-term investors.
Originality and Contribution:
The "Advanced EMA Indicator with Dynamic Labels" is original in its approach to providing real-time, actionable data through dynamic labels. It caters to the community's need for more interactive and informative indicators that go beyond basic trend analysis.
Conclusion:
Whether you're a novice trader seeking to understand market trends or an experienced investor looking for nuanced analysis tools, this script offers valuable insights and flexibility. It stands as a testament to the power of Pine Script in creating practical, user-centric trading tools.
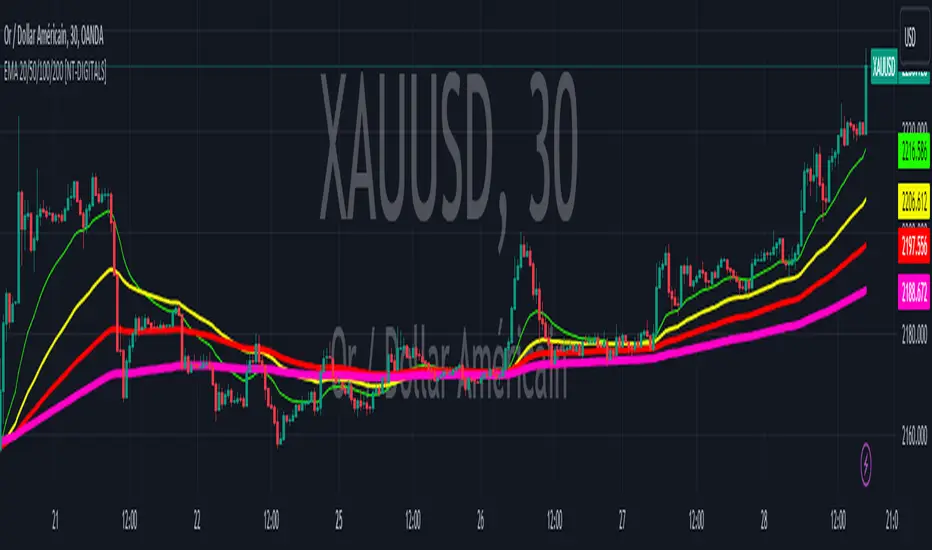
EMA 20/50/100/200 [NT-DIGITALS]This script plots Exponential Moving Averages (EMA) of 20, 50, 100, and 200 periods on the chart. EMAs are commonly used by traders to identify trends and potential reversal points in the market. The EMA smooths out price data to create a single line that follows the overall trend more closely than a simple moving average. By plotting multiple EMAs of different periods, traders can observe the interaction between short-term and long-term trends, aiding in decision-making for entry and exit points.
Exponential Moving Average (EMA) is a type of moving average that gives more weight to recent price data, making it more responsive to current price movements compared to a simple moving average (SMA). The EMA is calculated by applying a smoothing factor to the previous EMA value and adding a fraction of the difference between the current price and the previous EMA value. This weighting mechanism results in EMAs reacting more quickly to price changes, making them popular for traders looking to capture short-term trends in the market.
Conceptive Price Moving Average [CSM]The Conceptive Price Moving Average (CPMA) is a technical indicator designed to provide a more accurate moving average of the price by using the average of various price types, such as open, close, high, low, etc. The CPMA can help to smooth out the noise and provide a clearer picture of the overall trend by taking the average of the last 3 candles for each price type and then calculating the average of those averages.
To use the CPMA for generating buy/sell signals, you can look for crossovers of the CPMA and other commonly used moving averages, such as the 9-period EMA, 20-period EMA, 50-period EMA, 100-period EMA, and 200-period EMA, which are also plotted on the chart. When the CPMA crosses above a shorter-term moving average, such as the 9-period EMA or 20-period EMA, it can indicate a potential buy opportunity, while when the CPMA crosses below a shorter-term moving average, it can indicate a potential sell opportunity.
Based on my analysis of BankNifty and Nifty, I have found that the CPMA works best at a length of 21, showing good resistance and support for stocks. Therefore, I recommend using a length of 21 when using the CPMA for generating buy/sell signals.

nifty gann & 100 levelsnifty gannlevels with 100 points defference
gann levels with manual entry of cuurent gann level
manual entry of diffeence between two gann levels

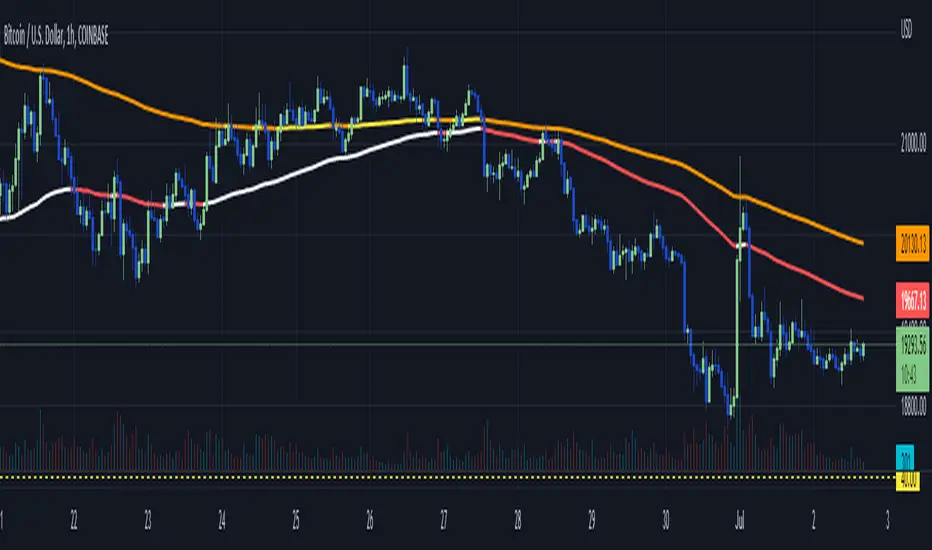
WhiteFang 100 / 200 EMA ColorFlipThis script combines the 100 and 200 EMA and exhibits colour changes ("colour flip") at price action crosses.
The intention here is to create an "at a glance trend indicator" to allow quick and accurate stock, forex and crypto screening prior to selecting targets for entry.
For example I find it prudent to select long when the PA is above both the White (100EMA) and Yellow (200EMA) - conversely selecting short when below Red (100EMA) and Orange (200EAM).
Other attributes:
- Multi timeframe compatible
- Easily to spot:
- golden cross = (white crossing over yellow), and
- Death cross ( red crossing below orange)
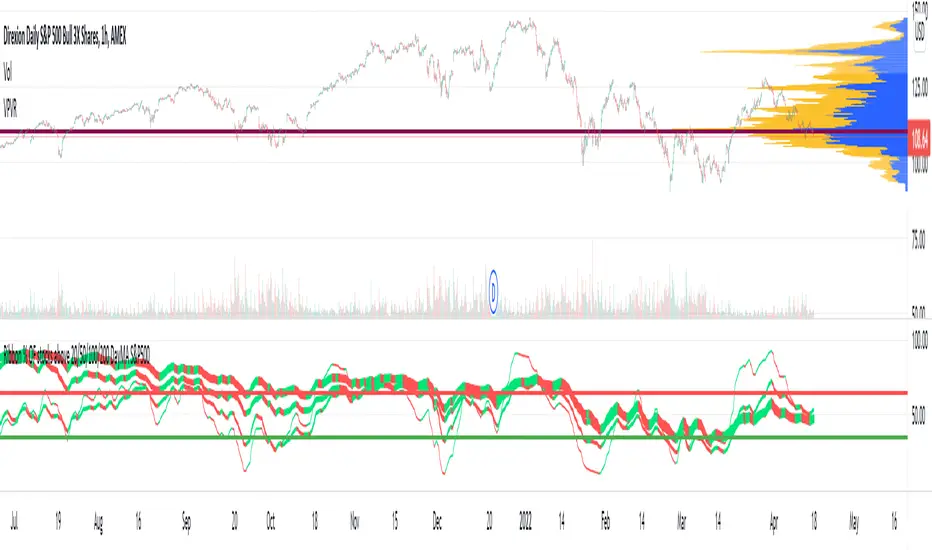
Ribbon % OF stocks above 20/50/100/200 DayMA S&P500Moving average ribbon of % stocks above 20/50/100/200 Day moving average in th S&P500. Directional color. Pretty good indicator for big bottoms. Tops - not so much. use 1D timeframe.

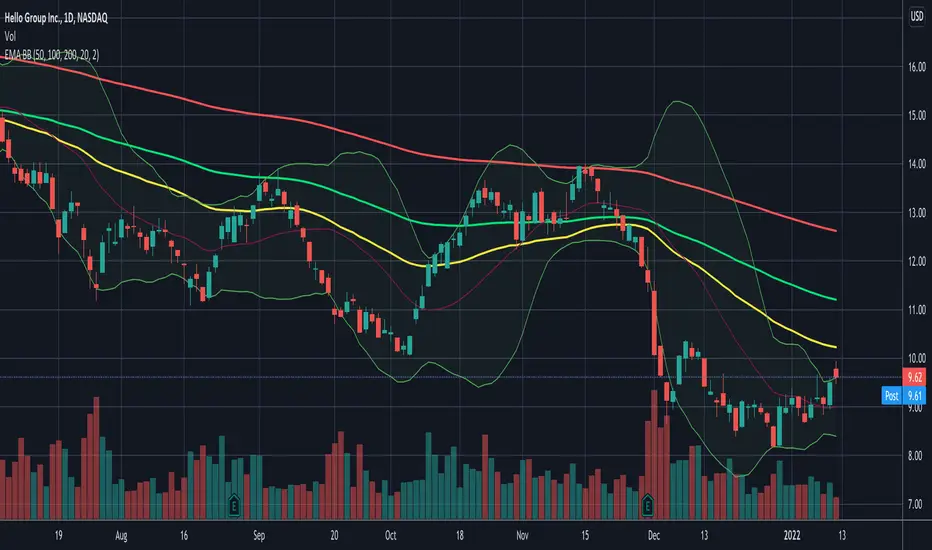
Daily EMA50 100 200 + BBStandard Bollinger Bands (timeframe dependent), period and standard deviation are configurable.
And standard daily triple EMA (timeframe independent). Short, Medium and Long periods are configurable (50/100/200 by default)
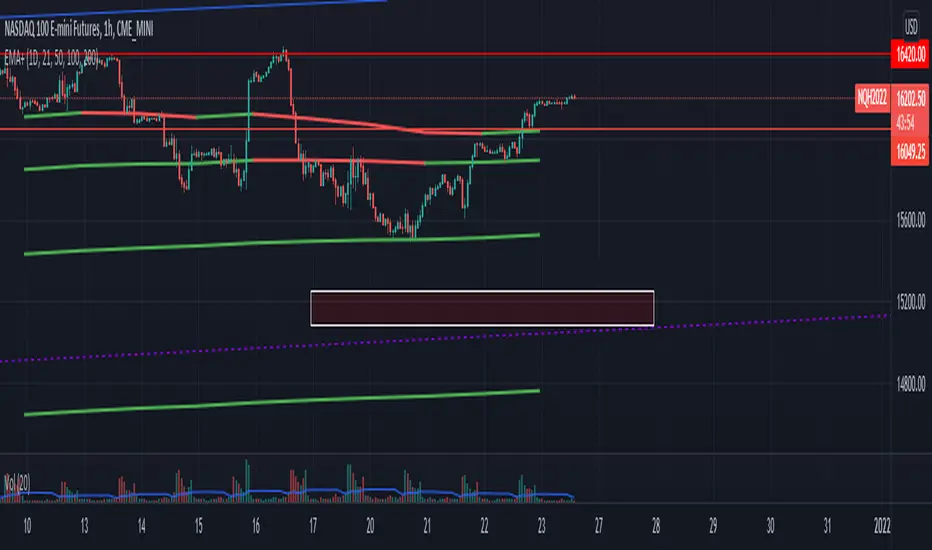
Higher Timeframe EMAs - 21/50/100/200This script lets you draw the 21/50/100/200 EMAs of the daily (or hourly) timeframe on lower time frames.
This was modified from :
@ZenAndTheArtOfTrading
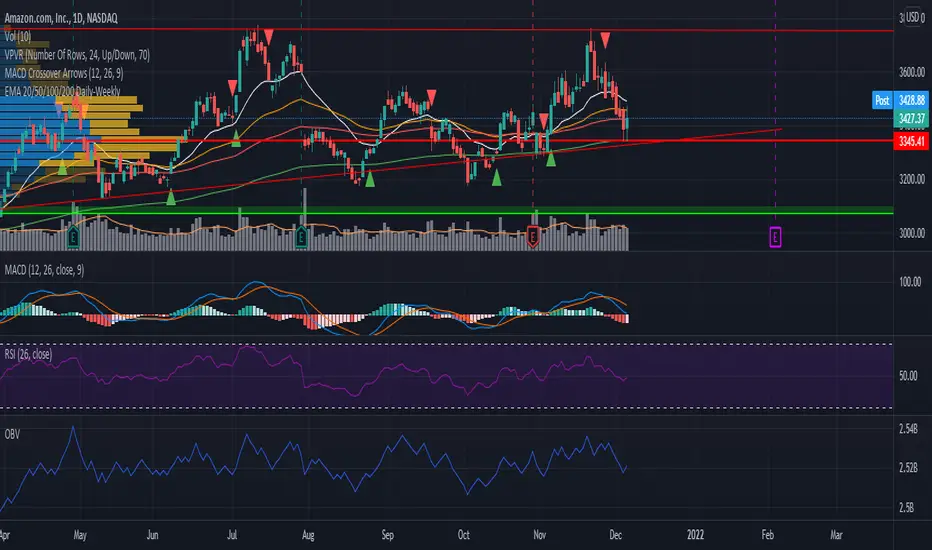
EMA 20/50/100/200 Daily-WeeklyHello!
In case this helps others when using EMA's on multiple timeframes, I decided to publish this script I modified.
It adds the EMA for 20/50/100/200 timeframes and gives them the color white, orange, red, green respectively.
The weekly timeframe will get the corresponding weekly EMA.
The monthly timeframe will get the corresponding monthly EMA.
The daily timeframe, and all timeframes below this, will get the daily timeframe. The idea that that a ticker symbol might respect with strength the daily EMA's - you'll be able to move to a smaller timeframe and still view the daily EMA's in an effort to better view how close the ticker came to taking a specific EMA.