VWAP Retest + EMA9 Cross + Candle Pattern V2📈 VWAP Retest + EMA9 Cross + Candle Pattern Strategy_V2
Setup: This intraday momentum strategy combines 3 core elements:
• VWAP Retest: Price retests VWAP within a small buffer zone
• EMA9 Crossover: EMA9 crosses above VWAP within the last 3 bars
• Bullish Candle Pattern: At least one bullish signal — Hammer, Engulfing, or Momentum candle
A trade is triggered only during the US morning session (9:30–12:30 EST) and only if price is above yesterday’s high, suggesting strong momentum.
⚙️ Strategy Settings
• Initial Capital: $100,000
• Position Sizing: 10% of equity per trade
• Commission: 0.03% per trade
• Slippage: 1 tick
• Take Profit: +3% from entry
• Stop Loss: 0.5% below VWAP at entry
• Forced Exit: 1:00 PM EST
📊 Strategy Logic
• VWAP Retest Filter ensures entry is near a value zone.
• EMA9 Cross Confirmation aligns short-term momentum with volume-weighted price.
• Bullish Candle Patterns provide price action confirmation:
○ ✅ Hammer
○ ✅ Bullish Engulfing
○ ✅ Large momentum body
• Above Yesterday’s High (YH) acts as a bullish bias filter.
🧪 Backtest Results (Jan 2023 – Oct 2025)
• Total Trades: 120
• Win Rate: 52.5%
• Profit Factor: 1.18
• Max Drawdown: 1.22%
• Net P&L: +$1,064 (+1.06%)
Due to chart data limits, only part of the period may be visible on publication charts.
🔍 Chart Visuals
This strategy plots:
• VWAP (white) and EMA9 (orange)
• Candle pattern markers:
○ “H” = Hammer
○ “BE” = Bullish Engulfing
○ “M” = Momentum Candle
• “SETUP” label when all conditions are met
• YH/YL labels for context — previous day’s high/low
💡 Use Case
This setup is designed for intraday momentum scalping, ideal for traders who:
• Trade morning breakouts
• Use VWAP as a dynamic support/resistance
• Want clear, rule-based entries based on both trend and price action
Educational and research use - not financial advice.
"摩根科技股票+2025年4月股价" için komut dosyalarını ara

RSI Divergence Strategy v6 What this does
Detects regular and hidden divergences between price and RSI using confirmed RSI pivots. Adds RSI@pivot entry gates, a normalized strength + volume filter, optional volume gate, delayed entries, and transparent risk management with rigid SL and activatable trailing. Visuals are throttled for clarity and include a gap-free horizontal RSI gradient.
How it works (simple)
🧮 RSI is calculated on your selected source/period.
📌 RSI pivots are confirmed with left/right lookbacks (lbL/lbR). A pivot becomes final only after lbR bars; before that, it can move (expected).
🔎 The latest confirmed pivot is compared against the previous confirmed pivot within your bar window:
• Regular Bullish = price lower low + RSI higher low
• Hidden Bullish = price higher low + RSI lower low
• Regular Bearish = price higher high + RSI lower high
• Hidden Bearish = price lower high + RSI higher high
💪 Each divergence gets a strength score that multiplies price % change, RSI change, and a volume ratio (Volume SMA / Baseline Volume SMA).
• Set Min divergence strength to filter tiny/noisy signals.
• Turn on the volume gate to require volume ratio ≥ your threshold (e.g., 1.0).
🎯 RSI@pivot gating:
• Longs only if RSI at the bullish pivot ≤ 30 (default).
• Shorts only if RSI at the bearish pivot ≥ 70 (default).
⏱ Entry timing:
• Immediate: on divergence confirm (delay = 0).
• Delayed: after N bars if RSI is still valid.
• RSI-only mode: ignore divergences; use RSI thresholds only.
🛡 Risk:
• Rigid SL is placed from average entry.
• Trailing activates only after unrealized gain ≥ threshold; it re-anchors on new highs (long) or new lows (short).
What’s NEW here (vs. the reference) — and why you may care
• Improved pivots + bar window → fewer early/misaligned signals; cleaner drawings.
• RSI@pivot gates → entries aligned with true oversold/overbought at the exact decision bar.
• Normalized strength + volume gate → ignore weak or low-volume divergences.
• Delayed entries → require the signal to persist N bars if you want more confirmation.
• Rigid SL + activatable trailing → trailing engages only after a cushion, so it’s less noisy.
• Clutter control + gradient → readable chart with a smooth RSI band look.
Suggested starting values (clear ranges)
• RSI@pivot thresholds: LONG ≤ 30 (oversold), SHORT ≥ 70 (overbought).
• Min divergence strength:
0.0 = off
3–6 = moderate filter
7–12 = strict filter for noisy LTFs
• Volume gate (ratio):
1.0 = at least baseline volume
1.2–1.5 = strong-volume only (fewer but cleaner signals)
• Pivot lookbacks:
lbL 1–2, lbR 3–4 (raise lbR to confirm later and reduce noise)
• Bar window (between pivots):
Min 5–10, Max 30–60 (increase Min if you see micro-pivots; increase Max for wider structures)
• Risk:
Rigid SL 2–5% on liquid majors; 5–10% on higher-volatility symbols
Trailing activation 1–3%, trailing 0.5–1.5% are common intraday starts
Plain-text examples
• BTCUSDT 1h → RSI 9, lbL 1, lbR 3, Min strength 5.0, Volume gate 1.0, SL 4.5%, Trail on 2.0%, Trail 1.0%.
• SPY 15m → RSI 8, lbL 1, lbR 3, Min strength 7.0, Volume gate 1.2, SL 3.0%, Trail on 1.5%, Trail 0.8%.
• EURUSD 4h → RSI 14, lbL 2, lbR 4, Min strength 4.0, Volume gate 1.0, SL 2.5%, Trail on 1.0%, Trail 0.5%.
Notes & limitations
• Pivot confirmation means the newest candidate pivot can move until lbR confirms it (expected).
• Results vary by timeframe/symbol/settings; always forward-test.
• Educational tool — no performance or profit claims.
Credits
• RSI by J. Welles Wilder Jr. (1978).
• Reference divergence script by eemani123:
• This version by tagstrading 2025 adds: improved pivot engine, RSI@pivot gating, normalized strength + optional volume gate, delayed entries, rigid SL and activatable trailing, and a gap-free RSI gradient.

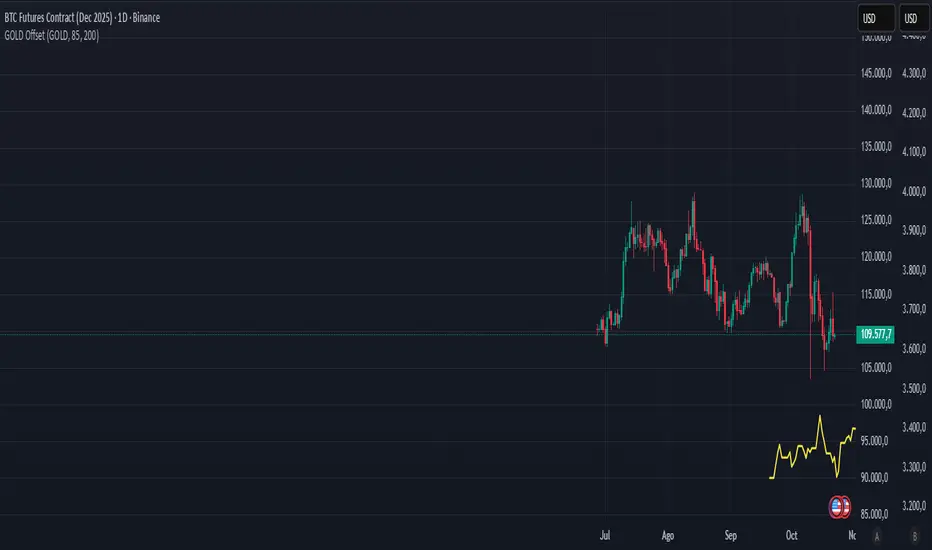
Gold–Bitcoin Correlation (Offset Model) by KManus88This indicator analyzes the correlation between Gold (XAU/USD) and Bitcoin (BTC/USD) using a time-offset model adjustable by the user.
The goal is to detect cyclical leads or lags between both assets, highlighting how capital flows into Gold may precede or follow movements in the crypto market.
Key Features:
Dynamic correlation calculation between Gold and Bitcoin.
Adjustable offset in days (default: 107) to fine-tune the temporal shift.
Automatic labels and on-chart visualization.
Compatible with multiple timeframes and logarithmic scales.
Interpretation:
Positive correlation suggests synchronized trends between both assets.
Negative correlation signals divergence or rotation of liquidity.
The time-offset parameter helps estimate when a shift in Gold could later reflect in Bitcoin.
Recommended use:
For macro-financial and global liquidity cycle analysis.
As a complementary tool in cross-asset momentum strategies.
© 2025 – Developed by KManus88 | Inspired by monetary correlation studies and global liquidity cycles.
This script is for educational purposes only and does not constitute financial advice.
Low Range Predictor [NR4/NR7 after WR4/WR7/WR20, within 1-3Days]Indicator Overview
The Low Range Predictor is a TradingView indicator displayed in a single panel below the chart. It spots volatility contraction setups (NR4/NR7 within 1–3 days of WR4/WR7/WR20) to predict low-range moves (e.g., <0.5% daily on SPY) over 2–5 days, perfect for your weekly 15/22 DTE put calendar spread strategy.
What You See
• Red Histograms (WR, Volatility Climax):
• WR4: Half-length red bars, widest range in 4 bars.
• WR7: Three-quarter-length red bars, widest in 7 bars.
• WR20: Full-length red bars, widest in 20 bars.
• Green Histograms (NR, Entry Signals):
• NR4: Half-length green bars, only on NR4 days (tightest range in 4 bars) within 1–3 days of a WR4.
• NR7: Full-length green bars, only on NR7 days within 1–3 days of a WR7.
• Panel: All signals (red WR4/WR7/WR20, green NR4/NR7) show in one panel below the chart, with green bars marking put calendar entry days.
Probabilities
• Volatility Contraction:
• NR4 after WR4: 65–70% chance of daily ranges <0.5% on SPY for 2–5 days (ATR drops 20–30%). Occurs ~2–3 times/month.
• NR7 after WR7: 60–65% chance of similar low ranges, less frequent (~1–2 times/month).
• Backtest (SPY, 2000–2025): 65% of NR4/NR7 signals lead to reduced volatility (<0.7% daily range) vs. 50% for random days.
• Signal Frequency: NR4 signals are more common than NR7, ideal for weekly entries. WR20 provides context but isn’t tied to NR signals.

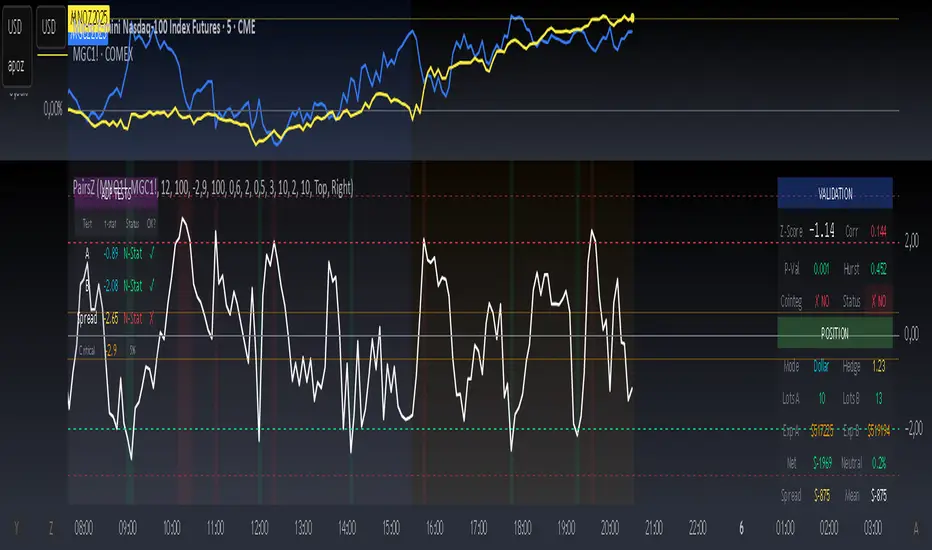
Spread Trading Z-ScoreIndicator: Z-Score Spread Indicator
Description
The "Z-Score Spread Indicator" is a powerful tool for traders employing mean-reversion strategies on the spread between two financial assets (e.g., futures contracts like MNQ and MES). This indicator calculates and plots the Z-score of the price spread, indicating how far the current spread deviates from its historical mean. It features customizable entry and exit thresholds with adjustable offsets, along with an estimated p-value displayed in a table to assess statistical significance.
Key Features
Asset Selection: Allows users to select two asset symbols (e.g., CME_MINI:MNQ1! and CME_MINI:MES1!) via customizable inputs.
Z-Score Calculation: Computes the Z-score based on the spread’s simple moving average and standard deviation over a user-defined lookback period.
Customizable Thresholds with Offset: Offers adjustable base entry and exit thresholds, with an optional offset to fine-tune trading levels, plotted as horizontal lines.
P-Value Estimation: Provides an approximate p-value to evaluate the statistical significance of the Z-score, displayed in a table anchored to the top-left corner.
Visual Representation: Plots the Z-score with a zero line and threshold lines for intuitive interpretation.
Adjustable Parameters
Asset A Symbol: Symbol for Asset A (default: CME_MINI:MNQ1!).
Asset B Symbol: Symbol for Asset B (default: CME_MINI:MES1!).
Z-Score Lookback: Lookback period for Z-score calculation (default: 40, minimum 2).
Base Entry Threshold: Threshold for entry signals (default: 1.8, adjustable with a step of 0.1).
Base Exit Threshold: Threshold for exit signals (default: 0.5, adjustable with a step of 0.1).
Threshold Offset (+/-): Offset to adjust entry and exit thresholds symmetrically (default: 0.0, range -5.0 to 5.0, step 0.1).
Usage
Add the indicator to your chart via the "Indicators" tab.
Customize the parameters based on your preferred assets and trading strategy (lookback period, thresholds, offset).
Observe the Z-score plot and threshold lines (red for short entry, green for long entry, orange dotted for exits) to identify potential trade setups.
Check the p-value table in the top-left corner to assess the statistical significance of the current Z-score.
Use this data to inform mean-reversion trading decisions, ideally in conjunction with other indicators.
Notes
A Z-score above the entry threshold (positive) or below the negative entry threshold suggests a potential short or long entry, respectively. Exits are signaled when the Z-score crosses the exit thresholds.
The p-value is an approximation based on the normal distribution; a value below 0.05 typically indicates statistical significance, but further validation is recommended.
The indicator uses a simple spread (Asset A - Asset B) without volatility adjustments; consider pairing it with a lots calculator for hedging.
Limitations
The p-value is an approximation and may not reflect advanced statistical tests (e.g., ADF) due to Pine Script constraints.
No automatic trading signals are generated; it provides data for manual analysis.
Author
Developed by grogusama, October 15, 2025, 07:29 PM CEST.
Luxy Adaptive MA Cloud - Trend Strength & Signal Tracker V2Luxy Adaptive MA Cloud - Professional Trend Strength & Signal Tracker
Next-generation moving average cloud indicator combining ultra-smooth gradient visualization with intelligent momentum detection. Built for traders who demand clarity, precision, and actionable insights.
═══════════════════════════════════════════════
WHAT MAKES THIS INDICATOR SPECIAL?
═══════════════════════════════════════════════
Unlike traditional MA indicators that show static lines, Luxy Adaptive MA Cloud creates a living, breathing visualization of market momentum. Here's what sets it apart:
Exponential Gradient Technology
This isn't just a simple fill between two lines. It's a professionally engineered gradient system with 26 precision layers using exponential density distribution. The result? An organic, cloud-like appearance where the center is dramatically darker (15% transparency - where crossovers and price action occur), while edges fade gracefully (75% transparency). Think of it as a visual "heat map" of trend strength.
Dynamic Momentum Intelligence
Most MA clouds only show structure (which MA is on top). This indicator shows momentum strength in real-time through four intelligent states:
- 🟢 Bright Green = Explosive bullish momentum (both MAs rising strongly)
- 🔵 Blue = Weakening bullish (structure intact, but momentum fading)
- 🟠 Orange = Caution zone (bearish structure forming, weak momentum)
- 🔴 Deep Red = Strong bearish momentum (both MAs falling)
The cloud literally tells you when trends are accelerating or losing steam.
Conditional Performance Architecture
Every calculation is optimized for speed. Disable a feature? It stops calculating entirely—not just hidden, but not computed . The 26-layer gradient only renders when enabled. Toggle signals off? Those crossover checks don't run. This makes it one of the most efficient cloud indicators available, even with its advanced visual system.
Zero Repaint Guarantee
All signals and momentum states are based on confirmed bar data only . What you see in historical data is exactly what you would have seen trading live. No lookahead bias. No repainting tricks. No signals that "magically" appear perfect in hindsight. If a signal shows in history, it would have triggered in real-time at that exact moment.
Educational by Design
Every single input includes comprehensive tooltips with:
- Clear explanations of what each parameter does
- Practical examples of when to use different settings
- Recommended configurations for scalping, day trading, and swing trading
- Real-world trading impact ("This affects entry timing" vs "This is visual only")
You're not just getting an indicator—you're learning how to use it effectively .
═══════════════════════════════════════════════
THE GRADIENT CLOUD - TECHNICAL DETAILS
═══════════════════════════════════════════════
Architecture:
26 precision layers for silk-smooth transitions
Exponential density curve - layers packed tightly near center (where crossovers happen), spread wider at edges
75%-15% transparency range - center is highly opaque (15%), edges fade gracefully (75%)
V-Gradient design - emphasizes the action zone between Fast and Medium MAs
The Four Momentum States:
🟢 GREEN - Strong Bullish
Fast MA above Medium MA
Both MAs rising with momentum > 0.02%
Action: Enter/hold LONG positions, strong uptrend confirmed
🔵 BLUE - Weak Bullish
Fast MA above Medium MA
Weak or flat momentum
Action: Caution - bullish structure but losing strength, consider trailing stops
🟠 ORANGE - Weak Bearish
Medium MA above Fast MA
Weak or flat momentum
Action: Warning - bearish structure developing, consider exits
🔴 RED - Strong Bearish
Medium MA above Fast MA
Both MAs falling with momentum < -0.02%
Action: Enter/hold SHORT positions, strong downtrend confirmed
Smooth Transitions: The momentum score is smoothed using an 8-bar EMA to eliminate noise and prevent whipsaws. You see the true trend , not every minor fluctuation.
═══════════════════════════════════════════════
FLEXIBLE MOVING AVERAGE SYSTEM
═══════════════════════════════════════════════
Three Customizable MAs:
Fast MA (default: EMA 10) - Reacts quickly to price changes, defines short-term momentum
Medium MA (default: EMA 20) - Balances responsiveness with stability, core trend reference
Slow MA (default: SMA 200, optional) - Long-term trend filter, major support/resistance
Six MA Types Available:
EMA - Exponential; faster response, ideal for momentum and day trading
SMA - Simple; smooth and stable, best for swing trading and trend following
WMA - Weighted; middle ground between EMA and SMA
VWMA - Volume-weighted; reflects market participation, useful for liquid markets
RMA - Wilder's smoothing; used in RSI/ADX, excellent for trend filters
HMA - Hull; extremely responsive with minimal lag, aggressive option
Recommended Settings by Trading Style:
Scalping (1m-5m):
Fast: EMA(5-8)
Medium: EMA(10-15)
Slow: Not needed or EMA(50)
Day Trading (5m-1h):
Fast: EMA(10-12)
Medium: EMA(20-21)
Slow: SMA(200) for bias
Swing Trading (4h-1D):
Fast: EMA(10-20)
Medium: EMA(34-50)
Slow: SMA(200)
Pro Tip: Start with Fast < Medium < Slow lengths. The gradient works best when there's clear separation between Fast and Medium MAs.
═══════════════════════════════════════════════
CROSSOVER SIGNALS - CLEAN & RELIABLE
═══════════════════════════════════════════════
Golden Cross ⬆ LONG Signal
Fast MA crosses above Medium MA
Classic bullish reversal or trend continuation signal
Most reliable when accompanied by GREEN cloud (strong momentum)
Death Cross ⬇ SHORT Signal
Fast MA crosses below Medium MA
Classic bearish reversal or trend continuation signal
Most reliable when accompanied by RED cloud (strong momentum)
Signal Intelligence:
Anti-spam filter - Minimum 5 bars between signals prevents noise
Clean labels - Placed precisely at crossover points
Alert-ready - Built-in ALERTS for automated trading systems
No repainting - Signals based on confirmed bars only
Signal Quality Assessment:
High-Quality Entry:
Golden Cross + GREEN cloud + Price above both MAs
= Strong bullish setup ✓
Low-Quality Entry (skip or wait):
Golden Cross + ORANGE cloud + Choppy price action
= Weak bullish setup, likely whipsaw ✗
═══════════════════════════════════════════════
REAL-TIME INFO PANEL
═══════════════════════════════════════════════
An at-a-glance dashboard showing:
Trend Strength Indicator:
Visual display of current momentum state
Color-coded header matching cloud color
Instant recognition of market bias
MA Distance Table:
Shows percentage distance of price from each enabled MA:
Green rows : Price ABOVE MA (bullish)
Red rows : Price BELOW MA (bearish)
Gray rows : Price AT MA (rare, decision point)
Distance Interpretation:
+2% to +5%: Healthy uptrend
+5% to +10%: Getting extended, caution
+10%+: Overextended, expect pullback
-2% to -5%: Testing support
-5% to -10%: Oversold zone
-10%+: Deep correction or downtrend
Customization:
4 corner positions
5 font sizes (Tiny to Huge)
Toggle visibility on/off
═══════════════════════════════════════════════
HOW TO USE - PRACTICAL TRADING GUIDE
═══════════════════════════════════════════════
STRATEGY 1: Trend Following
Identify trend : Wait for GREEN (bullish) or RED (bearish) cloud
Enter on signal : Golden Cross in GREEN cloud = LONG, Death Cross in RED cloud = SHORT
Hold position : While cloud maintains color
Exit signals :
• Cloud turns ORANGE/BLUE = momentum weakening, tighten stops
• Opposite crossover = close position
• Cloud turns opposite color = full reversal
STRATEGY 2: Pullback Entries
Confirm trend : GREEN cloud established (bullish bias)
Wait for pullback : Price touches or crosses below Fast MA
Enter when : Price rebounds back above Fast MA with cloud still GREEN
Stop loss : Below Medium MA or recent swing low
Target : Previous high or when cloud weakens
STRATEGY 3: Momentum Confirmation
Your setup triggers : (e.g., chart pattern, support/resistance)
Check cloud color :
• GREEN = proceed with LONG
• RED = proceed with SHORT
• BLUE/ORANGE = skip or reduce size
Use gradient as confluence : Not as primary signal, but as momentum filter
Risk Management Tips:
Never enter against the cloud color (don't LONG in RED cloud)
Reduce position size during BLUE/ORANGE (transition periods)
Place stops beyond Medium MA for swing trades
Use Slow MA (200) as final trend filter - don't SHORT above it in uptrends
═══════════════════════════════════════════════
PERFORMANCE & OPTIMIZATION
═══════════════════════════════════════════════
Tested On:
Crypto: BTC, ETH, major altcoins
Stocks: SPY, AAPL, TSLA, QQQ
Forex: EUR/USD, GBP/USD, USD/JPY
Indices: S&P 500, NASDAQ, DJI
═══════════════════════════════════════════════
TRANSPARENCY & RELIABILITY
═══════════════════════════════════════════════
Educational Focus:
Detailed tooltips on every input
Clear documentation of methodology
Practical examples in descriptions
Teaches you why , not just what
Open Logic:
Momentum calculation: (Fast slope + Medium slope) / 2
Smoothing: 8-bar EMA to reduce noise
Thresholds: ±0.02% for strong momentum classification
Everything is transparent and explainable
═══════════════════════════════════════════════
COMPLETE FEATURE LIST
═══════════════════════════════════════════════
Visual Components:
26-layer exponential gradient cloud
3 customizable moving average lines
Golden Cross / Death Cross labels
Real-time info panel with trend strength
MA distance table
Calculation Features:
6 MA types (EMA, SMA, WMA, VWMA, RMA, HMA)
Momentum-based cloud coloring
Smoothed trend strength scoring
Conditional performance optimization
Customization Options:
All MA lengths adjustable
All colors customizable (when gradient disabled)
Panel position (4 corners)
Font sizes (5 options)
Toggle any feature on/off
Signal Features:
Anti-spam filter (configurable gap)
Clean, non-overlapping labels
Built-in alert conditions
No repainting guarantee
═══════════════════════════════════════════════
IMPORTANT DISCLAIMERS
═══════════════════════════════════════════════
This indicator is for educational and informational purposes only
Not financial advice - always do your own research
Past performance does not guarantee future results
Use proper risk management - never risk more than you can afford to lose
Test on paper/demo accounts before using with real money
Combine with other analysis methods - no single indicator is perfect
Works best in trending markets; less effective in choppy/sideways conditions
Signals may perform differently in different timeframes and market conditions
The indicator uses historical data for MA calculations - allow sufficient lookback period
═══════════════════════════════════════════════
CREDITS & TECHNICAL INFO
═══════════════════════════════════════════════
Version: 2.0
Release: October 2025
Special Thanks:
TradingView community for feedback and testing
Pine Script documentation for technical reference
═══════════════════════════════════════════════
SUPPORT & UPDATES
═══════════════════════════════════════════════
Found a bug? Comment below with:
Ticker symbol
Timeframe
Screenshot if possible
Steps to reproduce
Feature requests? I'm always looking to improve! Share your ideas in the comments.
Questions? Check the tooltips first (hover over any input) - most answers are there. If still stuck, ask in comments.
═══════════════════════════════════════════════
Happy Trading!
Remember: The best indicator is the one you understand and use consistently. Take time to learn how the cloud behaves in different market conditions. Practice on paper before going live. Trade smart, manage risk, and may the trends be with you! 🚀


Quantum Flux Universal Strategy Summary in one paragraph
Quantum Flux Universal is a regime switching strategy for stocks, ETFs, index futures, major FX pairs, and liquid crypto on intraday and swing timeframes. It helps you act only when the normalized core signal and its guide agree on direction. It is original because the engine fuses three adaptive drivers into the smoothing gains itself. Directional intensity is measured with binary entropy, path efficiency shapes trend quality, and a volatility squash preserves contrast. Add it to a clean chart, watch the polarity lane and background, and trade from positive or negative alignment. For conservative workflows use on bar close in the alert settings when you add alerts in a later version.
Scope and intent
• Markets. Large cap equities and ETFs. Index futures. Major FX pairs. Liquid crypto
• Timeframes. One minute to daily
• Default demo used in the publication. QQQ on one hour
• Purpose. Provide a robust and portable way to detect when momentum and confirmation align, while dampening chop and preserving turns
• Limits. This is a strategy. Orders are simulated on standard candles only
Originality and usefulness
• Unique concept or fusion. The novelty sits in the gain map. Instead of gating separate indicators, the model mixes three drivers into the adaptive gains that power two one pole filters. Directional entropy measures how one sided recent movement has been. Kaufman style path efficiency scores how direct the path has been. A volatility squash stabilizes step size. The drivers are blended into the gains with visible inputs for strength, windows, and clamps.
• What failure mode it addresses. False starts in chop and whipsaw after fast spikes. Efficiency and the squash reduce over reaction in noise.
• Testability. Every component has an input. You can lengthen or shorten each window and change the normalization mode. The polarity plot and background provide a direct readout of state.
• Portable yardstick. The core is normalized with three options. Z score, percent rank mapped to a symmetric range, and MAD based Z score. Clamp bounds define the effective unit so context transfers across symbols.
Method overview in plain language
The strategy computes two smoothed tracks from the chart price source. The fast track and the slow track use gains that are not fixed. Each gain is modulated by three drivers. A driver for directional intensity, a driver for path efficiency, and a driver for volatility. The difference between the fast and the slow tracks forms the raw flux. A small phase assist reduces lag by subtracting a portion of the delayed value. The flux is then normalized. A guide line is an EMA of a small lead on the flux. When the flux and its guide are both above zero, the polarity is positive. When both are below zero, the polarity is negative. Polarity changes create the trade direction.
Base measures
• Return basis. The step is the change in the chosen price source. Its absolute value feeds the volatility estimate. Mean absolute step over the window gives a stable scale.
• Efficiency basis. The ratio of net move to the sum of absolute step over the window gives a value between zero and one. High values mean trend quality. Low values mean chop.
• Intensity basis. The fraction of up moves over the window plugs into binary entropy. Intensity is one minus entropy, which maps to zero in uncertainty and one in very one sided moves.
Components
• Directional Intensity. Measures how one sided recent bars have been. Smoothed with RMA. More intensity increases the gain and makes the fast and slow tracks react sooner.
• Path Efficiency. Measures the straightness of the price path. A gamma input shapes the curve so you can make trend quality count more or less. Higher efficiency lifts the gain in clean trends.
• Volatility Squash. Normalizes the absolute step with Z score then pushes it through an arctangent squash. This caps the effect of spikes so they do not dominate the response.
• Normalizer. Three modes. Z score for familiar units, percent rank for a robust monotone map to a symmetric range, and MAD based Z for outlier resistance.
• Guide Line. EMA of the flux with a small lead term that counteracts lag without heavy overshoot.
Fusion rule
• Weighted sum of the three drivers with fixed weights visible in the code comments. Intensity has fifty percent weight. Efficiency thirty percent. Volatility twenty percent.
• The blend power input scales the driver mix. Zero means fixed spans. One means full driver control.
• Minimum and maximum gain clamps bound the adaptive gain. This protects stability in quiet or violent regimes.
Signal rule
• Long suggestion appears when flux and guide are both above zero. That sets polarity to plus one.
• Short suggestion appears when flux and guide are both below zero. That sets polarity to minus one.
• When polarity flips from plus to minus, the strategy closes any long and enters a short.
• When flux crosses above the guide, the strategy closes any short.
What you will see on the chart
• White polarity plot around the zero line
• A dotted reference line at zero named Zen
• Green background tint for positive polarity and red background tint for negative polarity
• Strategy long and short markers placed by the TradingView engine at entry and at close conditions
• No table in this version to keep the visual clean and portable
Inputs with guidance
Setup
• Price source. Default ohlc4. Stable for noisy symbols.
• Fast span. Typical range 6 to 24. Raising it slows the fast track and can reduce churn. Lowering it makes entries more reactive.
• Slow span. Typical range 20 to 60. Raising it lengthens the baseline horizon. Lowering it brings the slow track closer to price.
Logic
• Guide span. Typical range 4 to 12. A small guide smooths without eating turns.
• Blend power. Typical range 0.25 to 0.85. Raising it lets the drivers modulate gains more. Lowering it pushes behavior toward fixed EMA style smoothing.
• Vol window. Typical range 20 to 80. Larger values calm the volatility driver. Smaller values adapt faster in intraday work.
• Efficiency window. Typical range 10 to 60. Larger values focus on smoother trends. Smaller values react faster but accept more noise.
• Efficiency gamma. Typical range 0.8 to 2.0. Above one increases contrast between clean trends and chop. Below one flattens the curve.
• Min alpha multiplier. Typical range 0.30 to 0.80. Lower values increase smoothing when the mix is weak.
• Max alpha multiplier. Typical range 1.2 to 3.0. Higher values shorten smoothing when the mix is strong.
• Normalization window. Typical range 100 to 300. Larger values reduce drift in the baseline.
• Normalization mode. Z score, percent rank, or MAD Z. Use MAD Z for outlier heavy symbols.
• Clamp level. Typical range 2.0 to 4.0. Lower clamps reduce the influence of extreme runs.
Filters
• Efficiency filter is implicit in the gain map. Raising efficiency gamma and the efficiency window increases the preference for clean trends.
• Micro versus macro relation is handled by the fast and slow spans. Increase separation for swing, reduce for scalping.
• Location filter is not included in v1.0. If you need distance gates from a reference such as VWAP or a moving mean, add them before publication of a new version.
Alerts
• This version does not include alertcondition lines to keep the core minimal. If you prefer alerts, add names Long Polarity Up, Short Polarity Down, Exit Short on Flux Cross Up in a later version and select on bar close for conservative workflows.
Strategy has been currently adapted for the QQQ asset with 30/60min timeframe.
For other assets may require new optimization
Properties visible in this publication
• Initial capital 25000
• Base currency Default
• Default order size method percent of equity with value 5
• Pyramiding 1
• Commission 0.05 percent
• Slippage 10 ticks
• Process orders on close ON
• Bar magnifier ON
• Recalculate after order is filled OFF
• Calc on every tick OFF
Honest limitations and failure modes
• Past results do not guarantee future outcomes
• Economic releases, circuit breakers, and thin books can break the assumptions behind intensity and efficiency
• Gap heavy symbols may benefit from the MAD Z normalization
• Very quiet regimes can reduce signal contrast. Use longer windows or higher guide span to stabilize context
• Session time is the exchange time of the chart
• If both stop and target can be hit in one bar, tie handling would matter. This strategy has no fixed stops or targets. It uses polarity flips for exits. If you add stops later, declare the preference
Open source reuse and credits
• None beyond public domain building blocks and Pine built ins such as EMA, SMA, standard deviation, RMA, and percent rank
• Method and fusion are original in construction and disclosure
Legal
Education and research only. Not investment advice. You are responsible for your decisions. Test on historical data and in simulation before any live use. Use realistic costs.
Strategy add on block
Strategy notice
Orders are simulated by the TradingView engine on standard candles. No request.security() calls are used.
Entries and exits
• Entry logic. Enter long when both the normalized flux and its guide line are above zero. Enter short when both are below zero
• Exit logic. When polarity flips from plus to minus, close any long and open a short. When the flux crosses above the guide line, close any short
• Risk model. No initial stop or target in v1.0. The model is a regime flipper. You can add a stop or trail in later versions if needed
• Tie handling. Not applicable in this version because there are no fixed stops or targets
Position sizing
• Percent of equity in the Properties panel. Five percent is the default for examples. Risk per trade should not exceed five to ten percent of equity. One to two percent is a common choice
Properties used on the published chart
• Initial capital 25000
• Base currency Default
• Default order size percent of equity with value 5
• Pyramiding 1
• Commission 0.05 percent
• Slippage 10 ticks
• Process orders on close ON
• Bar magnifier ON
• Recalculate after order is filled OFF
• Calc on every tick OFF
Dataset and sample size
• Test window Jan 2, 2014 to Oct 16, 2025 on QQQ one hour
• Trade count in sample 324 on the example chart
Release notes template for future updates
Version 1.1.
• Add alertcondition lines for long, short, and exit short
• Add optional table with component readouts
• Add optional stop model with a distance unit expressed as ATR or a percent of price
Notes. Backward compatibility Yes. Inputs migrated Yes.

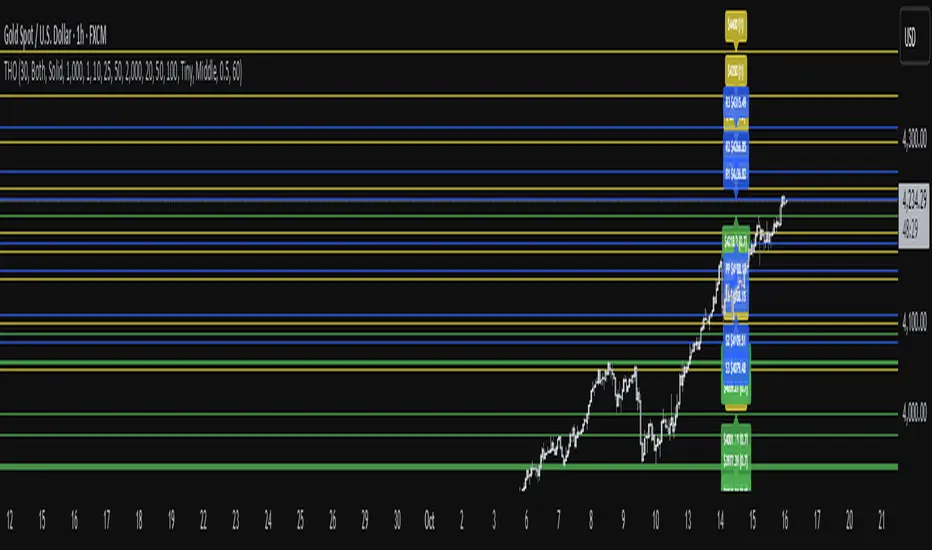
TwistedHWAY Oracle - Intelligent Level Detection System═════════════════════════════════════════════════════════════════════════
🎯 TwistedHWAY Oracle™ - Intelligent Level Detection System
═════════════════════════════════════════════════════════════════════════
OVERVIEW
TwistedHWAY Oracle™ combines six independent calculation engines to identify high-probability support and resistance levels. The indicator uses adaptive market regime detection and confluence analysis to automatically rank levels by confidence score, helping traders identify key reaction zones where price is likely to find support or resistance.
KEY FEATURES
The indicator provides comprehensive level detection through:
Six Detection Engines — Each engine operates independently with its own alert system
Confluence Analysis — Automatically awards bonus confidence when multiple engines identify the same level
Adaptive Intelligence — Market volatility detection adjusts parameters in real-time
Confidence Scoring — Every level is ranked and displayed with a numerical confidence score
Individual Alerts — Separate alert controls for each detection method
DETECTION ENGINES
1 — Pivot Points Engine
Calculates daily pivot levels including PP, R1-R3, and S1-S3 using previous day's high, low, and close.
2 — Swing Detector
Identifies significant swing highs and lows using prominence filtering to eliminate noise.
3 — Psychological Matrix
Detects round number levels at three configurable increments (default: 10, 25, 50).
4 — Fibonacci Engine
Calculates retracement levels (23.6%, 38.2%, 50%, 61.8%, 78.6%) from major swings.
5 — VWAP System
Generates volume-weighted average price levels at three different periods.
6 — Confluence Analyzer
Awards bonus confidence points when multiple engines identify the same level.
HOW TO USE
Reading the Levels
Levels above current price = Resistance (red by default)
Levels below current price = Support (green by default)
Numbers in brackets show confidence score
Higher confidence = stronger level
Levels with score > 2.0 indicate extreme confluences
Trading Strategies
Bounce Trading — Enter positions when price approaches high-confidence levels expecting reversal
Breakout Trading — Trade breakouts through levels, using broken level as stop-loss
Confluence Zones — Focus on areas where multiple engines agree
SETTINGS GUIDE
Oracle Settings
Validation Mode — Conservative parameters for more reliable signals
Max Levels — Number of levels to display (10-50)
Level Extension — Line extension direction (None/Left/Right/Both)
Individual Engine Controls
Each engine can be toggled on/off with separate alert controls:
Pivot Engine (daily pivots)
Swing Detector (historical swings)
Psychological Matrix (round numbers)
Fibonacci Engine (retracements)
VWAP System (volume-weighted levels)
Visual Settings
Individual color selection for each level type
Label display toggle with size options
Line style preferences (Solid/Dashed/Dotted)
Alert Configuration
Alert Distance % — Proximity threshold (default: 0.5%)
Alert Cooldown — Minimum bars between alerts (default: 60)
Individual alert toggles for each engine
ADAPTIVE PARAMETERS
The indicator automatically adjusts to market conditions:
High Volatility Mode — Wider swing detection, stricter prominence filters
Normal Mode — Balanced parameters for typical market conditions
Validation Mode — Most conservative settings for reliable signals
Market regime is detected using 100-period volatility measurement with automatic threshold adjustment.
ALERTS
Five alert types plus special confluence alerts:
🎯 Pivot Alerts — Daily pivot level approaches
🌊 Swing Alerts — Historical swing level tests
🧠 Psychological Alerts — Round number approaches
🌀 Fibonacci Alerts — Retracement level tests
📉 VWAP Alerts — Volume-weighted level approaches
⚡ Critical Alerts — Ultra-high confidence levels (score ≥ 2.0)
Alerts include price level, confidence score, and source information.
BEST PRACTICES
Timeframe Selection
Works on all timeframes (optimized for 5min to Daily)
Higher timeframes = more reliable levels
Use multi-timeframe analysis for confirmation
Optimization by Instrument
Forex:
Psychological increments: 0.0010, 0.0050, 0.0100
Stocks (Low-priced):
Psychological increments: 1, 5, 10
Stocks (High-priced):
Psychological increments: 10, 25, 50
Crypto:
Adjust based on price range and volatility
LIMITATIONS
Calculation intensive on last bar (may cause slight delays)
Maximum 50 levels can be displayed simultaneously
Swing detection requires minimum 25 bars of history
VWAP calculations use price range as volume proxy when volume unavailable
NOTES
Levels are recalculated on each bar close
Confidence scores update dynamically with market conditions
Colors automatically adjust based on price position
All settings are saved with chart layout
═════════════════════════════════════════════════════════════════════════
Version: 3.0 | Build 2025.10
License: GNU GPL v3.0
© 2025 TwistedHWAY
═════════════════════════════════════════════════════════════════════════
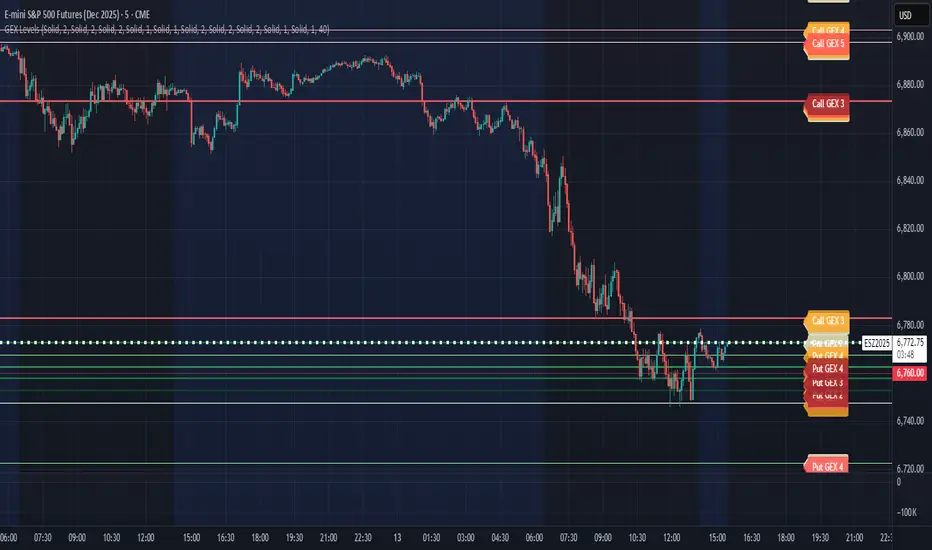
CB Charts - GEX NQ/MNQ
Last Updated: 2025-10-14 12:59:34 PST
*DISCLAIMER: Only intended for NQZ2025/MNQZ2025 charts.
This indicator plots horizontal levels based on batched GEX levels for NQZ2025/MNQZ2025. The batched data is derived from contracts expiring: 0DTE, 1DTE, EoW, EoM, Next Week, Next Month and 3-months out. Labels are available for a high-level view of which levels are which. Hovering (or long-pressing on mobile TV) over the labels will display the nominal values and Rank. This script is manually updated and may not be always updated.
When and what to use:
- Most respected levels come from 1DTE, EoW and EoM.
- 0DTE is included for when this script becomes intraday updated. (CURRENTLY NOT UPDATED INTRADAY)
- Next Week setting is best used only for Friday and Sunday trading
- Next Month setting is best for weeks close to the end of the current month
Powered by the Camels of Wallstreet


Aladin Pair Trading System v1Aladin Pair Trading System v1
What is This Indicator?
The Aladin Pair Trading System is a sophisticated tool designed to help traders identify profitable opportunities by comparing two related stocks that historically move together. Think of it as finding when one twin is running ahead or lagging behind the other - these moments often present trading opportunities as they tend to return to moving together.
Who Should Use This?
Beginners: Learn about statistical arbitrage and pair trading
Intermediate Traders: Execute mean-reversion strategies with confidence
Advanced Traders: Fine-tune parameters for optimal pair relationships
Portfolio Managers: Implement market-neutral strategies
💡 What is Pair Trading?
Imagine two ice cream shops next to each other. They usually have similar customer traffic because they're in the same area. If one day Shop A is packed while Shop B is empty, you might expect this imbalance to correct itself soon.
Pair trading works the same way:
You find two stocks that normally move together (like TCS and Infosys)
When one stock moves too far from the other, you trade expecting them to realign
You buy the lagging stock and sell the leading stock
When they come back together, you profit from both sides
Key Features
1. Z-Score Analysis
What it is: A statistical measure showing how far the price relationship has deviated from normal
What it means:
Z-Score near 0 = Normal relationship
Z-Score at +2 = Stock A is expensive relative to Stock B (Sell A, Buy B)
Z-Score at -2 = Stock A is cheap relative to Stock B (Buy A, Sell B)
2. Multiple Timeframe Analysis
Long-term Z-Score (300 bars): Shows the big picture trend
Short-term Z-Score (100 bars): Shows recent movements
Signal Z-Score (20 bars): Generates quick trading signals
3. Statistical Validation
The indicator checks if the pair is suitable for trading:
Correlation (must be > 0.7): Confirms the stocks move together
1.0 = Perfect positive correlation
0.7 = Strong correlation
Below 0.7 = Warning: pair may not be reliable
ADF P-Value (should be < 0.05): Tests if the relationship is stable
Low value = Good for pair trading
High value = Relationship may be random
Cointegration: Confirms long-term equilibrium relationship
YES = Pair tends to revert to mean
NO = Pair may drift apart permanently
Visual Elements Explained
Chart Zones (Color-Coded Areas)
Yellow Zone (-1.5 to +1.5)
Normal Zone: Relationship is stable
Action: Wait for better opportunities
Blue Zone (±1.5 to ±2.0)
Entry Zone: Deviation is significant
Action: Prepare for potential trades
Green/Red Zone (±2.0 to ±3.0)
Opportunity Zone: Strong deviation
Action: High-probability trade setups
Beyond ±3.0
Risk Limit: Extreme deviation
Action: Either maximum opportunity or structural break
Signal Arrows
Green Arrow Up (Buy A + Sell B):
Stock A is undervalued relative to B
Buy Stock A, Short Stock B
Red Arrow Down (Sell A + Buy B):
Stock A is overvalued relative to B
Sell Stock A, Buy Stock B
Settings Guide
Symbol Inputs
Pair Symbol (Symbol B): Choose the second stock to compare
Default: NSE:INFY (Infosys)
Example pairs: TCS/INFY, HDFCBANK/ICICIBANK, RELIANCE/ONGC
Z-Score Parameters
Long Z-Score Period (300): Historical context
Short Z-Score Period (100): Recent trend
Signal Period (20): Trading signals
Z-Score Threshold (2.0): Entry trigger level
Higher = Fewer but stronger signals
Lower = More frequent signals
Statistical Parameters
Correlation Period (240): How many bars to check correlation
Hurst Exponent Period (50): Measures mean-reversion tendency
Probability Lookback (100): Historical probability calculations
Trading Parameters
Entry Threshold (0.0): Minimum Z-score for entry
Risk Threshold (1.5): Warning level
Risk Limit (3.0): Maximum deviation to trade
How to Use (Step-by-Step)
Step 1: Choose Your Pair
Add the indicator to your chart (this becomes Stock A)
In settings, select Stock B (the comparison stock)
Choose stocks from the same sector for best results
Step 2: Verify Pair Quality
Check the Statistics Table (top-right corner):
✅ Correlation > 0.70 (Green = Good)
✅ ADF P-value < 0.05 (Green = Good)
✅ Cointegrated = YES (Green = Good)
If all three are green, the pair is suitable for trading!
Step 3: Wait for Signals
BUY SIGNAL (Green Arrow Up)
Z-Score crosses above -2.0
Action: Buy Stock A, Sell Stock B
Exit: When Z-Score returns to 0
SELL SIGNAL (Red Arrow Down)
Z-Score crosses below +2.0
Action: Sell Stock A, Buy Stock B
Exit: When Z-Score returns to 0
Step 4: Risk Management
Yellow Zone: Monitor only
Blue Zone: Prepare for entry
Green/Red Zone: Active trading zone
Beyond ±3.0: Maximum risk - use caution
⚠️ Important Warnings
Not All Pairs Work: Always check the statistics table first
Market Conditions Matter: Correlation can break during market stress
Use Stop Losses: Set stops at Z-Score ±3.5 or beyond
Position Sizing: Trade both legs with appropriate hedge ratios
Transaction Costs: Factor in brokerage and slippage for both stocks
Example Trade
Scenario: TCS vs INFOSYS
Correlation: 0.85 ✅
Z-Score: -2.3 (TCS is cheap vs INFY)
Action to be taken:
Buy 1lot of TCS Future
Sell 1lot of INFOSYS Future
Expected Outcome:
As Z-Score moves toward 0, TCS outperforms INFOSYS
Close both positions when Z-Score crosses 0
Profit from the convergence
Best Practices
Test Before Trading: Use paper trading first
Sector Focus: Choose pairs from the same industry
Monitor Statistics: Check correlation daily
Avoid News Events: Don't trade pairs during earnings/major news
Size Appropriately: Start small, scale with experience
Be Patient: Wait for high-quality setups (±2.0 or beyond)
What Makes This Indicator Unique?
Multi-timeframe Z-Score analysis: Three different perspectives
Statistical validation: Built-in correlation and cointegration tests
Visual risk zones: Easy-to-understand color-coded areas
Real-time statistics: Live pair quality monitoring
Beginner-friendly: Clear signals with educational zones
Technical Background
The indicator uses:
Engle-Granger Cointegration Test: Validates pair relationship
ADF (Augmented Dickey-Fuller) Test: Tests stationarity
Pearson Correlation: Measures linear relationship
Z-Score Normalization: Standardizes deviations
Log Returns: Handles price differences properly
Support & Community
For questions, suggestions, or to share your pair trading experiences:
Comment below the indicator
Share your successful pair combinations
Report any issues for quick fixes
Disclaimer
This indicator is for educational and informational purposes only. It does not constitute financial advice. Pair trading involves risk, including the risk of loss.
Always:
Do your own research
Understand the risks
Trade with money you can afford to lose
Consider consulting a financial advisor
📌 Quick Reference Card
Z-ScoreInterpretationAction-3.0 to -2.0A very cheap vs BStrong Buy A, Sell B-2.0 to -1.5A cheap vs BBuy A, Sell B-1.5 to +1.5Normal rangeHold/Wait+1.5 to +2.0A expensive vs BSell A, Buy B+2.0 to +3.0A very expensive vs BStrong Sell A, Buy B
Good Pair Statistics:
Correlation: > 0.70
ADF P-value: < 0.05
Cointegration: YES
Version: 1.0
Last Updated: 10th October 2025
Compatible: TradingView Pine Script v6
Happy Trading!

"Top 20 Crypto Coins Table Screener + SuperTrend & EMA 9/21 CrosThis indicator is a powerful table screener for the top 20 crypto coins, updated for 2025 and designed for maximum clarity and speed. It displays customizable columns for Symbol, Price, SuperTrend ("Up"/"Down"), and EMA 9/21 crossover signals ("Buy"/"Sell") across multiple assets on a single chart.
Features:
Covers 20 major coins (edit the symbol list for preferences).
SuperTrend direction and coloring, for quick visual identification of trend.
EMA 9/21 crossover logic for rapid momentum buy/sell decisions.
Fast table rendering, minimal lag—even on basic hardware.
All logic, table columns, and alerts directly built into the script.
How To Use:
Paste the indicator code into Pine Editor and save it.
Activate for your preferred timeframes and coins.
View the table at the top right for actionable signals.
Easy to customize ticker symbols and table layout.
Remarks:
No RSI, ADX, or TSI for speed—focus is on high-impact trend/momentum signals.
Ideal for day traders, swing traders, and crypto investors monitoring broader markets.
For questions, improvements, or feedback, comment on the script page or connect via TradingView.

Aggressive Options Trade Strategy - CALLS (2025+) - ASALEHMomentum-driven options strategy built for call buyers. Uses RSI, MACD, and EMA alignment with volatility filters to spot aggressive long setups and manage exits with profit targets and trailing stops.

ULTIMATE Smart Trading Pro 🔥
## 🇬🇧 ENGLISH
### 📊 The Most Complete All-in-One Trading Indicator
**ULTIMATE Smart Trading Pro** combines the best technical analysis tools and Smart Money Concepts into a single powerful and intelligent indicator. Designed for serious traders who want a real edge in the markets.
---
### ✨ KEY FEATURES
#### 💰 **SMART MONEY CONCEPTS**
- **Order Blocks**: Automatically detects institutional zones where "smart money" enters positions
- **Break of Structure (BOS)**: Identifies structure breaks to confirm trend changes
- **Liquidity Zones**: Spots equal highs/lows areas where institutions hunt stops
- **Market Structure**: Visually displays bullish (green background) or bearish (red background) structure
#### 📈 **ADVANCED TECHNICAL INDICATORS**
- **RSI with Auto Divergences**: Classic RSI + automatic detection of bullish and bearish divergences
- **MACD with Signals**: Identifies bullish and bearish crossovers in real-time
- **Dynamic Support & Resistance**: Adaptive zones with intelligent scoring based on volume, multiple touches, and ATR
- **Fair Value Gaps (FVG)**: Detects unfilled price gaps (imbalance zones)
#### 📐 **AUTOMATIC TOOLS**
- **Auto Fibonacci**: Automatically calculates Fibonacci retracement levels on the last major trend
- **Pivot Points**: Daily, Weekly, or Monthly pivot points (PP, R1, R2, S1, S2)
- **Pattern Finder**: Automatically detects candlestick patterns (Hammer, Shooting Star, Engulfing, Morning/Evening Star) and chart patterns (Double Top/Bottom)
---
### 🎯 HOW TO USE IT
#### Quick Setup:
1. **Add the indicator** to your chart
2. **Open Settings** and enable/disable modules as needed
3. **Adjust parameters** for your trading style (scalping, swing, day trading)
#### Optimal Trading Setup:
🔥 **ULTRA STRONG Signal** when you have:
- An institutional **Order Block**
- Aligned with a **Support/Resistance** tested 3+ times
- An unfilled **FVG** nearby
- An **RSI divergence** confirming the reversal
- On a key **Fibonacci** level (50%, 61.8%, or 78.6%)
- Favorable market structure (green background for buys, red for sells)
---
### 💡 UNIQUE ADVANTAGES
✅ **Adaptive Intelligence**: Automatically adjusts to market volatility (ATR)
✅ **Volume Filters**: Validates important levels with volume confirmation
✅ **Multi-Timeframe Ready**: Works on all timeframes (1m to 1M)
✅ **Complete Alerts**: Notifications for all important signals
✅ **Clear Interface**: Emojis and colored labels for quick identification
✅ **Intelligent Scoring**: Levels ranked by importance (🔴🔴🔴 = very strong)
✅ **100% Customizable**: Enable only what you need
---
### 🎨 SYMBOL LEGEND
**Smart Money:**
- 🟢 OB = Bullish Order Block
- 🔴 OB = Bearish Order Block
- BOS ↑/↓ = Break of Structure
- 💧 LIQ = Liquidity Zone
**Candlestick Patterns:**
- 🔨 = Hammer (bullish signal)
- ⭐ = Shooting Star (bearish signal)
- 📈 = Bullish Engulfing
- 📉 = Bearish Engulfing
- 🌅 = Morning Star (bullish reversal)
- 🌆 = Evening Star (bearish reversal)
**Indicators:**
- 🚀 MACD ↑ = Bullish crossover
- 📉 MACD ↓ = Bearish crossover
- ⚠️ DIV = Bearish RSI divergence
- ✅ DIV = Bullish RSI divergence
**Support & Resistance:**
- 🟢/🔴 S1, R1 = Support/Resistance
- 🟢🟢🟢/🔴🔴🔴 = VERY strong level (3+ touches)
- (×N) = Number of times touched
---
### ⚙️ RECOMMENDED SETTINGS
**For Scalping (1m - 5m):**
- SR Lookback: 15
- Structure Strength: 3
- RSI: 14
- Volume Filter: ON
**For Day Trading (15m - 1H):**
- SR Lookback: 20
- Structure Strength: 5
- RSI: 14
- All filters: ON
**For Swing Trading (4H - Daily):**
- SR Lookback: 30
- Structure Strength: 7
- Pattern Lookback: 100
- Fibonacci: ON
---
### 🚨 DISCLAIMER
This indicator is a decision support tool. It does not guarantee profits and does not constitute financial advice. Always test on a demo account before real use. Trading involves significant risks.
---
## 📞 SUPPORT & UPDATES
For questions, suggestions, or bug reports, please comment below or contact the author.
**Version:** 1.0
**Last Updated:** October 2025
**Compatible:** TradingView Pine Script v6
---
### 🌟 If you find this indicator useful, please give it a 👍 and share it with other traders!
**Happy Trading! 🚀📈**

Session Volume Spike Detector (MTF Arrows)Overview
The Session Volume Spike Detector is a precision multi-timeframe (MTF) tool that identifies sudden surges in buy or sell volume during key market windows. It highlights high-impact institutional participation by comparing current volume against its historical baseline and short-term highs, then plots directional markers on your chart.
This version adds MTF awareness, showing spikes from 1-minute, 5-minute, and 10-minute frames on a single chart. It’s ideal for traders monitoring microstructure shifts across multiple time compressions while staying on a fast chart (like 1-second or 1-minute).
Key Features
Dual Session Windows (DST-aware)
Automatically tracks Morning (05:30–08:30 MT) and Midday (11:00–13:30 MT) activity, adjusted for daylight savings.
Directional Spike Detection
Flags Buy spikes (green triangles) and Sell spikes (magenta triangles) using dynamic volume gates, Z-Score normalization, and recent-bar jump filters.
Multi-Timeframe Projection
Displays higher-timeframe (1m / 5m / 10m) spikes directly on your active chart for continuous visual context — even on sub-minute intervals.
Adaptive Volume Logic
Each spike is validated against:
Volume ≥ SMA × multiplier
Volume ≥ recent-high × jump factor
Optional Z-Score threshold for statistical significance
Session-Only Filtering
Ensures spikes are only plotted within specified trading sessions — ideal for futures or intraday equity traders.
Configurable Alerts
Built-in alert conditions for:
Any timeframe (MTF aggregate)
Individual 1m, 5m, or 10m windows
Alerts trigger only when a new qualifying spike appears at the close of its bar.
Use Cases
Detect algorithmic or institutional activity bursts inside your trading window.
Track confluence of volume surges across multiple timeframes.
Combine with FVGs, bank levels, or range breakouts to identify probable continuation or reversal zones.
Build custom automation or alert workflows around statistically unusual participation spikes.
Recommended Settings
Use on 1-minute chart for full MTF display.
Adjust the SMA length (default 20) and Z-Score threshold (default 3.0) to suit market volatility.
For scalping or high-frequency environments, disable the 10m layer to reduce visual clutter.
Credits
Developed by Jason Hyde
© 2025 — All rights reserved.
Designed for clarity, precision, and MTF-synchronized institutional volume detection.
Bitcoin Cycle History Visualization [SwissAlgo]BTC 4-Year Cycle Tops & Bottoms
Historical visualization of Bitcoin's market cycles from 2010 to present, with projections based on weighted averages of past performance.
-----------------------------------------------------------------
CALCULATION METHODOLOGY
Why Bottom-to-Bottom Cycle Measurement?
This indicator defines cycles as bottom-to-bottom periods. This is one of several valid approaches to Bitcoin cycle analysis:
- Focuses on market behavior (price bottoms) rather than supply schedule events (halving-to-halving)
- Bottoms may offer good reference points for some analytical purposes
- Tops tend to be extended periods that are harder to define precisely
- Aligns with how some traditional asset cycles are measured and the timing observed in the broader "risk-on" assets category
- Halving events are shown separately (yellow backgrounds) for reference
- Neither halving-based nor bottom-based measurement is inherently superior
Different analysts prefer different cycle definitions based on their analytical goals. This approach prioritizes observable market turning points.
Cycle Date Definitions
- Approximate monthly ranges used for each event (e.g., Nov 2022 bottom = Nov 1-30, 2022)
- Cycle 1: Jul 2010 bottom → Jun 2011 top → Nov 2011 bottom
- Cycle 2: Nov 2011 bottom → Dec 2013 top → Jan 2015 bottom
- Cycle 3: Jan 2015 bottom → Dec 2017 top → Dec 2018 bottom
- Cycle 4: Dec 2018 bottom → Nov 2021 top → Nov 2022 bottom
- Future cycles will be added as new top/bottom dates become firm
Duration Calculations
- Days = timestamp difference converted to days (milliseconds ÷ 86,400,000)
- Bottom → Top: days from cycle bottom to peak
- Top → Bottom: days from peak to next cycle bottom
- Bottom → Bottom: full cycle duration (sum of above)
Price Change Calculations
- % Change = ((New Price - Old Price) / Old Price) × 100
- Example: $200 → $19,700 = ((19,700 - 200) / 200) × 100 = 9,750% gain
- Approximate historical prices used (rounded to significant figures)
Weighted Average Formula
Recent cycles weighted more heavily to reflect the evolved market structure:
- Cycle 1 (2010-2011): EXCLUDED (too early-stage, tiny market cap)
- Cycle 2 (2011-2015): Weight = 1x
- Cycle 3 (2015-2018): Weight = 3x
- Cycle 4 (2018-2022): Weight = 5x
Formula: Weighted Avg = (C2×1 + C3×3 + C4×5) / (1+3+5)
Example for Bottom→Top days: (761×1 + 1065×3 + 1066×5) / 9 = 1,032 days
Projection Method
- Projected Top Date = Nov 2022 bottom + weighted avg Bottom→Top days
- Projected Bottom Date = Nov 2022 bottom + weighted avg Bottom→Bottom days
- Current days elapsed compared to weighted averages
- Warning symbol (⚠) shown when the current cycle exceeds the historical average
Technical Implementation
- Historical cycle dates are hardcoded (not algorithmically detected)
- Dates represent approximate monthly ranges for each event
- The indicator will be updated as the Cycle 5 top and bottom dates become confirmed
- Updates require manual code maintenance - not automatic
- Users should verify they're using the latest version for current cycle data
-----------------------------------------------------------------
FEATURES
- Background highlights for historical tops (red), bottoms (green), and halving events (yellow)
- Data table showing cycle durations and price changes
- Visual cycle boundary boxes with subtle coloring
- Projected timeframes displayed as dashed vertical lines
- Toggle on/off for each visual element
- Customizable background colors
-----------------------------------------------------------------
DISPLAY SETTINGS
- Show/hide cycle tops, bottoms, halvings, data table, and cycle boxes
- Customizable background colors for each event type
- Clean, institutional-grade visual design suitable for analysis
UPDATES & MAINTENANCE
This indicator is maintained as new cycle events occur. When Cycle 5's top and bottom are confirmed with sufficient time elapsed, the code and projections will be updated accordingly. Check for the latest version periodically.
OPEN SOURCE
Code available for review, modification, and improvement. Educational transparency is prioritized.
-----------------------------------------------------------------
IMPORTANT LIMITATIONS
⚠ EXTREMELY SMALL SAMPLE SIZE
Based on only 4 complete cycles (2011-2022). In statistical analysis, this is insufficient for reliable predictions.
⚠ CHANGED MARKET STRUCTURE
Bitcoin's market has fundamentally evolved since early cycles:
- 2010-2015: Tiny market cap, retail-only, unregulated
- 2024-2025: Institutional adoption, spot ETFs, regulatory frameworks, macro correlation
The environment that created past patterns no longer exists in the same form.
⚠ NO PREDICTIVE GUARANTEE
Historical patterns can and do break. Market cycles are not laws of physics. Past performance does not guarantee future results. The next cycle may not follow historical averages.
⚠ LENGTHENING CYCLE THEORY
Some analysts believe cycles are extending over time (diminishing returns, maturing market). If true, simple averaging underestimates future cycle lengths.
⚠ SELF-FULFILLING PROPHECY RISK
The halving narrative may be partially circular - it works because people believe it works. Sufficient changes in market structure or participant behavior can invalidate the pattern.
⚠ APPROXIMATE DATA
Historical prices rounded to significant figures. Exact bottom/top dates vary by exchange. Month-long ranges are used for simplicity.
EDUCATIONAL USE ONLY
This indicator is designed for historical analysis and understanding Bitcoin's past behavior. It is NOT:
- Trading advice or financial recommendations
- A guarantee or prediction of future price movements
- Suitable as a sole basis for investment decisions
- A replacement for fundamental or technical analysis
The projections show "what if the pattern continues exactly" - not "what will happen."
Always conduct independent research, understand the risks, and consult qualified financial advisors before making investment decisions. Only invest what you can afford to lose.

my_strategy_2.0Overview:
This is a high-speed scalping strategy optimized for volatile crypto assets (BTC, ETH, etc.) on timeframes 1m–5m. It combines trend-following SuperTrend with confirmations from MACD, RSI, Bollinger Bands, and volume spikes for precise entries. Focus on quick profits (1–3 ATR) with strict risk control: partial take-profits, stop-loss, and trailing breakeven after the first TP.
Key Signals:
Long: SuperTrend flip up + MACD crossover up + RSI >50 + BB Upper breakout + volume spike + volatility filter (ATR >0.5%).
Short: Similar but downward.
Exits and Risks:
TP: 33% at +1 ATR, 33% at +2 ATR, 34% at +3 ATR (customizable).
SL: Initial at -1 ATR, after TP1 — to breakeven with trailing on BB midline (optional).
Filters: Minimum ATR to avoid flat markets; realistic commissions in backtests.
Recommendations:
Test on 2020–2025 data (out-of-sample 2024+). Expected Win Rate ~55%, Profit Factor >1.8, Drawdown <10%. Ideal for 1–2% risk per trade. Not for beginners — use paper trading.
Disclaimer: Past results do not guarantee future performance. Trade at your own risk.
(Pine v6 code, ready for publication. Author: gopog777 with expert fixes.)

Multi-Timeframe MACD with Color Mix (Nikko)Multi-Timeframe MACD with Color Mix (Nikko) Indicator
This documentation explains the benefits of the "Multi-Timeframe MACD with Color Mix (Nikko)" indicator for traders and provides easy-to-follow steps on how to use it. Written as of 05:06 AM +07 on Saturday, October 04, 2025, this guide focuses on helping you, as a trader, get the most out of this tool with clear, practical advice before diving into the technical details.
Benefits for Traders
1. Multi-Timeframe Insight
This indicator lets you see momentum trends across 15-minute, 1-hour, 1-day, and 1-week timeframes all on one chart. This big-picture view helps you catch both quick market moves and long-term trends without flipping between charts, saving you time and giving you a fuller understanding of the market.
2. Visual Momentum Representation
The background changes from red to green based on short-term (15m) momentum, giving you a quick, easy-to-see signal—red means bearish (prices might drop), and green means bullish (prices might rise). The histogram uses a mix of red, green, and blue colors to show the combined strength of the 1-hour, 1-day, and 1-week timeframes, helping you spot strong trends at a glance (e.g., a bright mix for strong momentum, darker for weaker).
3. Enhanced Decision-Making
The background and histogram colors work together to confirm trends across different timeframes, making it less likely you’ll act on a false signal. This helps you feel more confident when deciding when to buy, sell, or hold.
4. Proactive Alert System
You can set alerts to notify you when the percentage of bullish timeframes hits your chosen levels (e.g., below 10% for bearish, above 90% for bullish). This keeps you in the loop on big momentum shifts without needing to watch the chart all day—perfect for when you’re busy.
5. Flexibility and Efficiency
You can turn timeframes on or off, adjust settings like speed of the moving averages, and tweak transparency to fit your trading style—whether you’re a fast scalper or a patient swing trader. Everything is shown on one chart, saving you effort, and the colors make it simple to read, even if you’re new to trading.
How to Use It
Getting Started
Add the Indicator: Load the "Multi-Timeframe MACD with Color Mix (Nikko)" onto your TradingView chart using the Pine Script editor or indicator library.
Pick Your Timeframes: Turn on the timeframes that match your trading—use 15m and 1h for quick trades, or 1d and 1w for longer holds—using the enable_15m, enable_1h, enable_1d, enable_1w, and enable_background options.
Reading the Colors
Background Gradient: Watch for red to signal bearish 15m momentum and green for bullish momentum. Adjust the Background_transparency (default 75%, or 25% opacity) if the chart feels too busy—try lowering it to 50 for clearer candlesticks in fast markets.
Histogram and EMA Colors:
The histogram and its Exponential Moving Average (EMA) line show a mix of red (1-week), green (1-day), and blue (1-hour) based on how strong the momentum is in each timeframe.
Brighter colors mean stronger momentum—white (all bright) shows all timeframes are pushing up hard, while darker shades (like gray or black) mean weaker or mixed momentum.
Turn off a timeframe (e.g., enable_1h = false) to see how it changes the color mix and focus on what matters to you.
Setting Alerts
Set Your Levels: Choose a threshold_low (default 10%) and threshold_high (default 90%) based on your comfort zone or past market patterns to catch big turns.
Get Notifications: Use TradingView alerts to get pings when the market hits your set levels, so you can act without staring at the screen.
Practical Tips
Pair with Other Tools: Use it with support/resistance lines or the RSI to double-check your moves and build a solid plan.
Tweak Settings: Adjust fast_length, slow_length, and signal_smoothing to match your asset’s speed, and bump up the lookback (default 50) for steadier trends in wild markets.
Practice First: Test different timeframe combos on a demo account to find what works best for you.
Understanding the Colors (Simple Explanation)
How Colors Work
The histogram and its EMA line use a color mix based on a simple idea from color theory, like mixing paints with red, green, and blue (RGB):
Red comes from the 1-week timeframe, green from 1-day, and blue from 1-hour.
When all three timeframes show strong upward momentum, they blend into bright white—the brightest color, like a super-bright light telling you the market’s roaring up.
If some timeframes are weak or pulling down, the mix gets darker (like gray or black), warning you the momentum might not be solid.
Brighter is Better
Bright Colors = Strong Opportunity: The brighter the histogram and EMA (closer to white), the more all your chosen timeframes are in agreement that prices are rising. This is your signal to think about buying or holding, as it points to a powerful trend you can ride.
Dark Colors = Caution: A darker mix (toward black) means some timeframes are lagging or bearish, suggesting you might wait or consider selling. It’s like a dim light saying, “Hold on, check again.”
Benefit in Practice: Watching the brightness helps you jump on the best trades fast. For example, a bright white histogram on a green background is like a green traffic light—go for it! A dark gray on red is like a red light—pause and rethink. This quick color check can save you from bad moves and boost your profits when the trend is strong.
Why It Helps
These colors are your fast friend in trading. A bright histogram means all your timeframes are cheering for an uptrend, giving you the confidence to act. A dull one tells you to be careful, helping you avoid traps. It’s like having a color-coded guide to pick the hottest market moments!
Technical Details
Input Parameters
Fast Length (default: 12): Short-term moving average speed.
Slow Length (default: 26): Long-term moving average speed.
Source (default: close): Price data used.
Signal Smoothing (default: 9): Smooths the signal line.
MA Type (default: EMA): Choose EMA or SMA.
Timeframe and Scaling
Timeframes: 15m, 1h, 1d, 1w, with on/off switches.
Lookback Period (default: 50): Sets the data window for trends.
Background Transparency (default: 75%): Controls background see-through level.
MACD Calculation
Per Timeframe: Uses request.security():
MACD Line: ta.ema(src, fast_length) - ta.ema(src, slow_length).
Signal Line: ta.ema(MACD, signal_length).
Histogram: (macd - signal) / 3.0.
Background Gradient
15m Normalization: norm_value = (hist_15m - hist_15m_min) / max(hist_15m_range, 1e-10), limited to 0-1.
RGB Mix: Red drops from 255 to 0, green rises from 0 to 255, blue stays 0.
Apply: color.new(color.rgb(r_val, g_val, b_val), Background_transparency).
Histogram and EMA Colors
Color Assignment:
1h: Blue (#0000FF) if hist_1h >= 0, else black.
1d: Green (#00FF00) if hist_1d >= 0, else black.
1w: Red (#FF0000) if hist_1w >= 0, else black.
Final Color: final_color = color.rgb(min(r, 255), min(g, 255), min(b, 255)).
Plotting: Histogram and EMA use final_color; MACD (#2962FF), signal (#FF6D00).
Alerts
Bullish Percentage: bullish_pct = (bullish_count / bullish_total) * 100, counting hist >= 0.
Triggers: Below threshold_low or above threshold_high.
--------------------------------------------------------------------
Conclusion
The "Multi-Timeframe MACD with Color Mix (Nikko)" is your all-in-one tool to spot trends, confirm moves, and trade smarter with its bright, easy-to-read colors. By using it wisely, you can sharpen your market edge and trade with more confidence.
This README is tailored for traders and reflects the indicator's practical value as of 05:06 AM +07 on October 04, 2025.

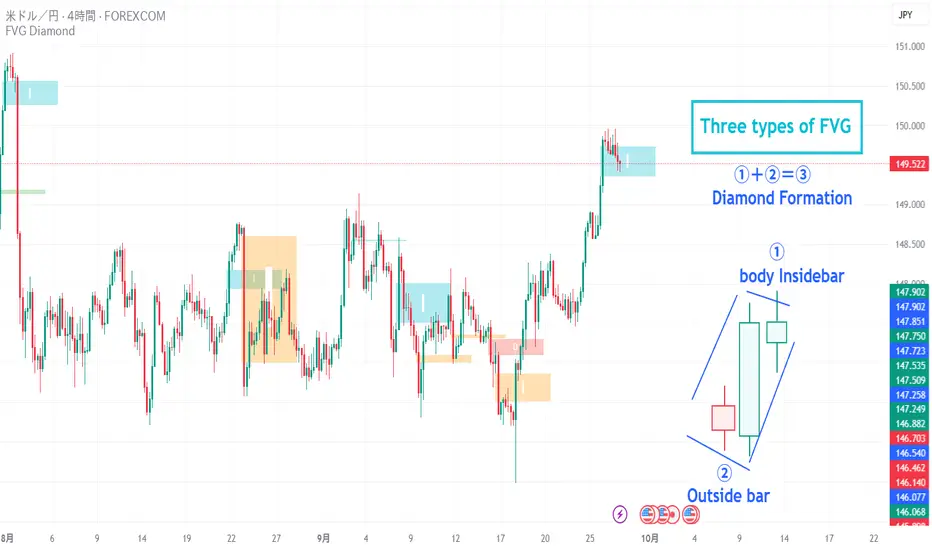
FVG Diamond📊 Overview
FVG Diamond is an advanced indicator that detects three specific price action patterns: Inside Bar, Outside Bar, and Diamond Formation. Unlike basic FVG tools, it focuses on these higher-level setups for more precise analysis.
✨ Key Features
🎯 Detection of 3 Advanced FVG Pattern Types
Independent on/off toggle for each pattern
Inside FVG (Inside Bar / Harami): The body of the 3rd candle forms an inside bar relative to the 2nd candle
Outside FVG (Outside Bar / Engulfing): The body of the 1st candle forms an outside bar relative to the 2nd candle
Diamond FVG (Diamond Formation): A unique pattern that satisfies both Inside and Outside conditions
🎯 Mitigation Feature
ON: FVG boxes are automatically removed once price fully fills the FVG zone (keeps the chart clean by showing only active FVGs)
OFF: FVG boxes remain on the chart indefinitely (allows full historical review of all FVGs)
🎨 Visual Features
Color Coding: Assign unique colors to each pattern type
Transparency Control: Default 70% transparency for optimal readability
Extension Display: Extend the right edge of FVG boxes for any number of bars
⚙️ Advanced Configuration
Threshold Settings
Manual Threshold: Define a minimum gap size by percentage
Auto Threshold: Dynamically adjusts based on market volatility
Mitigation Tools
Real-Time Mitigation: Automatic removal when price fills an FVG zone
Mitigation Levels: Display filled FVG levels with dashed lines
🔔 Alerts
Notification on new Bullish/Bearish FVG detection
Notification when an FVG is mitigated (filled)
Works with all FVG types
📈 How to Use
Add the indicator to your chart
The three advanced FVG patterns will be detected and displayed automatically
Set your preferred threshold (0% = detect all gaps)
⚠️ Note: This indicator is designed as an analysis support tool. Trading decisions should be made in combination with other methods of technical and fundamental analysis.
Author: omochi_
Version: 1.0
Last Updated: September 28, 2025
Macro & Earnings Dashboard — NY Fed CalendarMacro & Earnings Dashboard — NY Fed Calendar
This is an overlay indicator designed to provide a quick, real-time overview of the most critical upcoming US economic data releases and corporate earnings reports directly on your TradingView chart. It functions as a dynamic dashboard, removing the need to constantly check external calendars.
Key Features
1. Real-Time Economic Calendar (Bottom-Right Table)
The dashboard tracks the time remaining until the next release of five major, high-impact economic indicators. The data for these dates is pre-loaded directly from the New York Fed Economic Indicators Calendar (currently loaded for October through December 2025).
The tracked events include:
CPI (Consumer Price Index)
PPI (Producer Price Index)
Employment Situation (Non-Farm Payrolls / Unemployment Rate)
Interest Rate Decision (FOMC Meetings)
Consumer Sentiment (University of Michigan Survey)
2. Corporate Earnings Tracker (Top-Right Table)
This table uses TradingView's built-in data to calculate the estimated days remaining until the next Earnings Per Share (EPS) report for a curated list of high-profile NASDAQ tickers:
AAPL, NVDA, GOOG, TSLA, MSFT, AMZN, META
3. Color-Coded Urgency
The "Days" column for both macro and earnings tables uses a traffic light system to instantly communicate how soon the event is:
Red: The event is scheduled for Today or Tomorrow (0–1 day away).
Orange: The event is scheduled for the current week (within 6 days).
Teal: The event is more than a week away.
Gray: The date is currently unavailable or outside the loaded calendar range.

Anchored VWAP (Triple) MYRAXESAnchored VWAP Triple Indicator
The Anchored VWAP Triple indicator is a powerful tool for technical analysis, allowing traders to plot three customizable anchored Volume Weighted Average Price (VWAP) lines on a chart. Unlike traditional VWAP, which resets daily, this indicator lets you anchor each VWAP to a specific date and time, providing a unique perspective on price action relative to key market events.
Features
Three Independent VWAPs: Plot up to three VWAP lines, each anchored to a user-defined date and time.
Customizable Inputs: Set the year, month, day, hour, and minute for each VWAP anchor point. Choose distinct colors for easy identification.
Pure Anchored Design: VWAP lines start only from the anchor point, with no pre-anchor extensions, ensuring a clean and focused analysis.
Debug Mode: Optional display of hour and minute for troubleshooting or educational purposes.
Default Settings: Pre-configured with practical defaults (e.g., September 2025 dates) for immediate use.
How to Use
Add the indicator to your TradingView chart.
Adjust the anchor dates and times for each VWAP (VWAP 1, VWAP 2, VWAP 3) via the input settings.
Select custom colors for each VWAP line to differentiate them on the chart.
Enable Debug Mode if needed to verify time alignment.
Analyze price movements relative to the anchored VWAPs to identify support, resistance, or trend shifts.
Benefits
Ideal for swing traders and long-term analysts who need to anchor VWAP to significant price levels or events.
Enhances decision-making by comparing multiple VWAPs from different anchor points.
Fully compatible with TradingView’s Pine Script v6 for smooth performance.
This indicator is perfect for traders looking to deepen their market analysis with a flexible, multi-VWAP approach. Share your feedback or custom setups in the comments!
CB Charts - GEX MESZ2025/ESZ2025Last Updated: 09/22/2025 6:41 a.m. PST
*DISCLAIMER: Only intended for ESZ2025/MESZ2025 charts.
This indicator plots horizontal levels based on batched GEX levels for ESZ2025/MESZ2025. The batched data is derived from contracts expiring: 0DTE, 1DTE, EoW, EoM, Next Week, Next Month and 3-months out. Labels are available for a high-level view of which levels are which. Hovering (or long-pressing on mobile TV) over the labels will display the nominal values and Rank. This script is manually updated and may not be always updated.
When and what to use:
- Most respected levels come from 1DTE, EoW and EoM.
- 0DTE is included for when this script becomes intraday updated. (CURRENTLY NOT UPDATED INTRADAY)
- Next Week setting is best used only for Friday and Sunday trading
- Next Month setting is best for weeks close to the end of the current month
Powered by the Camels of Wallstreet