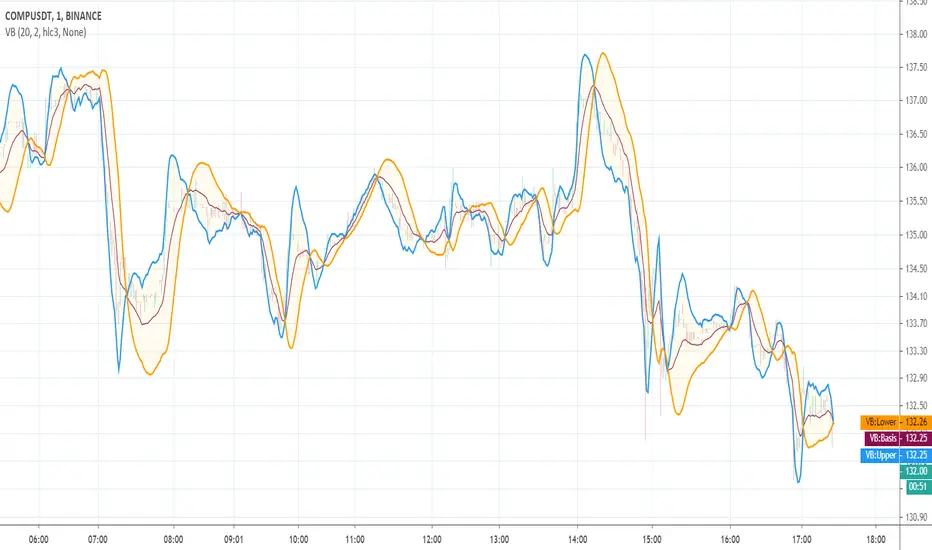
CDub's BolBands SetupUses a set of Bollinger Bands (user defined deviation, user defined deviation * 2) to determine possible entry set ups.
Signals are triggered when price crosses the first band (closest to the baseline MA) in the desired direction.
baseline can be your take profit 1 target
The inside band determines entry and can be used as a take profit 2 target (Opposite side of baseline)
The outside band is a suggested stop loss target (Same side of baseline) and can be used as a take profit 3 target (Opposite side of baseline)
Suggestions are welcome!
-CDub
"弘历投教boll指标代码分析" için komut dosyalarını ara

Vortex BandsA slighty modified version of Better Bollinger Bands. The idea of the experiment was to do a thing like the well-known Vortex Indicator, but an overlay:
Obvious trading rules are:
go Long when the blue line is above other two
go Short when the orange line is above other two
stop when price crosses the basis line
The tool is EXPERIMENTAL . Good luck!
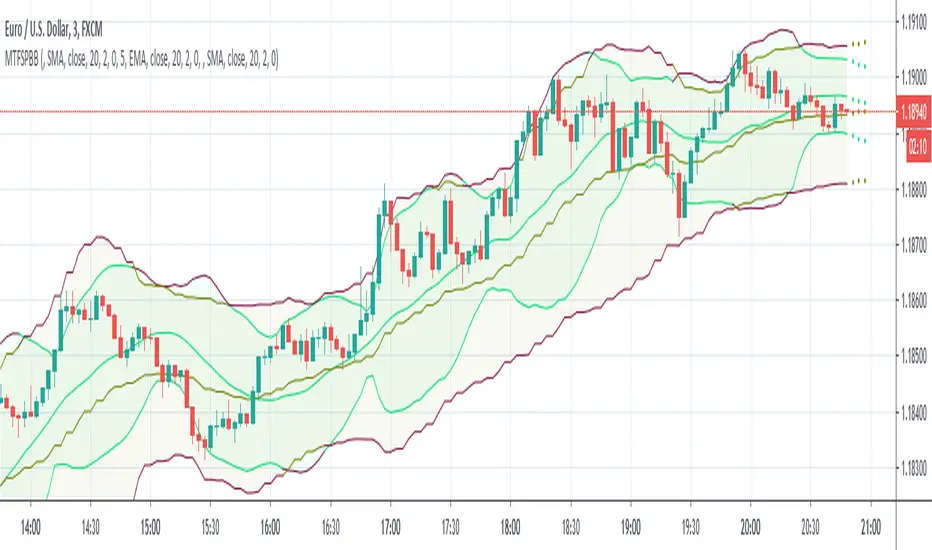
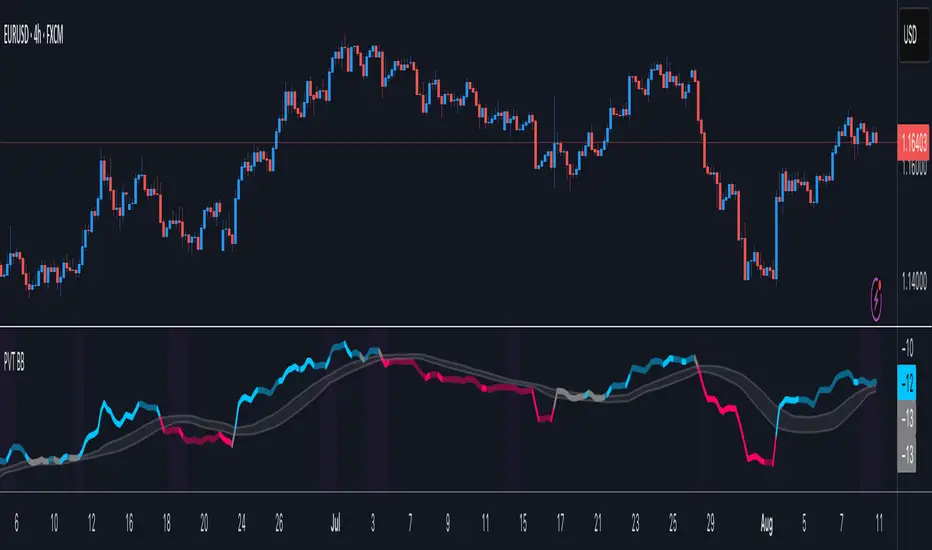
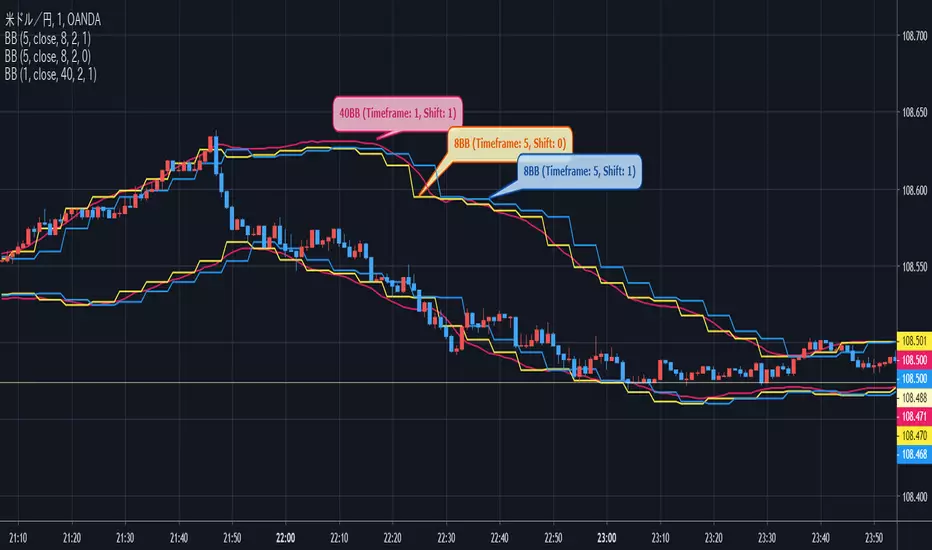
MultiTimeFrame Shifting Predictive Bollinger BandsThis is the optimized version of my MTFSBB indicator with capability of possible bands prediction in case of negative shifting (to the left).
Make me happy by using it and sending me your ideas about the prediction.
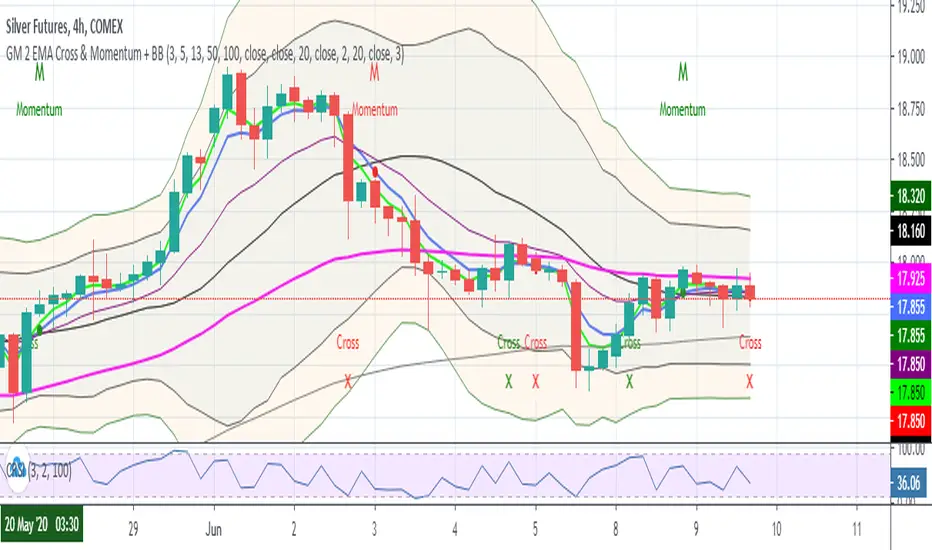
GM 2 EMA Cross + BBScript for seeing the below EMAs
3
5
13
50
100
This also plots a red cross when -ve crossover of 3 by 5 EMA & green cross when +ve crossover of 3 by 5 EMA
Bollinger Bands
2
3
GM EMA BB {EMA(5-26-50) + BB(2-3)}A modified script that shows the EMA of 5, 26, 50 along with nested Bollinger Bands of 2 & 3 mult.
Useful for Growth Module students

Gap driven intraday trade (better in 15 Min chart)// Based on yesterday's High, Low, today's open, and Bollinger Band (20) in current minute chart,
// Defined intraday Trading opportunity: Stop, Entry, T0, Target (S.E.T.T)
// Back test in 60, 30, 15, 5 Min charts with SPY, QQQ, XOP, AAPL, TSLA, NVDA, UAL
// In 60 and 30 min chart, the stop and target are too big. 5 min is too small.
// 15 min Chart is the best time frame for this strategy;
// -------------------------------------------------------------------------------
// There will be Four lines in this study:
// 1. Entry Line,
// 1.1 Green Color line to Buy, If today's open price above Yesterday's High, and current price below BB upper line.
// 1.2 Red Color line to Short, if today's open price below Yesterday's Low, and current above BB Lower line.
//
// 2. Black line to show initial stop, one ATR in current min chart;
//
// 3. Blue Line (T0) to show where trader can move stop to make even, one ATR in current min chart;
//
// 4. Orange Line to show initial target, Three ATR in current min chart;
//
// Trading opportunity:
// If Entry line is green color, Set stop buy order at today's Open;
// Whenever price is below the green line, Prepare to buy;
//
// If Entry line is Red color, Set Stop short at today's Open;
// Whenever price is above the red line, Prepare to short;
//
// Initial Stop: One ATR in min chart;
// Initial T0: One ATR in min chart;
// Initial Target: Three ATR in min chart;
// Initial RRR: Reward Risk Ratio = 3:1;
//
// Maintain: Once the position moves to T0, Move stop to "Make even + Lunch (such as, Entry + $0.10)";
// Allow to move target bigger, such as, next demand/supply zone;
// When near target or demand/supply zone or near Market close, move stop tightly;
//
// Close position: Limit order filled, or near Market Close, or trendline break;
//
// Key Step: Move stop to "Make even" after T0, Do not turn winner to loser;
// Willing to "in and out" many times in one day, and trade the same direction, same price again and again.
//
// Basic trading platform requests:
// To use this strategy, user needs to:
// 1. Scan Stocks Before market open:
// Prepare a watch list for top 10 ETF and Top 90 stocks which are most actively traded.
// Stock might be limited by price range, Beta, optionable, ...
// Before market open, Run a scan for these stocks, find which has GAP and inside BB;
// create watch list for that day.
//
// 2. Attach OSO and OCO orders:
// User needs to Send Entry, Stop (loss), and limit (target) orders at one time;
// Order Send order ( OSO ): Entry order sends Stop order and limit order;
// Order Cancel order ( OCO ): Stop order and limit order, when one is filled, it will cancel the other instantly;


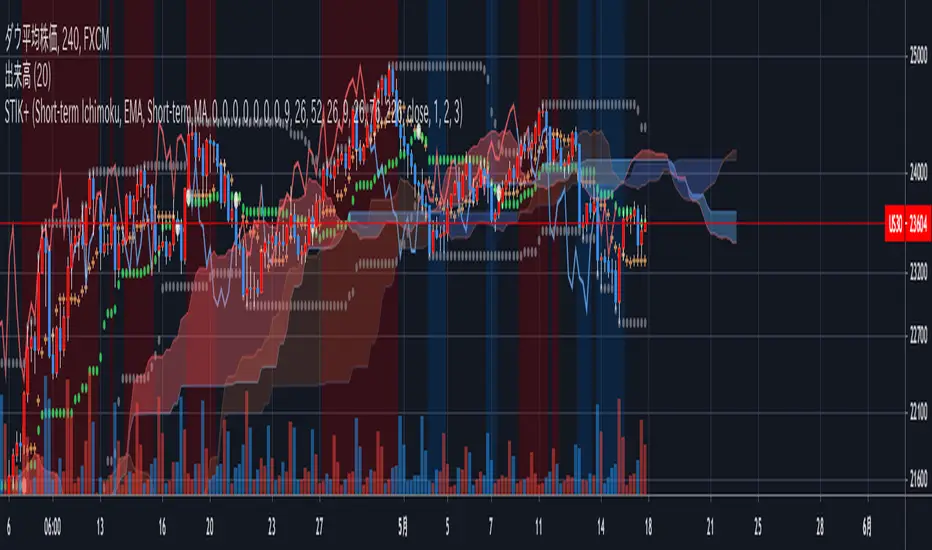
Short-Term Ichimoku Kinko-hyo+This Ichimoku Kinko-Hyo is an indicator which has been changed for short-term trading and, It has a “target price theory(one of three theory of Ichimoku Kinko-Hyo) function.”
Also, In this indicator, It can be plotting the “Span model”, “Super Bollinger Bands” which has Invented by a Japanese currency dealer Toshihiko Masaki, And Moving Average.
In addition, you can select setting only “clouds” and “Lagging span” or displaying Default Ichimoku Kinko-Hyo.
This indicator is modified original Ichimoku Kinko-Hyo, but It made based on the true usage of Ichimoku Kinko-Hyo.
For the evidence, I referred to the book supervised by Ichimoku-Sanjin the third generation.
Describe below about features↓↓↓.
- 2nd Cloud to check relation two Lead Lines and Lagging span.
- Background-color for discovering “Three Roles Improvement (In Japanese: 三役好転)” and “Three Roles Reversal (In Japanese: 三役逆転)”.
- Signal of Crossing Base Line and Conversion Line.
- mode selection of Ichimoku Kinko Hyo.
- Calculation feature for Target Price theory.
- A switch to replace Base Line and Conversion Line with 3 Moving Average lines.
- And others...
JSE Top 40 Comparative Relative StrengthThis code adapts the code by vitvlkv to be appropriate for comparison of JSE stocks with the Top 40 index. It also includes moving averages and Bollinger Bands to identify extreme conditions. You can change the colours and deselect moving averages to make the plot less cluttered. You can also change the selection to compare the stock against to JSE:J201 if you want to compare it to the All Share Index.

Full Candle Outside BB [Bishnu103]Bollinger band defines volatility range based on the current market condition. If a full candle is created outside BB then it is highly volatile and it may reverse to the mean, i.e. middle BB.
Buy - when a green candle is created below lower BB (alert candle) and price goes above high of it.
Buy SL - low of alert candle
Target 1 - middle band
Target 2- upper band
Sell - when a red candle is cerated above upper BB (alert candle) and price goes below low of it
Sell SL - high of alert candle
Target 1 - middle band
Target 2 - lower band
************************************************************************************************************************************************************************************
Disclaimer: This is in-progress strategy. I plan to work further and improve this. So please use this in the live market very carefully and based on your own risk factors.
************************************************************************************************************************************************************************************

OBV w/BB+EMAOBV plotted with Bollinger Bands to show whether the volume is breaking out from its normal deviation (both up or down). The OBV changes color depending on the macro trend which is set using a 100 EMA.

Pivot Boss 4 EMA + BB + Parabolic SAR + IchimokuA combination of a few of my favorite indicators.
1) Pivot Boss 4 EMA
2) Bollinger Bands
3) Parabolic SAR
4) Ichimoku Cloud
All credit to original authors.

RW Simple Pairs TradeA Simple Implementation of a Pairs Trading Strategy
It uses a simple moving average of specified length (default = 20) and enters at cutoffs set by Entry ZScore. Trades are exited at the moving average.
It is intended to be run on pairs of stocks. To Spread KO and PEP, for example, use the ticker KO / PEP * 1000
To visualise the trade better add Bollinger bands to your charts, corresponding to the SMA length and Entry ZScore criteria you specified.

Dr_All indicators V1.0Free users have many restrictions on their use in TradingView.
I put together a lot of indicators I use often.
5 moving average
1 parabolic SAR
1 bollinger band
1 ichimoku cloud
(but it's only cloud)
as always
It's open source.
enjoy!

Price Volume Trend BBHey guys,
Ive been thinking about Price Volume Trend for a while and tried adding different moving averages to it, but seems its not as binary.
Therefore adding the bollinger bands as a no-trade-zone made it alot better. Indicator is pretty basic at the moment since I just implemented the idea but im planning to do some add-ons later on to make it easier to read.
Will keep you updated!
Bollinger Bands Width 10標準偏差Standard Deviation(bolliger bands width)を10本重ねたものになります。お好みのスパン、色、σでお使いください。

Bollinger Bands with Multiple Moving AveragesBolling bands with a triple MA overlay in one indicator

DAKELAX-XRPUSDT Bollinger Band Strategy for TradebotlerDAKELAX-XRPUSDT is a Tradebotler strategy designed to run on XRPUSDT for binance, it's a simple reverse to mean strategy and when backtested on may-aug 2019 on H1 timeframe it performs pretty well in backtest as well as running live.
In order to get started install the Tradebotler extension and connect the strategy with Binance or other crypto exchanges of your choice such as Kraken, Bitstamp, Bitmex, Bittrex, Polyneux etc, etc.


Koby's Fibonacci Bollinger BandThis is my customized Bolinger Band. Using Fibonacci number, 0.236, 0.382 and 0.618.
HMA base.
Default source using 21 and 5. These also Fibonacci number.
Alpha version. I have created for my follower and SNS group.

BAHbO BB,RSI strategyThis script is using Bollinger Bands in combination with Oversold/Overbought RSI 2(20,80).

BB Forecast PrototypeExperiment to try apply @atrader2's MA Forecast () to bollinger bands - didn't exactly work out how I expected it to, especially with the Upper/Lower forecast projections.
