5MA_X_LThis is a 5 day moving average crossing long strategy in 10 min. chart, used in short term momentum trading strategy.
Momentum trading Strategy: When S&P 500 index is at up trend (or above 60 sma ), buy 10+ stocks in top 20% stock RS ranking at equal weight using this MA5X_L strategy. Change stocks when any stock exited by algorithm.
Back test start since 2020/7/1, each long entry for condition 1 is $30000, condition 2 is $20000, with max of 2 long positions.
Setup: 10 minutes chart
Buy condition 1) 3 wma cross up 195 wma (5day) 2) 3wma > 78wma > 195wma UP Trend Arrangement (UTA)
Exit condition 1) 3 wma cross under 195 wma 2) position profit > 20% and 3 wma cross under 6 ATRs line (green)
"市值60亿的股票" için komut dosyalarını ara

Anas center line the center line is taken from one method if spliting the screen in two haves , if the price comes to the upper half its up , if going to lower half its sell , I add to make ne lower low and to confirm the direction .
I recomminded to but the same time period of the time frame .
1 min frame = 60
1 hour frame = 24
1 month == 22 (working day candles )
and test for best result .

[blackcat] L1 Jon Andersen R-Squared IndicatorLevel: 1
Background
The R-Squared indicator created by Jon Andersen in "Standard error bands" in the September 1996 STOCKS & COMMODITIES .
Function
This script fristly creates the coeffR function which is used to produced the R-Squared indicator. The coeffR function is used to calculate the correlation coefficient R. Once I have created and verified the coeffR function, the R-Sqaured indicator can be built easily.
Key Signal
AvgSqrR --> Smoothed R-Squared Oscillator Output.
Labels and alerts are added.
Remarks
Feedbacks are appreciated.
Readme
In real life, I am a prolific inventor. I have successfully applied for more than 60 international and regional patents in the past 12 years. But in the past two years or so, I have tried to transfer my creativity to the development of trading strategies. Tradingview is the ideal platform for me. I am selecting and contributing some of the hundreds of scripts to publish in Tradingview community. Welcome everyone to interact with me to discuss these interesting pine scripts.
The scripts posted are categorized into 5 levels according to my efforts or manhours put into these works.
Level 1 : interesting script snippets or distinctive improvement from classic indicators or strategy. Level 1 scripts can usually appear in more complex indicators as a function module or element.
Level 2 : composite indicator/strategy. By selecting or combining several independent or dependent functions or sub indicators in proper way, the composite script exhibits a resonance phenomenon which can filter out noise or fake trading signal to enhance trading confidence level.
Level 3 : comprehensive indicator/strategy. They are simple trading systems based on my strategies. They are commonly containing several or all of entry signal, close signal, stop loss, take profit, re-entry, risk management, and position sizing techniques. Even some interesting fundamental and mass psychological aspects are incorporated.
Level 4 : script snippets or functions that do not disclose source code. Interesting element that can reveal market laws and work as raw material for indicators and strategies. If you find Level 1~2 scripts are helpful, Level 4 is a private version that took me far more efforts to develop.
Level 5 : indicator/strategy that do not disclose source code. private version of Level 3 script with my accumulated script processing skills or a large number of custom functions. I had a private function library built in past two years. Level 5 scripts use many of them to achieve private trading strategy.

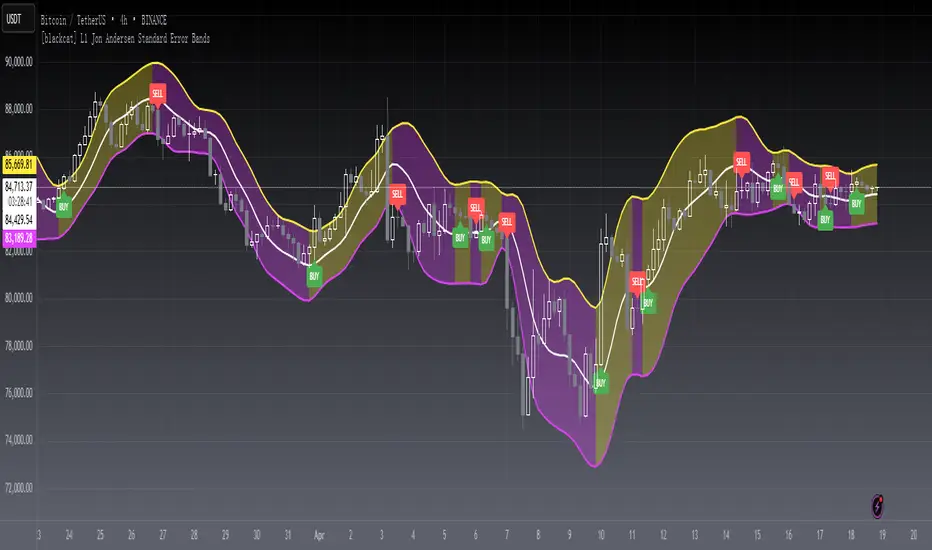
[blackcat] L1 Jon Andersen Standard Error BandsLevel: 1
Background
The standard error bands created by Jon Andersen in "Standard error bands" in the September 1996 STOCKS & COMMODITIES.
Function
This script calculates the beta and alpha coefficients of the linear regression. First, it creates the calcB and calcA functions, which refer to the beta and alpha coefficients. Create calcB first, then calcA. These functions are used in calculating the regression coefficients for the standard error bands. In This standard error bands indicator, the "Length" value specifies the period of the linear regression line; the default is 21. The SDeg value specifies the smoothing factor that is used to smooth the linear regression and standard error bands; the default is 3.
Key Signal
LinRegS --> standard error bands center line
LinRegS + SErr --> standard error bands upper line
LinRegS - SErr --> standard error bands lower line
Labels and alerts are added.
Remarks
Feedbacks are appreciated.
Readme
In real life, I am a prolific inventor. I have successfully applied for more than 60 international and regional patents in the past 12 years. But in the past two years or so, I have tried to transfer my creativity to the development of trading strategies. Tradingview is the ideal platform for me. I am selecting and contributing some of the hundreds of scripts to publish in Tradingview community. Welcome everyone to interact with me to discuss these interesting pine scripts.
The scripts posted are categorized into 5 levels according to my efforts or manhours put into these works.
Level 1 : interesting script snippets or distinctive improvement from classic indicators or strategy. Level 1 scripts can usually appear in more complex indicators as a function module or element.
Level 2 : composite indicator/strategy. By selecting or combining several independent or dependent functions or sub indicators in proper way, the composite script exhibits a resonance phenomenon which can filter out noise or fake trading signal to enhance trading confidence level.
Level 3 : comprehensive indicator/strategy. They are simple trading systems based on my strategies. They are commonly containing several or all of entry signal, close signal, stop loss, take profit, re-entry, risk management, and position sizing techniques. Even some interesting fundamental and mass psychological aspects are incorporated.
Level 4 : script snippets or functions that do not disclose source code. Interesting element that can reveal market laws and work as raw material for indicators and strategies. If you find Level 1~2 scripts are helpful, Level 4 is a private version that took me far more efforts to develop.
Level 5 : indicator/strategy that do not disclose source code. private version of Level 3 script with my accumulated script processing skills or a large number of custom functions. I had a private function library built in past two years. Level 5 scripts use many of them to achieve private trading strategy.
[blackcat] L1 Enhanced DMILevel: 1
Background
The Directional Movement Index (DMI) is an indicator developed by J. Welles Wilder in 1978 that shows the direction in which the price of an asset is moving. The indicator does this by comparing previous highs and lows and drawing two lines: a positive directional movement line (+ DI) and a negative directional movement line (-DI). An optional third line, called the Average Directional Index (ADX), can also be used to measure the strength of the upward or downward trend.
When + DI is above -DI there is more upward pressure than downward pressure in price. Conversely, when -DI is above + DI, there is more downward pressure on the price. This indicator can help traders estimate the direction of the trend. Crossovers between the lines are also sometimes used as trading signals to buy or sell.
Function
This is a blackcat1402 enhanced DMI indicator by counting period number of +DI and -DI relationship, overbought and oversold states are given.
Key Signal
White line --> +DI
Yellow line --> -DI
Fuchsia line --> ADX
Green line --> ADXR, or averaged ADX
red OB label --> overbought
green OS label --> oversold
Remarks
Feedbacks are appreciated.
Readme
In real life, I am a prolific inventor. I have successfully applied for more than 60 international and regional patents in the past 12 years. But in the past two years or so, I have tried to transfer my creativity to the development of trading strategies. Tradingview is the ideal platform for me. I am selecting and contributing some of the hundreds of scripts to publish in Tradingview community. Welcome everyone to interact with me to discuss these interesting pine scripts.
The scripts posted are categorized into 5 levels according to my efforts or manhours put into these works.
Level 1 : interesting script snippets or distinctive improvement from classic indicators or strategy. Level 1 scripts can usually appear in more complex indicators as a function module or element.
Level 2 : composite indicator/strategy. By selecting or combining several independent or dependent functions or sub indicators in proper way, the composite script exhibits a resonance phenomenon which can filter out noise or fake trading signal to enhance trading confidence level.
Level 3 : comprehensive indicator/strategy. They are simple trading systems based on my strategies. They are commonly containing several or all of entry signal, close signal, stop loss, take profit, re-entry, risk management, and position sizing techniques. Even some interesting fundamental and mass psychological aspects are incorporated.
Level 4 : script snippets or functions that do not disclose source code. Interesting element that can reveal market laws and work as raw material for indicators and strategies. If you find Level 1~2 scripts are helpful, Level 4 is a private version that took me far more efforts to develop.
Level 5 : indicator/strategy that do not disclose source code. private version of Level 3 script with my accumulated script processing skills or a large number of custom functions. I had a private function library built in past two years. Level 5 scripts use many of them to achieve private trading strategy.

Stochastic RSI - DurbtradeDurbtrade Stoch RSI -
1) Stoch RSI
A) The K line can be customized to change color based on vertical direction.
B) The space between K line and D line can be filled with a color depending on whether K line is above or below the D line.
C) There are color-coded, cross-over and cross-under background fills, to signal when the K line crosses the D line.
D) K line is drawn in front of D line (D line is drawn behind K line).
E) Default values : K = 3, D = 4, RSI Length = 14, Stoch Length = 14
2) Horizontal Lines
A) Horizontal lines can be drawn automatically, so you don't have to draw them, and they don't extend past the current bar.
B) There are 11 customizable horizontal lines,
and each line is set to non-customizable increments (zero, 10, 20, 30, 40, fifty, 60, 70, 80, 90, hundred).
C) The 11 lines are divided into 2 groups:
a) 4 PAIRS of lines WITH fill options (10/90, 20/80, 30/70, 40/60... 8 lines total), and
b) 3 INDIVIDUAL lines WITHOUT fill options (zero, fifty, hundred).
D) The 4 fills give you the option to fill the space between each pair with a customizable color and opacity,
regardless of whether the lines themselves are drawn or not.
(all default values are what I feel work best for this indicator...
and initially, only the zero, fifty, and hundred lines are drawn automatically .
You may add the other lines if you choose to, by adjusting the opacity to your liking).
3) Conclusion
A) As with my previous indicators, this one maximizes information, color, discernment, clarity, and customization.
B) It is optimized for your ability to be able to easily customize the indicator according to your preferences...
for use on your own personal television, laptop, or cellular phone screen setup... and on all chart zoom levels and layouts.
C) Please feel free to comment your thoughts, critiques, or suggestions. They are all helpful!
D) Check out my previous pine script indicators if you like this one. They work really well together.
E) I hope that you find this script useful.
F) Enjoy!
//Durbtrade

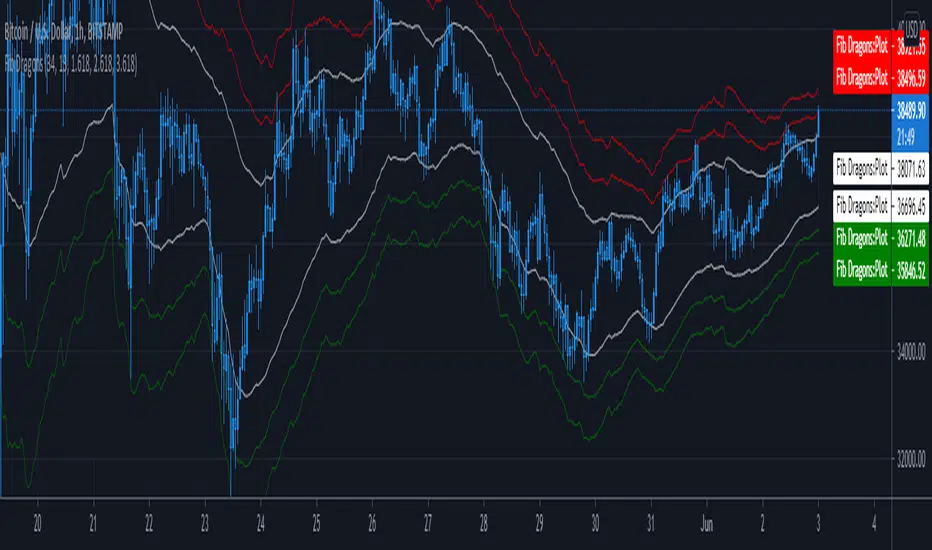
Fib DragonsCreates bands based on Fibonacci golden ratio numbers and EMA w/ATR
This allows for a faster reaction and significantly less lag than SMA w/ATR
EMA is set to 34 - Recommend range by taste 21, 34, 55, 62
ART is set to 13 - Recommend 13 or 21
Fib Bands are set to 1.618, 2.618, 3.618 however you can set to what works for you. I recommend keeping them at the golden ratios.
Based on indicator by rstraat
How to trade - Same rules apply
- Best to use in ranging market conditions
- Place on two different time frames such as the 15 min. and 60 min for intraday trading
- Take trades off either short or long term chart.
- Best trades occur when both charts show same trigger/condition.
- Trades are short term reversals in direction of major trend on longer term chart unless you expect a trend reversal.
- Determine which band is the limiting band for the volatility of the instrument.
- When the market closes outside of the limiting band then returns inside, take a long/short one tick above/below the high/low of the previous bar.
- Place stop below/above the low/high of the the recent swing low/high.
- Set targets at opposite band of chart
Use any oscillator you favor or see fit with this indicator or any other strategies that work for you.
[EURUSD60] BB Expansion StrategyOverview
This is a strategy that can be used in the EURUSD 60 time frame.
It is a trend-following method that uses Bollinger Bands Expansions.
The idea of using Bollinger Bands expansion is well known to the general public, but I don’t know any strategy that this idea has been PINE coded.
The three main components of this strategy are as follows.
・Long term BB and Short term BB : When the short term BB expands more than the long term BB, it suggests the occurrence of a trend.
・14EMA of 240 t/f : The direction of 14EMA of the upper time frame is used as the trend direction.
・ATR lines : As a stop-loss line and a take-profit line.
Description
Fig. Long entry pattern
Fig. Short entry pattern
・Description of lines
Gray : Large BB (=Long term BB)
White : Small BB (=Short term BB)
Blue or Red line : Upper t/f EMA(default: 14EMA), blue is up-trend, red is down-trend
Yellow : Stop loss line by ATR(the term is 14)
Purple : Take profit line by ATR(the term is 14)
・Description of strategy
First of all, when the small BB expands more than the large BB, this strategy detects the occurrence of a trend.
Second, When the price crosses over or crosses under small BB basis, this strategy entries long or short to trend direction (by upper time frame 14EMA).
The default stop-loss range is three times ATR value, and the default take-profit target is 1.5 times the stop-loss range (=risk reward ratio is 1.5).

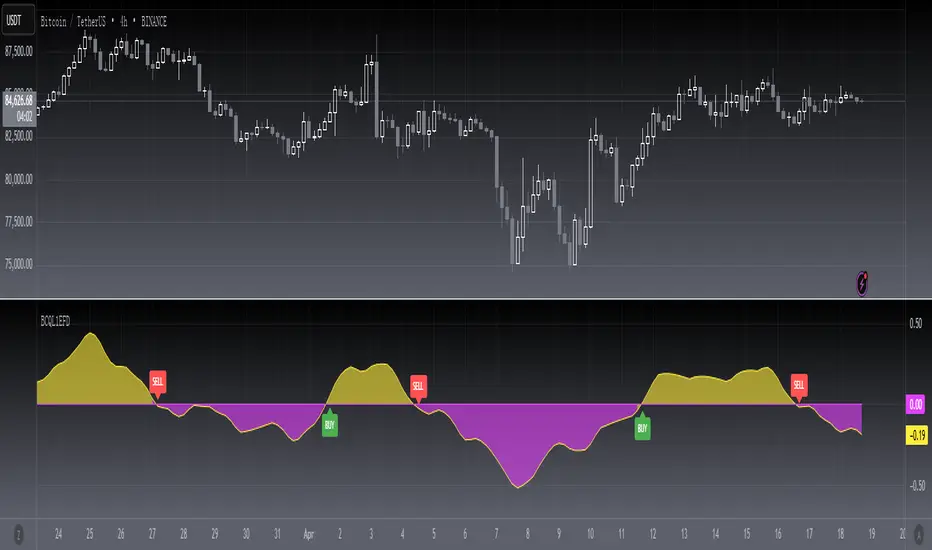
[blackcat] L1 Vitali Apirine Rate Of Change With BandsLevel: 1
Background
Vitali Apirine introuced this RoC indicator of “Rate Of Change With Bands” on March 2021.
Function
In Vitali Apirine's article “Rate Of Change With Bands” , the author introduces a concept of identifying overbought and oversold levels based on calculating standard deviation bands of the rate of change (ROC) momentum oscillator. The rate of change bands widen and narrow as the ROC deviation increases and decreases. The author proposes using this indicator in conjunction with other technical analysis methods to determine if the instrument is overbought or oversold.
Key Signal
UpperBand --> overbought threshold
oMARoc --> Output RoC Moving Average
LowerBand --> oversold threshold
Labels
L --> Long
S --> Short
XL --> Close Long
XS --> Close Short
Pros and Cons
100% Vitali Apirine definition translation, even variable names are the same. This help readers who would like to use pine to read his article.
Remarks
The 1st script for Blackcat1402 Vitali Apirine series publication.
Readme
In real life, I am a prolific inventor. I have successfully applied for more than 60 international and regional patents in the past 12 years. But in the past two years or so, I have tried to transfer my creativity to the development of trading strategies. Tradingview is the ideal platform for me. I am selecting and contributing some of the hundreds of scripts to publish in Tradingview community. Welcome everyone to interact with me to discuss these interesting pine scripts.
The scripts posted are categorized into 5 levels according to my efforts or manhours put into these works.
Level 1 : interesting script snippets or distinctive improvement from classic indicators or strategy. Level 1 scripts can usually appear in more complex indicators as a function module or element.
Level 2 : composite indicator/strategy. By selecting or combining several independent or dependent functions or sub indicators in proper way, the composite script exhibits a resonance phenomenon which can filter out noise or fake trading signal to enhance trading confidence level.
Level 3 : comprehensive indicator/strategy. They are simple trading systems based on my strategies. They are commonly containing several or all of entry signal, close signal, stop loss, take profit, re-entry, risk management, and position sizing techniques. Even some interesting fundamental and mass psychological aspects are incorporated.
Level 4 : script snippets or functions that do not disclose source code. Interesting element that can reveal market laws and work as raw material for indicators and strategies. If you find Level 1~2 scripts are helpful, Level 4 is a private version that took me far more efforts to develop.
Level 5 : indicator/strategy that do not disclose source code. private version of Level 3 script with my accumulated script processing skills or a large number of custom functions. I had a private function library built in past two years. Level 5 scripts use many of them to achieve private trading strategy.

[blackcat] L1 Ehlers FM DemodulatorLevel: 1
Background
John F. Ehlers introuced FM demodulator of "A Technical Description Of Market Data For Traders" on TASC MAY 2021
Function
John Ehlers introduces the use of FM modulation to determine the cycles of market data. The author also proposes that noise in market data does not necessarily mean chaos and that pink noise in the data implies memory in the data. According to the author, peaks and valleys of the FM demodulator indicator that he presents in the article can be correlated with major swings of the price. The FM demodulator indicator (FMD) ranges from -1.0 to 1.0. There is a natural delay in the detection of peaks and troughs, as we need to wait while the indicator has moved by a certain amount. The example system buys as soon as a new higher trough has been confirmed.
Key Signal
SS --> FM Demodulator ouput
Pros and Cons
100% John F. Ehlers definition translation, even variable names are the same. This help readers who would like to use pine to read his book.
Remarks
The 103rd script for Blackcat1402 John F. Ehlers Week publication.
Readme
In real life, I am a prolific inventor. I have successfully applied for more than 60 international and regional patents in the past 12 years. But in the past two years or so, I have tried to transfer my creativity to the development of trading strategies. Tradingview is the ideal platform for me. I am selecting and contributing some of the hundreds of scripts to publish in Tradingview community. Welcome everyone to interact with me to discuss these interesting pine scripts.
The scripts posted are categorized into 5 levels according to my efforts or manhours put into these works.
Level 1 : interesting script snippets or distinctive improvement from classic indicators or strategy. Level 1 scripts can usually appear in more complex indicators as a function module or element.
Level 2 : composite indicator/strategy. By selecting or combining several independent or dependent functions or sub indicators in proper way, the composite script exhibits a resonance phenomenon which can filter out noise or fake trading signal to enhance trading confidence level.
Level 3 : comprehensive indicator/strategy. They are simple trading systems based on my strategies. They are commonly containing several or all of entry signal, close signal, stop loss, take profit, re-entry, risk management, and position sizing techniques. Even some interesting fundamental and mass psychological aspects are incorporated.
Level 4 : script snippets or functions that do not disclose source code. Interesting element that can reveal market laws and work as raw material for indicators and strategies. If you find Level 1~2 scripts are helpful, Level 4 is a private version that took me far more efforts to develop.
Level 5 : indicator/strategy that do not disclose source code. private version of Level 3 script with my accumulated script processing skills or a large number of custom functions. I had a private function library built in past two years. Level 5 scripts use many of them to achieve private trading strategy.
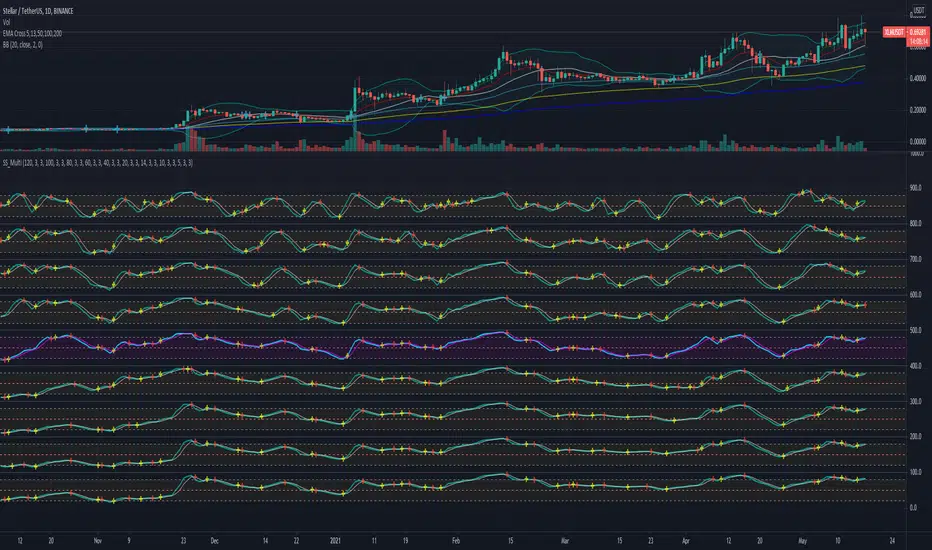
Slow Stochastic MultiFrame - AFPThis script enables you to use 9 slow stochastic with timeframe 5, 10, 14, 20, 40, 60, 80, 100, 120; on purposes to see from longterm and short term condition of a stock.
[blackcat] L1 Ehlers Phasor IndicatorLevel: 1
Background
This script was requested by @pips_v1. "A cycle is one market characteristic that can be scientifically measured. Although they can be measured, they are still maddening because they are in essence ephemeral; they come and they go. Our recent research, however, indicates there is a fundamental cycle parameter that leads us to the correct trading strategy for any current market mode." by John Ehlers
Function
John Ehlers describe the principle of phasor indicator as "One easy way to picture a cycle is as an indicator arrow bolted to a rotating shaft, as can be seen in a phasor diagram. Each time the arrowhead sweeps through one complete rotation, a cycle is completed. The phase increases uniformly throughout the cycle. The phase continues for the next cycle but is usually drawn as reset to zero to start the next cycle." The parameter we use is the phase of the cycle. The measured phase tells us with great sensitivity when we are in the trend mode, enabling the capture of a large fraction of the trend movement.
Key Signal
Phase --> Ehlers Phasor signal
Pros and Cons
100% John F. Ehlers definition translation of his publications, even variable names are the same. This help readers who would like to use pine to read his book.
Remarks
The 102th script for Blackcat1402 John F. Ehlers Week publication.
Readme
In real life, I am a prolific inventor. I have successfully applied for more than 60 international and regional patents in the past 12 years. But in the past two years or so, I have tried to transfer my creativity to the development of trading strategies. Tradingview is the ideal platform for me. I am selecting and contributing some of the hundreds of scripts to publish in Tradingview community. Welcome everyone to interact with me to discuss these interesting pine scripts.
The scripts posted are categorized into 5 levels according to my efforts or manhours put into these works.
Level 1 : interesting script snippets or distinctive improvement from classic indicators or strategy. Level 1 scripts can usually appear in more complex indicators as a function module or element.
Level 2 : composite indicator/strategy. By selecting or combining several independent or dependent functions or sub indicators in proper way, the composite script exhibits a resonance phenomenon which can filter out noise or fake trading signal to enhance trading confidence level.
Level 3 : comprehensive indicator/strategy. They are simple trading systems based on my strategies. They are commonly containing several or all of entry signal, close signal, stop loss, take profit, re-entry, risk management, and position sizing techniques. Even some interesting fundamental and mass psychological aspects are incorporated.
Level 4 : script snippets or functions that do not disclose source code. Interesting element that can reveal market laws and work as raw material for indicators and strategies. If you find Level 1~2 scripts are helpful, Level 4 is a private version that took me far more efforts to develop.
Level 5 : indicator/strategy that do not disclose source code. private version of Level 3 script with my accumulated script processing skills or a large number of custom functions. I had a private function library built in past two years. Level 5 scripts use many of them to achieve private trading strategy.

Multi Resolution RSIThis is a Multi resolution or multi Time frame RSI.
This indicator is made to see 3 different time frames RSI in a single Band.
User can input all 3 timeframes on input section.
The Highest time RSI is denoted in BLACK color.
The Medium time RSI is denoted in BLUE color.
The Smaller time RSI is denoted in GREEN color.
The overbought and oversold region is 70 and 30.
The best way to trade using this indicator is when Higher and medium RSI is above 60 and lower is below 40.

RSI Candle Bar with Inside BarThis Indicator is RSI convert into Candle Bar with Inside Bar Candle
How to use :
Do Some setting
RSI Overbought - 60 It will shows in Blue Candle Bar means Bullish Signal
RSI Oversold - 40 It will shows in Yellow Candle Bar means Bearish Signal
Inside Bar Candle -
Gray or Black Bar --- Which is Shows that Trend may be Reverse or Big Move may be come.
Colors you can be change according to your convenience.

RSI Trend Indicator [paRSI]The Relative Strength Index ( RSI ) is a measurement used by traders to assess the price momentum. It is scaled from 0 to 100. when RSI reads below 30, it is usually interpreted as oversold and when RSI is above 70 it is usually interpreted as overbought. However, it is usually not profitable to trade based on overbought and oversold signal.
RSI Trend Indicator or as I like to call it "paRSI" ("Parsa (my name) + RSI") shows that when RSI is above a specific number (default value = 60) it indicates bullish trend and when RSI is below a specific number (default value = 40 ) it indicates bearish trend. Lastly when RSI is below the 2 specified numbers it indicates a neutral trend.
I don't recommend trading based on this single indicator. If you're a trend trader this might be useful tool in addition to your own strategy
Usage:
If the created pattern has worked previously on the chart, you could enter on the first stages of the green or red section (depending on the market's trend).
It is not recommended to trade in any direction when there is no color
*THIS IS A TREND FOLLOWING STRATEGY AND DOES NOT WORK ON ALL MARKETS*
