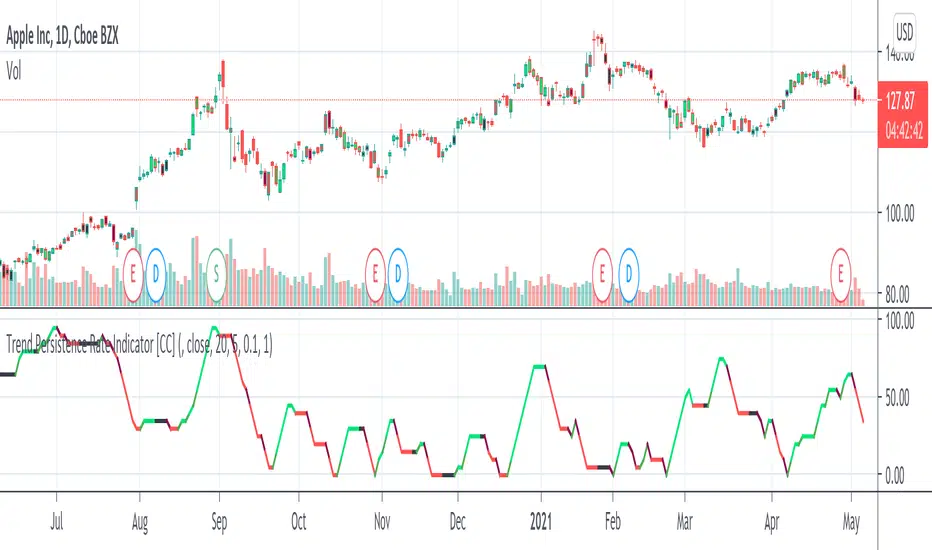
Trend Persistence Rate Indicator [CC]The Trend Persistence Rate Indicator was created by Richard Poster (Stocks and Commodities Feb 2021 pg 12) and this indicator is a good trend strength indicator similar to ADX. A good strategy with this indicator according to the author is to combine this with a moving average crossover strategy and a volatility indicator. Buy when the price crosses over the moving average and when the volatility and this indicator are over a selected minimum. I think 30-40 as a minimum for this indicator works well. Exit that position when this indicator peaks and starts to go down and it should be very profitable for you. I have included general buy and sell signals with this indicator as well.
Let me know if there are any other indicators you would like to see me publish!
Komut dosyalarını "宁德时代2021年净利润+资产负债率" için ara
Ehlers FM Demodulator Indicator [CC]The FM Demodulator Indicator was created by John Ehlers (Stocks and Commodities May 2021 pg 14) and this indicator was created to accurately time any price variations which I think it does a great job. It is smoothed by default with his super smoother but feel free to substitute your own and try different combos. Buy when the line turns green and sell when it turns red.
Let me know if there are any other indicators you would like to see me publish!

Ehlers AM Detector [CC]The AM Detector was created by John Ehlers (Stocks and Commodities May 2021 pg 14) and this is his first volatility indicator I believe. Since this is a more informational indicator rather than a buy or sell signal generator, I have included buy and sell signals for a simple moving average but feel free to use this in combo with any other system you use. Buy when the line turns green and sell when it turns red.
Let me know if there are any other indicators you would like to see me publish!

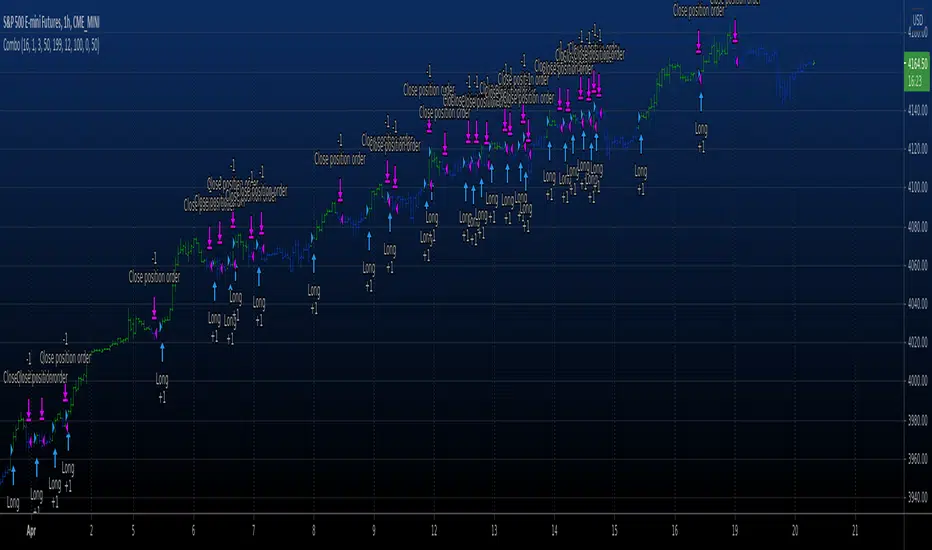
Combo Backtest 123 Reversal & Pivot Detector Oscillator Copyright by HPotter v1.0 20/04/2021
This is combo strategies for get a cumulative signal.
First strategy
This System was created from the Book "How I Tripled My Money In The
Futures Market" by Ulf Jensen, Page 183. This is reverse type of strategies.
The strategy buys at market, if close price is higher than the previous close
during 2 days and the meaning of 9-days Stochastic Slow Oscillator is lower than 50.
The strategy sells at market, if close price is lower than the previous close price
during 2 days and the meaning of 9-days Stochastic Fast Oscillator is higher than 50.
Second strategy
The Pivot Detector Oscillator, by Giorgos E. Siligardos
The related article is copyrighted material from Stocks & Commodities 2009 Sep
WARNING:
- For purpose educate only
- This script to change bars colors.
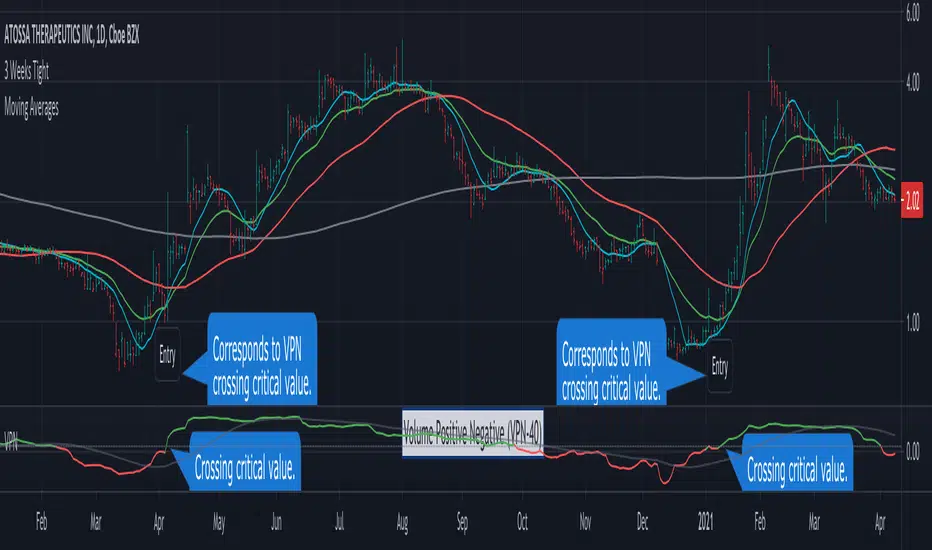
Volume Positive Negative (VPN)The idea and calculations for the Volume Positive Negative (VPN) indicator were created by Markos Katsanos. Markos wrote about the indicator in the article Detecting High-Volume Breakouts, published in Technical Analysis of Stocks & Commodities April, 2021 (Vol. 39, Issue 5).
The goal of the VPN indicator is to detect breakouts using only volume. The basic idea is to compare volume on up days versus volume on down days. The indicator can oscillate between the range of -100 and 100. Values between 0 and 20 are generally considered bullish, negative are bearish.
When the plotted VPN crosses over what Markos refers to as the critical value, that may indicate a high volume breakout. The critical value can be adjusted between 0 to 20, 10 is the default,
Volume Positive Negative Calculation (VPN)
VPN = (VP - VN) / MAV / Period * 100
VP - sum of positive volume
VN - sum of negative volume
MAV - moving average of volume
Volume is considered positive when the average price is higher than the previous day's price by more than .1 of the ATR (average true range).
Pinescript - Standard Array Functions Library by RRBStandard Array Functions Library by RagingRocketBull 2021
Version 1.0
This script provides a library of every standard Pinescript array function for live testing with all supported array types.
You can find the full list of supported standard array functions below.
There are several libraries:
- Common String Functions Library
- Common Array Functions Library
- Standard Array Functions Library
Features:
- Supports all standard array functions (30+) with all possible array types* (* - except array.new* functions and label, line array types)
- Live Output for all/selected functions based on User Input. Test any function for possible errors you may encounter before using in script.
- Output filters: show errors, hide all excluded and show only allowed functions using a list of function names
- Console customization options: set custom text size, color, page length, line spacing
Notes:
- uses Pinescript v3 Compatibility Framework
- uses Common String Functions Library
- has to be a separate script to reduce the number of local scopes in Common Array Function Library, there's no way to merge these scripts into a single library.
- lets you live test all standard array functions for errors. If you see an error - change params in UI
- array types that are not supported by certain functions and producing a compilation error were disabled with "error" showing up as result
- if you see "Loop too long" error - hide/unhide or reattach the script
- doesn't use pagination, a single str contains all output
- for most array functions to work (except push), an array must be defined with at least 1 pre-existing dummy element 0.
- array.slice and array.fill require from_index < to_index otherwise error
- array.join only supports string arrays, and delimiter must be a const string, can't be var/input. Use join_any_array to join any array type into string. You can also use tostring() to join int, float arrays.
- array.sort only supports int, float arrays. Use sort_any_array from the Common Array Function Library to sort any array type.
- array.sort only sorts values, doesn't preserve indexes. Use sort_any_array from the Common Array Function Library to sort any array while preserving indexes.
- array.concat appends string arrays in reverse order, other array types are appended correctly
- array.covariance requires 2 int, float arrays of the same size
- tostring(flag) works only for internal bool vars, flag expression can't depend on any inputs of any type, use bool_to_str instead
- you can't create an if/function that returns var type value/array - compiler uses strict types and doesn't allow that
- however you can assign array of any type to another array of any type creating an arr pointer of invalid type that must be reassigned to a matching array type before used in any expression to prevent error
- source_array and create_any_array2 use this loophole to return an int_arr pointer of a var type array
- this works for all array types defined with/without var keyword. This doesn't work for string arrays defined with var keyword for some reason
- you can't do this with var type vars, this can be done only with var type arrays because they are pointers passed by reference, while vars are the actual values passed by value.
- wrapper functions solve the problem of returning var array types. This is the only way of doing it when the top level arr type is undefined.
- you can only pass a var type value/array param to a function if all functions inside support every type - otherwise error
- alternatively values of every type must be passed simultaneously and processed separately by corresponding if branches/functions supporting these particular types returning a common single result type
- get_var_types solves this problem by generating a list of dummy values of every possible type including the source type, allowing a single valid branch to execute without error
- examples of functions supporting all array types: array.size, array.get, array.push. Examples of functions with limited type support: array.sort, array.join, array.max, tostring
- unlike var params/global vars, you can modify array params and global arrays directly from inside functions using standard array functions, but you can't use := (it only works for local arrays)
- inside function always work with array.copy to prevent accidental array modification
- you can't compare arrays
- there's no na equivalent for arrays, na(arr) doesn't work
P.S. A wide array of skills calls for an even wider array of responsibilities
List of functions:
- array.avg(arr)
- array.clear(arr)
- array.concat(arr1, arr2)
- array.copy(arr)
- array.covariance(arr1, arr2)
- array.fill(arr, value, index_from, index_to)
- array.get(arr, index)
- array.includes(arr, value)
- array.indexof(arr, value)
- array.insert(arr, index, value)
- array.join(arr, delimiter)
- array.lastindexof(arr, value)
- array.max(arr)
- array.median(arr)
- array.min(arr)
- array.mode(arr)
- array.pop(arr)
- array.push(arr, value)
- array.range(arr)
- array.remove(arr, index)
- array.reverse(arr)
- array.set(arr, index, value)
- array.shift(arr)
- array.size(arr)
- array.slice(arr, index_from, index_to)
- array.sort(arr, order)
- array.standardize()
- array.stdev(arr)
- array.sum(arr)
- array.unshift(arr, value)
- array.variance(arr)

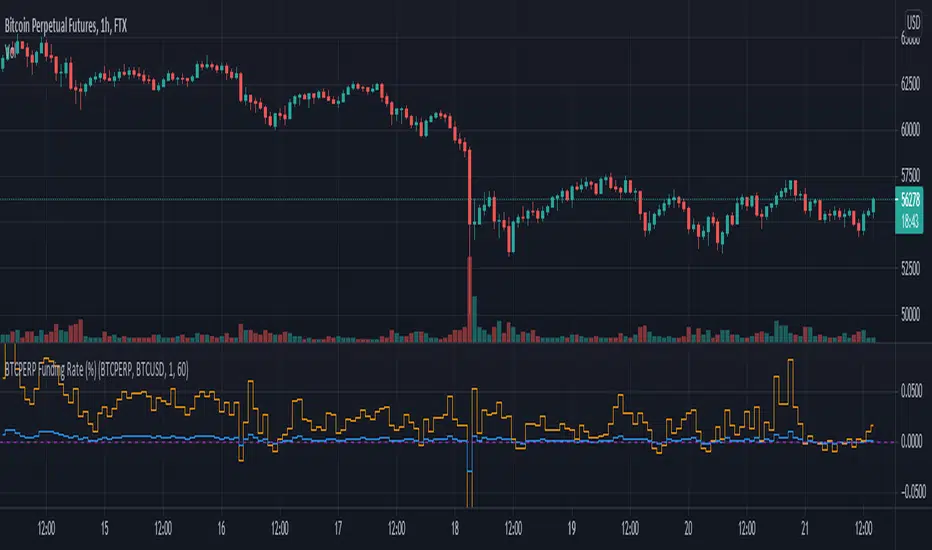
Funding Rate for FTX:BTCPERP (estimated) v0.1 Original credits goes to @Hayemaker, and @NeoButane for the TWAP portions of this script
By @davewhiiite, 2021-03-27
Version 0.1
Summary: The funding rate is the interest charged / credited to a perpetual futures trader for taking a long or short position. The direction of the funding rate is used as an indicator of trader sentiment (+ve = bullish; -ve = bearish), and therefore useful to plot in real time.
The FTX exchange has published the calculation of their funding rate as follows:
TWAP((future - index) / index) / 24
The formula here is the same, but expresses it in the more common % per 8hr duration:
funding = TWAP((future / index) - 1) * (8 / 24) * 100
For reference: future refers to the FTX bitcoin futures contract price (FTX:BTCPERP) and index is the spot price of bitcoin on the exchange (FTX:BTCUSD)
Additional notes:
Probably best to add to the indicator to a new pane, or as secondary axis
Plot this in combination with FTX:BTCPERP or FTX:BTCUSD, or chart of your choice to complement your bitcoin dashboard
Compare to funding rates published on ViewBase
questions? Ask me!
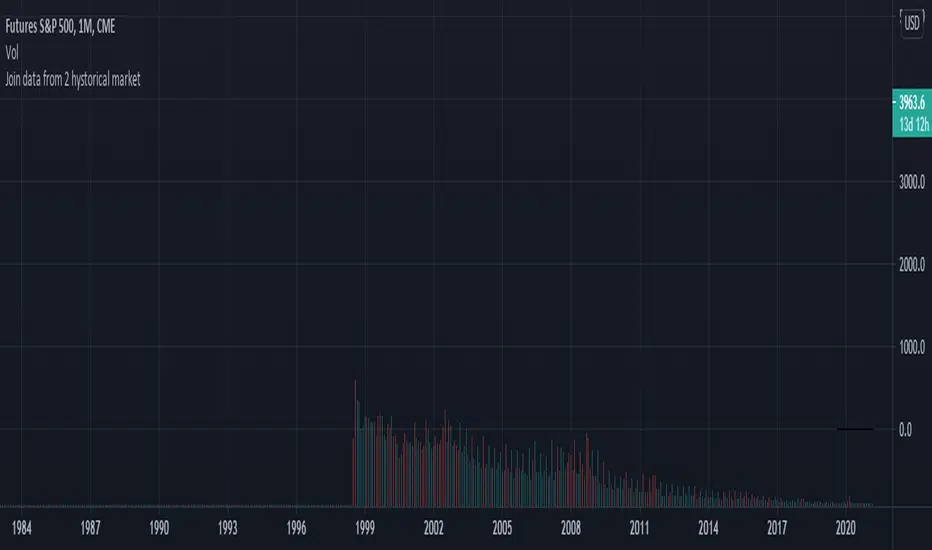
Join data and union of 2 hystorical markets
How to create a union from two contiguous Tradingview tickers (series)
Francesco Marzolo March 18, 2021
Go to the older ticker of the two, for example CME: SP1! and open it on Tradingview.
On the graph thus created, add this script.
In the indicator settings select the same ticker as the chart in Symbol1
while in Symbol2 the ticker from which to retrieve the most recent data, for example: SPX500
The operation this script does is examine each bar of the two tickers, where there is a value for the second it holds this one, where it does not exist in second ticker it keeps the value of the first one. This new series is called Merge. So now in the chart there will be 4 series:
- that of the original chart without script
- the same series loaded via script (Symbol1)
- series 2 of "new" data (Symbol2)
- the Merge series that "prefers" the Symbol2 data if present, otherwise it shows Symbol1
So now you have to change the visibility of the 4 series to see the differences:
- turn off the visibility of the chart indicator
- turn off the Symbol1 series in the script properties (old data only)
- switch off the Symbol2 series as well (only new data)
- switch on the Merge series (new data if existing, old if not present in the new ticker)
Pinescript - Common String Functions Library by RRBCommon String Functions Library by RagingRocketBull 2021
Version 1.0
Pinescript now has strong support for arrays with many powerful functions, but still lacks built-in string functions. Luckily you can easily process and manipulate strings using arrays.
This script provides a library of common string functions for everyday use, such as: indexOf, substr, replace, ascii_code, str_to_int etc. There are 100+ unique functions (130 including all implementations)
It should serve as building blocks to speed up the development of your custom scripts. You should also be able to learn how Pinescript arrays works and how you can process strings.
Similar libraries for Array and Statistical Functions are in the works. You can find the full list of functions below.
Features:
- 100+ unique string functions (130 including all implementations) in categories: lookup, testing, conversion, modification, extraction, type conversion, date and time, console output
- Live Output for all/selected functions based on User Input. Test any function before using in script.
- Live Unit Test Output for several functions based on pre-defined inputs.
- Output filters: show unique functions/all implementations, grouping
- Console customization options: set custom text size, color, page length
- Support for Pages - auto splits output into pages with fixed length, use pages in your scripts
- Several easy to use console output functions to speed up debugging/output.
WARNING:
- Compilation Time: 1 min
Notes:
- uses Pinescript v3 Compatibility Framework
- this script is packed to the max and sets a new record in testing of Pinescript's limits: 500 local scopes, 4000+ lines, 180kb+ source size. It's not possible to add more ifs/fors/functions without reducing functionality
- to fit the max limit of local scopes = 500 all ifs were replaced with ?: where possible, the number of function calls was reduced, some calls replaced with inline function code
- ifs are faster (especially when lots of them are used in a for cycle), more readable, but ifs/fors/functions increase local scopes (+1) and compiled file size, have max nesting limit = 10.
- ?: are slower (especially in for cycles), hard to read when nested, don't affect local scopes, reduce compiled file size, can't contain plots, for statements (break/continue) and sets of statements
- for most array functions to work (except push), an array must be defined with at least 1 pre-existing dummy element 0.
- if you see "String too long" error - enable Show Pages, reduce Max Chars Per Page < Max String Length limit = 4096.
- if you see "Loop too long" error - hide/unhide or reattach the script
- some functions have several implementations that can be faster/slower, use internal code/ext functions
- 1 is manual string processing using for cycles (array.get) and ext functions - provided in case you want to implement your own logic, may sometimes be slower
- 2 is a 2nd alternate implementation mostly done using built-in functions (array.indexof, array.slice, array.insert, array.remove, str.replace_all),
attempts to minimize local scopes and dependency on ext functions, should generally be faster
- 3 is a 3rd alternate (array.includes, array.fill) or a more advanced implementation (datetime3_str) with lots of params, giving you the most control over output
- most functions have dependencies, such as const names, global arrays, inputs, other functions.
P.S. Strings of Time may be closed unto themselves or have loose ends; they can vibrate, stretch, join or split.
Function Groups:
1. Char Functions
- repeat(str, num)
- ascii_char(code)
- ascii_code(char)
- is_digit(char)
- is_letter(char)
- digit_to_int(char)
- is_space_char(char)
2. Char Test and Lookup Functions
- char_at(str, pos)
- char_code_at(str, pos)
- indexOf_char(str, char)
- lastIndexOf_char(str, char)
- nth_indexOf_char(str, char, num)
- includes_char(str, char)
3. String Lookup Functions
- indexOf(str, target)
- lastIndexOf(str, target)
- nth_indexOf(str, target, num)
- indexesOf(str, target)
- numIndexesOf(str, target)
4. String Conversion Functions
- lowercase(str)
- uppercase(str)
5. String Modification and Extraction Functions
- split(str, separator)
- insert(str, pos, new_str)
- remove(str, pos, length)
- insert_char(str, pos, char)
- remove_char(str, pos)
- reverse(str)
- fill_char(str, char, start_pos, end_pos)
- replace(str, target, new_str)
- replace_first(str, target, new_str)
- replace_last(str, target, new_str)
- replace_nth(str, target, new_str, num)
- replace_left(str, new_str)
- replace_right(str, new_str)
- replace_middle(str, pos, new_str)
- left(str, num)
- right(str, num)
- first_char(str)
- last_char(str)
- truncate(str, max_len)
- truncate_middle2(str, trunc_str, pos, max_len)
- truncate_from2(str, trunc_str, pos, max_len, side)
- concat(str1, str2, trunc_str, max_len, mode)
- concat_from(str1, str2, trunc_str, max_len, side, mode)
- trim(str)
- substr(str, pos, length)
- substring(str, start_pos, end_pos)
- strip(str, mask, target, is_allowed)
- extract_groups(str)
- extract_numbers(str, d1, d2, mode)
- str_to_float(str, d1, d2)
- str_to_int(str)
- extract_ranges(str, d1, d2, d3, type)
6. String Test Functions
- includes(str, target)
- starts_with(str, target)
- ends_with(str, target)
- str_compare(str1, str2)
7. Type Conversion Functions
- tf_check2(tf)
- tf_to_mins()
- convert_tf(tf)
- period_to_mins(tf)
- convert_tf2(tf)
- convert_tf3(tf)
- bool_to_str(flag)
- get_src(src_str)
- get_size(size_str)
- get_style(style)
- get_bool(bool_str)
- get_int(str)
- get_float(str, d1, d2)
- get_color(str, def_color)
- color_tr2(col_str, transp)
- get_month(str)
- month_name(num, format)
- weekday_name(num, format)
- dayofweek_name(t)
8. Date and Time Functions
- date_str(t, d)
- time_str(t, d)
- datetime_str(t, d1, d2)
- date2_str(t, d, type)
- time2_str(t, d, type)
- datetime2_str(t, d1, d2, format1, format2)
- date3_str(t, template)
- time3_str(t, template)
- datetime3_str(t, template)
9. Console Output & Helper Functions
- echo1(con, str)
- echo2(x, y, con, str)
- echo3(v_shift, con, str, msg_color, text_size)
- echo4(x, y, con, str, msg_style, msg_color, text_size, text_align, msg_xloc)
- echo5(x, y, con, str, msg_style, msg_color, text_size, text_align, msg_xloc)
- echo6(x, y, con, str)
- echo7(v_shift, con, str, msg_color, text_size)
- echo8(x, y, con, str, msg_style, msg_color, text_size, text_align, msg_xloc)
- echo9(x, y, con, str, msg_style, msg_color, text_size, text_align, msg_xloc)
- new_page(str, line_str, trunc_str, header_str, footer_str, length, page_count, page, mode)

EMA EMA Barcolor 2021-2-11This one is pretty straightforward. The price bars are colored based on the position of two moving averages. This setting can be applied anywhere the crossing of two EMAs appear meaningful. Coloring the price bars remove any ambiguity and makes the price action stand out. Applying this setting to multiple time frames is where it will shine!

Precise_SignalThis signal combines a portion of Chris Moody's 2014 SlingShot and my 2017 MTF Indicators. Both of our prior scripts over indicated Buy and Sell Points. This signal indicates a buy or sell point much less than our prior scripts did but with absolute precision.
I would say it is 100% accurate, but that is because I am yet to find a timeframe and symbol where the Buy signal failed to see the equity move up or the Sell signal failed to see the equity move down over the next 5 bars. I have tested 2000 charts so far. To be safe, I would rather state this indicator is accurate nearly 100% of the time.
The indicator is made up of 2 main portions and both of them have to agree on a buy or sell in order to indicate such with a vertical green or maroon bar beneath the chart. If there is a failure to agree, nothing is signaled.
Indicator 1 combines a stochastic of a 3 hour chart and a daily chart to determine when the stochastics are in agreement on direction. When there is agreement, both of them MUST cross from a buy state to a sell state and vice versa at exactly the same time. This is difficult to achieve and it is already rare for this occurrence to produce a signal. When a signal is produce it is combine with Chris Moody's 2014 SlingShot Indicator which conservatively determines Buy and Sell signals based on EMAs and market direction. Signals from his SlingShot are infrequent.
BUY Signal
When my MTF signals Buy at the same time that the SlingShot signals a Buy, a vertical green bar will appear in the window containing this script. The vertical bar is based on the close price of the equity and is only final when the close price is final. A BUY signal means the equity will move up potentially as early as the next bar and achieve a higher value from the close price on the signal bar.
SELL Signal
Likewise, a sell signal from the MTF at the same time as a sell signal from the SlingShot will create a maroon bar in the window containing this script. The vertical bar is based on the close price of the equity and is only final when the close price is final. A SELL signal means the equity will move down potentially as early as the next bar and achieve a lower value from the close price on the signal bar.
The default values for this script are hard-coded into this script. You can edit any of the value you would like to play with other timeframes, stochastic, and moving average lengths.
I have played with these values and have hard-coded the ones that are most accurate. Please let me know if you find others that work.
Hopefully this becomes an extra tool in your technical trading toolkit.

GBTC holdings USD market valueThis script estimates GBTC bitcoins per share, rather than hardcoding as in other scripts. Its result is an estimate of GBTC holdings USD market value.
Per share bitcoin estimates are adjusted by 2.0% / 365 per day from 2019 year end holdings. Calendar year 2019 ending bitcoins and shares were 261,192 bitcoins and 269,445,300 shares. From the 2019 Form 10-K: 'The Trust’s only ordinary recurring expense is the Sponsor’s Fee. The Sponsor’s Fee accrues daily in U.S. dollars at an annual rate of 2.0% of the Bitcoin Holdings.. The Sponsor’s Fee is payable in Bitcoins to the Sponsor monthly in arrears.'
No attempt is made to account for leap years.
Per share bitcoin estimate is converted to USD market value by multiplying by the simple average BTCUSD price at Coinbase and Bitstamp. Grayscale uses the TradeBlock XBX index, a volume weighted average of Coinbase Pro, Kraken, LMAX Digital and Bitstamp prices.
Spot checks vs archive.org captures of daily bitcoins per share and the chart on Grayscale's site:
The estimate for market close January 22 2021 is 0.00094899 bitcoins per share, the published datum on Grayscale's web site was 0.00094898. The estimate matches at 20:30 rather than at 16:00.
The estimate for December 31 2018 is 0.000988965 vs a published 0.00098895.
The estimate for December 29 2017 market value is $14.58 vs $14.65.
The estimate for December 30 2016 market value is $0.99 vs $0.98.
The estimate for January 4 2016 market value is $0.46 vs $0.45.
No estimates before 2016.
The default style is to draw a blue line with two thirds transparency outside market hours and for first/last minutes of trading, switching to daily or greater periodicity hides this.
No warranty is expressed or implied , I am not a lawyer, etc etc etc.
This is not investing advice . Always do your own due diligence .

Barcolor Five Over Five 2021-1-12This setting is pretty simple and straightforward. It is meant to color the price bars based on whether the trend is up, down, or sideways. This setting can be used in any market and becomes devastating when used on multiple time frames.

Real Trading Hours - Vertical Lines - Mark RTH for Futures 12/Jan/2021 09:15 AM AUTHOR: Brandon Gum
--
Updated script to plot vertical lines for open and close of futures.
Not sure why the 8:30 and 15:00 times had to be used over 9:30 or 16:00
Only plots for products of type futures. - Could be easily expanded to work with cryptos as well if you wanted.
======================
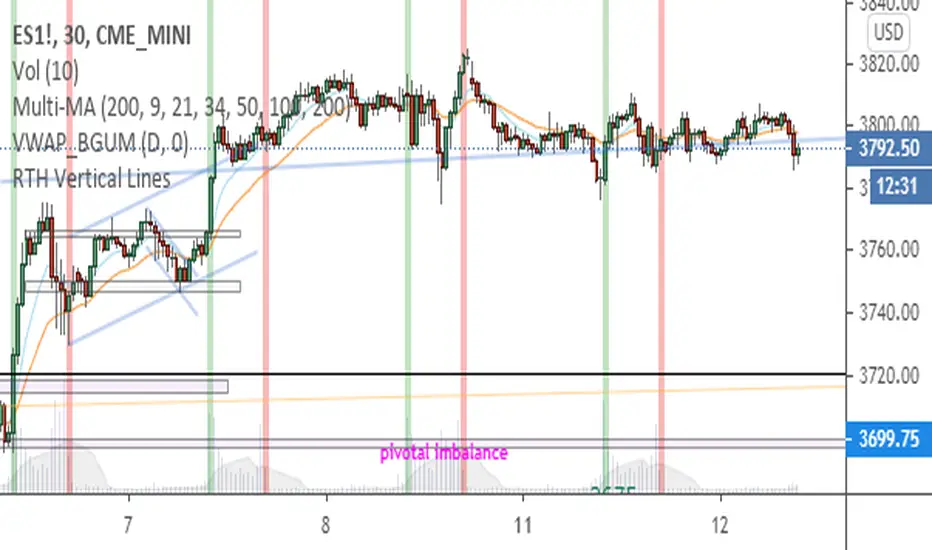
Consolidation Ranges [kingthies] Consolidation Range Analysis
Published by Eric Thies, January 2021
█ Indicator Summary
This tool calculates, analyzes and plots the visualization of a relative range over a given period of time
By adding to charts, users are enabled to see the impulsive nature of market cycles, along with their efforts to consolidate thereafter
The default period is 30, and should be adjusted to users preference
The default input is the current close price, on the chosen timeframe of the chart
█ Script Source
//
//@version=4
//© kingthies || This source code is subject to the terms of the Mozilla Public License 2.0 at mozilla.org
study("Consolidation Ranges ", shorttitle="CR ", overlay=true)
// !<------ User Inputs ----->
src = input(close, title='Range Input (Default set to Close'), lengthEMA=input(30,title='Length'),zoneToggle = input(true, title="Toggle Zone Highlights"), iCol = color.new(#FFFFFF, 100),
// !<---- Declarations & Calculations ---- >
trndUp = float(na),trndDwn = float(na), mid = float(na), e = ema(src, lengthEMA)
trndUp := src < nz(trndUp ) and src > trndDwn ? nz(trndUp ) : high, trndDwn := src < nz(trndUp ) and src > trndDwn ? nz(trndDwn ) : low, mid := avg(trndUp, trndDwn)
// !< ---- Plotting ----->
highRange = plot(trndUp == nz(trndUp ) ? trndUp : na, color=color.white, linewidth=2, style=plot.style_linebr, title="Top of Period Range")
lowRange = plot(trndDwn == nz(trndDwn ) ? trndDwn : na, color=color.white, linewidth=2, style=plot.style_linebr, title="Bottom of Period Range")
xzone = plot(zoneToggle ? src > e ? trndDwn : trndUp : na, color=iCol, style=plot.style_circles, linewidth=0, editable=false)
fill(highRange, xzone, color=color.lime,transp=70), fill(xzone, lowRange, color=color.red,transp=70)
//

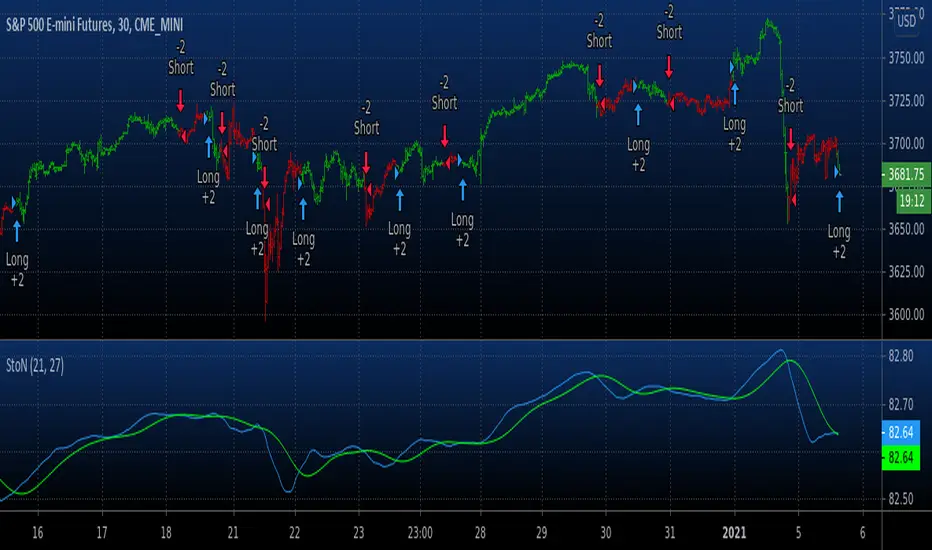
Backtest Signal To Noise This source code is subject to the terms of the Mozilla Public License 2.0 at mozilla.org
© HPotter 05/01/2021
The signal-to-noise (S/N) ratio.
And Simple Moving Average.
Thank you for idea BlockchainYahoo
WARNING:
- For purpose educate only
- This script to change bars colors.
Signal To Noise This source code is subject to the terms of the Mozilla Public License 2.0 at mozilla.org
© HPotter 05/01/2021
The signal-to-noise (S/N) ratio.
Thank you for idea BlockchainYahoo

Divergence TemplateDivergence Template!
This public indicator helps you to find as many divergences with as many indicators you like, without the long hassle of knowing and coding the divergence yourself.
Just replace the "Divergence Condition" with your formula and give it a title in the second step, everything simply illustrated to someone without any coding experience!
This example is calculating A/D Divergences.
Let's make 2021 great!
With help of @madoqa.

BTC Fibonacci DMA350 TrendlinesAdapted from Tim Graham's Code.
See Original Inspiring Article from Phillip Swift at: @positivecrypto
When looking into BITSTAMP:BTCUSD 1D data in spreadsheet. Historically, BTC Highs Hit (Simple Daily Moving Average 350 Days) DMA350 in reverse Fibonacci Sequence Order
2013 Hit DMA350*8 before All Time High (ATH)
2017 Hit DMA350*5 before ATH
I expect 2021 to hit DMA350*3 ATH. When BTC hits DMA350*3 ATH, I suggest selling!
