ADX Scanner with IndicatorsA screener that will allow you to enter up to 10 stocks. The goal is to see clearly in front of you what stocks are moving and the momentum leveraging the ADX and RSI. The return for the day shows the growth or loss of those moves.
"国泰黄金ETF联接C相关行业指数的最新政策" için komut dosyalarını ara
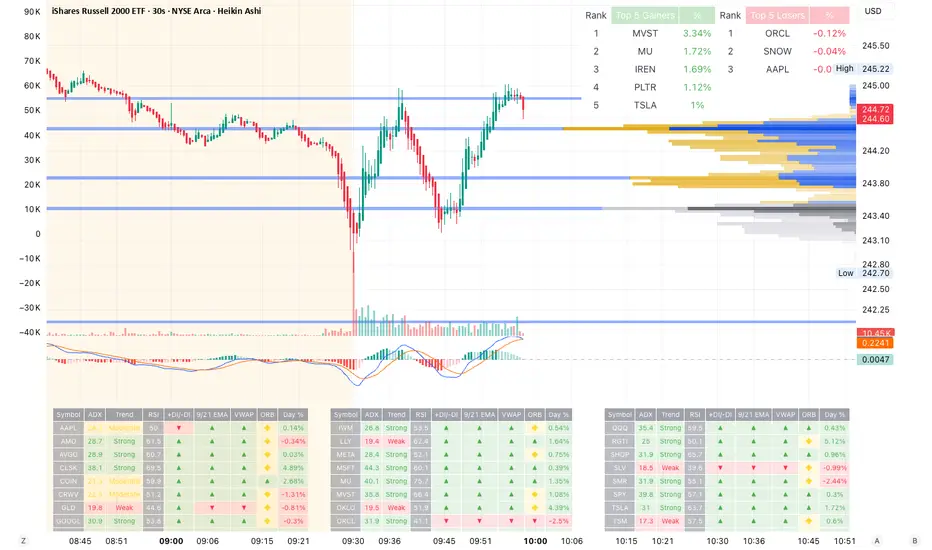
ADX Scanner with IndicatorsA screener that will allow you to enter up to 10 stocks. The goal is to see clearly in front of you what stocks are moving and the momentum leveraging the ADX and RSI. The return for the day shows the growth or loss of those moves.
🚀 Ultimate Trading Tool + Strat Method🚀 Ultimate Trading Tool + Strat Method - Complete Breakdown
Let me give you a comprehensive overview of this powerful indicator!
🎯 What This Indicator Does:
This is a professional-grade, all-in-one trading system that combines two proven methodologies:
1️⃣ Technical Analysis System (Original)
Advanced trend detection using multiple EMAs
Momentum analysis with MACD
RSI multi-timeframe analysis
Volume surge detection
Automated trendline drawing
2️⃣ Strat Method (Pattern Recognition)
Inside bars, outside bars, directional bars
Classic patterns: 2-2, 1-2-2
Advanced patterns: 3-1-2, 2-1-2, F2→3
Timeframe continuity filters
📊 How It Generates Signals:
Technical Analysis Signals (Green/Red Triangles):
Buy Signal Triggers When:
✅ Price above EMA 21 & 50 (uptrend)
✅ MACD histogram rising (momentum)
✅ RSI between 30-70 (not overbought/oversold)
✅ Volume surge above 20-period average
✅ Price breaks above resistance trendline
Scoring System:
Trend alignment: +1 point
Momentum: +1 point
RSI favorable: +1 point
Trendline breakout: +2 points
Minimum score required based on sensitivity setting
Strat Method Signals (Blue/Orange Labels):
Pattern Recognition:
2-2 Setup: Down bar → Up bar (or reverse)
1-2-2 Setup: Inside bar → Down bar → Up bar
3-1-2 Setup: Outside bar → Inside bar → Up bar
2-1-2 Setup: Down bar → Inside bar → Up bar
F2→3 Setup: Failed directional bar becomes outside bar
Confirmation Required:
Must break previous bar's high (buy) or low (sell)
Optional timeframe continuity (daily & weekly aligned)
💰 Risk Management Features:
Dynamic Stop Loss & Take Profit:
ATR-Based: Adapts to market volatility
Stop Loss: Entry - (ATR × 1.5) by default
Take Profit: Entry + (ATR × 3.0) by default
Risk:Reward: Customizable 1:2 to 1:5 ratios
Visual Risk Zones:
Colored boxes show risk/reward area
Dark, bold lines for easy identification
Clear entry, stop, and target levels
🎨 What You See On Screen:
Main Signals:
🟢 Green Triangle "BUY" - Technical analysis long signal
🔴 Red Triangle "SELL" - Technical analysis short signal
🎯 Blue Label "STRAT" - Strat method long signal
🎯 Orange Label "STRAT" - Strat method short signal
Trendlines:
Green lines - Support trendlines (bullish)
Red lines - Resistance trendlines (bearish)
Automatically drawn from pivot points
Extended forward to predict future levels
Stop/Target Levels:
Bold crosses at stop loss levels (red color)
Bold crosses at take profit levels (green color)
Line width = 3 for maximum visibility
Trade Zones:
Light green boxes - Long trade risk/reward zone
Light red boxes - Short trade risk/reward zone
Shows potential profit vs risk visually
📊 Information Dashboard (Top Right):
Shows real-time market conditions:
Main Signal: Current technical signal status
Strat Method: Active Strat pattern
Trend: Bullish/Bearish/Neutral
Momentum: Strong/Weak based on MACD
Volume: High/Normal compared to average
TF Continuity: Daily/Weekly alignment
RSI: Current RSI value with color coding
Support/Resistance: Current trendline levels
🔔 Alert System:
Entry Alerts:
Technical Signals:
🚀 BUY SIGNAL TRIGGERED!
Type: Technical Analysis
Entry: 45.23
Stop: 43.87
Target: 48.95
```
**Strat Signals:**
```
🎯 STRAT BUY TRIGGER!
Pattern: 3-1-2
Entry: 45.23
Trigger Level: 44.56
Exit Alerts:
Target hit notifications
Stop loss hit warnings
Helps maintain discipline
⚙️ Customization Options:
Signal Settings:
Sensitivity: High/Medium/Low (controls how many signals)
Volume Filter: Require volume surge or not
Momentum Filter: Require momentum confirmation
Strat Settings:
TF Continuity: Require daily/weekly alignment
Pattern Selection: Enable/disable specific patterns
Confirmation Mode: Show only confirmed triggers
Risk Settings:
ATR Multiplier: Adjust stop/target distance
Risk:Reward: Set preferred ratio
Visual Elements: Show/hide any component
Visual Settings:
Colors: Customize all signal colors
Display Options: Toggle signals, levels, zones
Trendline Length: Adjust pivot detection period
🎯 Best Use Cases:
Day Trading:
Use low sensitivity setting
Enable all Strat patterns
Watch for high volume signals
Quick in/out trades
Swing Trading:
Use medium sensitivity
Require timeframe continuity
Focus on trendline breakouts
Hold for target levels
Position Trading:
Use high sensitivity (fewer signals)
Require strong momentum
Focus on weekly/daily alignment
Larger ATR multipliers
💡 Trading Strategy Tips:
High-Probability Setups:
Double Confirmation: Technical + Strat signal together
Trend Alignment: All timeframes agree
Volume Surge: Institutional participation
Trendline Break: Clear level breakout
Risk Management:
Always use stops - System provides them
Position sizing - Risk 1-2% per trade
Don't chase - Wait for signal confirmation
Take profits - System provides targets
What Makes Signals Strong:
✅ Both technical AND Strat signals fire together
✅ Timeframe continuity (daily & weekly aligned)
✅ Volume surge confirms institutional interest
✅ Multiple indicators align (trend + momentum + RSI)
✅ Clean trendline breakout with no resistance above (or support below)
⚠️ Common Mistakes to Avoid:
Don't ignore stops - System calculates them for a reason
Don't overtrade - Wait for quality setups
Don't disable volume filter - Unless you know what you're doing
Don't use max sensitivity - You'll get too many signals
Don't ignore timeframe continuity - It filters bad trades
🚀 Why This Indicator is Powerful:
Combines Multiple Edge Sources:
Technical analysis (trend, momentum, volume)
Pattern recognition (Strat method)
Risk management (dynamic stops/targets)
Market structure (trendlines, support/resistance)
Professional Features:
No repainting - signals are final when bar closes
Clear risk/reward before entry
Multiple confirmation layers
Adaptable to any market or timeframe
Beginner Friendly:
Clear visual signals
Automatic calculations
Built-in risk management
Comprehensive dashboard
This indicator essentially gives you everything a professional trader uses - trend analysis, momentum, patterns, volume, risk management - all in one clean package!
Any specific aspect you'd like me to explain in more detail? 🎯RetryClaude can make mistakes. Please double-check responses. Sonnet 4.5

ES cuhthis strategy uses laggard rsi to compute the best parameters to go long and tp at key levels. the overall trend strength within the rsi laggard indicator is what is used to automate the calculations within the script. enjoy and paramter optimize

Daily Levels: PD / PM / OR (RTH/Pre)# Daily Levels: PD / PM / OR (RTH/Pre)
## Overview
This indicator displays key intraday support and resistance levels for US equity markets, specifically designed for traders who use Previous Day, Pre-Market, and Opening Range levels in their trading strategy.
## Key Features
**Seven Critical Levels Displayed:**
- **PDH (Previous Day High)** - Blue line: The highest price from yesterday's regular trading hours (9:30 AM - 4:00 PM ET)
- **PDL (Previous Day Low)** - Blue line: The lowest price from yesterday's regular trading hours
- **PDC (Previous Day Close)** - Orange line: The closing price from yesterday's regular trading hours
- **PMH (Pre-Market High)** - Yellow line: The highest price during today's pre-market session (4:00 AM - 9:30 AM ET)
- **PML (Pre-Market Low)** - Yellow line: The lowest price during today's pre-market session
- **ORH (Opening Range High)** - Red line: The highest price during the first 30 minutes of trading (9:30 AM - 10:00 AM ET)
- **ORL (Opening Range Low)** - Red line: The lowest price during the first 30 minutes of trading
## How It Works
**At 9:30 AM ET (Market Open):**
- PDH, PDL, PDC levels appear (from previous day's RTH)
- PMH, PML levels appear (from today's pre-market session)
- All lines begin at the 9:30 AM bar and extend right
**At 10:00 AM ET (Opening Range Close):**
- ORH, ORL levels appear (from today's first 30 minutes)
- Lines begin at the 9:30 AM bar and extend right
**Level Persistence:**
- All levels remain visible until the next trading day at 9:30 AM ET
- Levels reset daily for the new trading session
## Use Cases
**Day Trading:**
- Identify key support and resistance zones before placing trades
- Use PDH/PDL as potential profit targets or stop loss areas
- Monitor price reaction at pre-market levels for early trading signals
- Trade breakouts or rejections at opening range levels
**Swing Trading:**
- Assess daily momentum by observing breaks above/below previous day levels
- Use multiple timeframes while maintaining consistent reference points
**Market Structure:**
- Quickly identify if the market is trading above or below key levels
- Recognize accumulation/distribution patterns around these zones
## Technical Details
- **Timezone:** All times referenced are US Eastern Time (America/New_York)
- **Session Windows:**
- Pre-Market: 4:00 AM - 9:30 AM ET
- Regular Trading Hours: 9:30 AM - 4:00 PM ET
- Opening Range: 9:30 AM - 10:00 AM ET
- **Timeframe Agnostic:** Works on any chart timeframe
- **Visual Clarity:** Color-coded lines and labels for easy identification
## Color Scheme
- **Blue:** Previous Day levels (PDH, PDL)
- **Orange:** Previous Day Close (PDC)
- **Yellow:** Pre-Market levels (PMH, PML)
- **Red:** Opening Range levels (ORH, ORL)
## Best Practices
1. Use on US equity indices (SPY, QQQ, ES, NQ) and liquid US stocks
2. Combine with volume analysis for confirmation
3. Pay attention to how price reacts at these levels (bounce vs. break)
4. Most effective during the first 2 hours of trading when volatility is highest
5. Consider the market context (trending vs. ranging) when interpreting these levels
## Note
This indicator is specifically designed for US market hours. Results may vary when applied to international markets or instruments with different trading sessions.

⚡ Elite Momentum Pro🎯 Key Features
1. Smart Signal Engine
3 Signal Modes: Aggressive, Balanced, Conservative
7-Point Scoring System - Ensures high-quality signals
Anti-Flip Protection - Prevents rapid signal changes
Multiple confirmations: Supertrend, MACD, RSI, EMA alignment, momentum
2. Advanced Risk Management
3 Take Profit Levels (TP1, TP2, TP3) for scaling out
ATR-Based Dynamic Stops - Adapts to volatility
Customizable Risk:Reward (default 2.5:1)
Visual stop and target levels
3. Clean Visual Design
Color-coded price bars based on trend strength
EMA Ribbon (9, 21, 50, 200) for trend clarity

Price Change x% from Prior CloseThis indicator identifies candles where price moved a specified percentage below the prior candle's Close price.
The script plots a gray bar at the threshold price for each candle and a green up-arrow for candles where the price crosses below the threshold price.
The Threshold Price Percentage can be set in the indicator settings window.

Herd Flow Oscillator — Volume Distribution Herd Flow Oscillator — Scientific Volume Distribution (herd-accurate rev)
A composite order-flow oscillator designed to surface true herding behavior — not just random bursts of buying or selling.
It’s built to detect when market participants start acting together, showing persistent, one-sided activity that statistically breaks away from normal market randomness.
Unlike traditional volume or momentum indicators, this tool doesn’t just look for “who’s buying” or “who’s selling.”
It tries to quantify crowd behavior by blending multiple statistical tests that describe how collective sentiment and coordination unfold in price and volume dynamics.
What it shows
The Herd Flow Oscillator works as a multi-layer detector of crowd-driven flow in the market. It examines how signed volume (buy vs. sell pressure) evolves, how persistent it is, and whether those actions are unusually coordinated compared to random expectations.
HerdFlow Composite (z) — the main signal line, showing how statistically extreme the current herding pressure is.
When this crosses above or below your set thresholds, it suggests a high probability of collective buying or selling.
You can optionally reveal component panels for deeper insight into why herding is detected:
DVI (Directional Volume Imbalance): Measures the ratio of bullish vs. bearish volume.
If it’s strongly positive, more volume is hitting the ask (buying); if negative, more is hitting the bid (selling).
LSV-style Herd Index : Inspired by academic finance measures of “herding.”
It compares how often volume is buying vs. selling versus what would happen by random chance.
If the result is significantly above chance, it means traders are collectively biased in one direction.
O rder-Flow Persistence (ρ 1..K): Averages autocorrelation of signed volume over several lags.
In simpler terms: checks if buying/selling pressure tends to continue in the same direction across bars.
Positive persistence = ongoing coordination, not just isolated trades.
Runs-Test Herding (−Z) : Statistical test that checks how often trade direction flips.
When there are fewer direction changes than expected, it means trades are clustering — a hallmark of herd behavior.
Skew (signed volume): Measures whether signed volume is heavily tilted to one side.
A positive skew means more aggressive buying bursts; a negative skew means more intense selling bursts.
CVD Slope (z): Looks at the slope of the Cumulative Volume Delta — essentially how quickly buy/sell pressure is accelerating.
It’s a short-term flow acceleration measure.
Shapes & background
▲ “BH” at the bottom = Bull Herding; ▼ “BH-” at the top = Bear Herding.
These markers appear when all conditions align to confirm a herding regime.
Persistence and clustering both confirm coordinated downside flow.
Core Windows
Primary Window (N) — the main sample length for herding calculations.
It’s like the "memory span" for detecting coordinated behavior. A longer N means smoother, more reliable signals.
Short Window (Nshort) — used for short-term measurements like imbalance and slope.
Smaller values react faster but can be noisy; larger values are steadier but slower.
Long Window (Nlong) — used for z-score normalization (statistical scaling).
This helps the indicator understand what’s “normal” behavior over a longer horizon, so it can spot when things deviate too far.
Autocorr lags (acLags) — how many steps to check when measuring persistence.
Higher values (e.g., 3–5) look further back to see if trends are truly continuing.
Calculation Options
Price Proxy for Tick Rule — defines how to decide if a trade is “buy” or “sell.”
hlc3 (average of high, low, and close) works as a neutral, smooth price proxy.
Use ATR for scaling — keeps signals comparable across assets and timeframes by dividing by volatility (ATR).
Prevents high-volatility periods from dominating the signal.
Median Filter (bars) — smooths out erratic data spikes without heavily lagging the response.
Odd values like 3 or 5 work best.
Signal Thresholds
Composite z-threshold — determines how extreme behavior must be before it counts as “herding.”
Higher values = fewer, more confident signals.
Imbalance threshold — the minimum directional volume imbalance to trigger interest.
Plotting
Show component panels — useful for analysts and developers who want to inspect the math behind signals.
Fill strong herding zones — purely visual aid to highlight key periods of coordinated trading.
How to use it (practical tips)
Understand the purpose: This is not just a “buy/sell” tool.
It’s a behavioral detector that identifies when traders or algorithms start acting in the same direction.
Timeframe flexibility:
15m–1h: reveals short-term crowd shifts.
4h–1D: better for swing-trade context and institutional positioning.
Combine with structure or trend:
When HerdFlow confirms a bullish regime during a breakout or retest, it adds confidence.
Conversely, a bearish cluster at resistance may hint at a crowd-driven rejection.
Threshold tuning:
To make it more selective, increase zThr and imbThr.
To make it more sensitive, lower those thresholds but expand your primary window N for smoother results.
Cross-market consistency:
Keep “Use ATR for scaling” enabled to maintain consistency across different instruments or timeframes.
Denoising:
A small median filter (3–5 bars) removes flicker from volume spikes but still preserves the essential crowd patterns.
Reading the components (why signals fire)
Each sub-metric describes a unique “dimension” of crowd behavior:
DVI: how imbalanced buying vs selling is.
Herd Index: how biased that imbalance is compared to random expectation.
Persistence (ρ): how continuous those flows are.
Runs-Test: how clumped together trades are — clustering means the crowd’s acting in sync.
Skew: how lopsided the volume distribution is — sudden surges of one-sided aggression.
CVD Slope: how strongly accelerating the current directional flow is.
When all of these line up, you’re seeing evidence that market participants are collectively moving in the same direction — i.e., true herding.
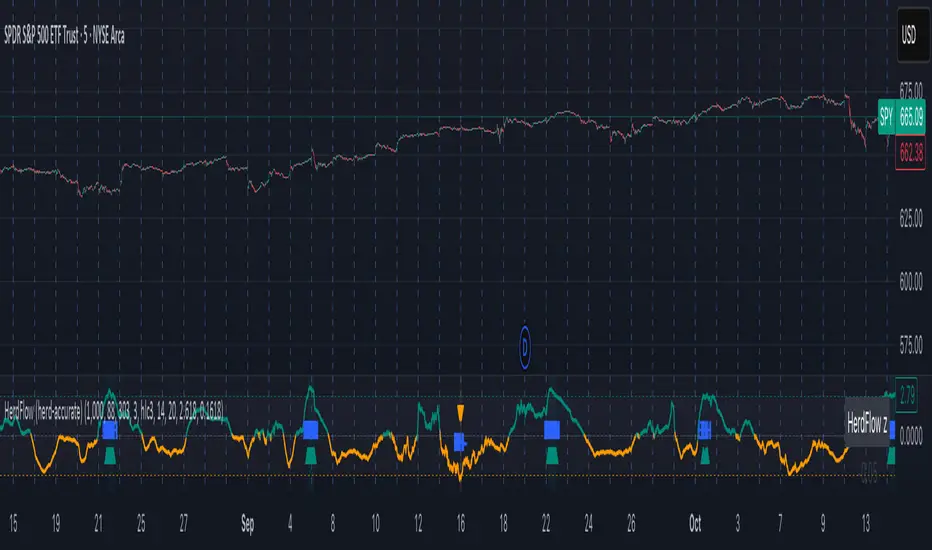
Image Plotter [theUltimator5]Image Plotter is a visual alerting tool that drops fun, high-contrast ASCII (braille) art (e.g., Rocket, Cat “hang in there”, Babe Ruth, etc.) directly on your price chart when a technical trigger fires. It’s designed for quick, glanceable callouts without cluttering your chart with lines or sub-indicators.
If there are any specific images you would like to be able to add to your plot, please comment with the image you want to see and if it is reasonable, I will add it.
How it works
On each bar close, the script evaluates your selected Trigger Source. When the condition is true, it places a label that contains the selected ASCII art at a configurable offset above or below the candle.
You can choose to only keep the most recent art on the chart, or accumulate every trigger as a historical breadcrumb trail.
Positioning uses either the bar’s high (for above-candle placements) or low (for below-candle placements), then applies your vertical % offset and horizontal bar shift.
Inputs & Controls
Trigger Source
Select which condition will fire the ASCII placement:
RSI Oversold / Overbought — Triggers on cross through the threshold (under/over).
MACD Bullish Cross / Bearish Cross — MACD line crossing the Signal line.
BB Lower Touch / BB Upper Touch — Price crossing below the lower band / above the upper band.
Stochastic Oversold / Overbought — %K crossing through your thresholds.
Volume Spike — Current volume > (Volume MA × Spike Multiplier).
Price Cross MA — Close crossing above the chosen moving average (bullish only).
Custom Condition — Optional user condition (see “Custom Condition” below).
Plot Mode
Latest Only — The indicator deletes the previous label and keeps only the newest trigger on chart.
Every Trigger — Leaves all triggered labels on the chart (historical markers).
Note: TradingView caps the number of labels per script; this indicator sets max_labels_count=500. Heavy triggering can still hit limits.
Practical usage tips
Choose “Latest Only” for cleanliness if your trigger is frequent. Use “Every Trigger” when you want a visual audit trail.
Tune vertical offset by symbol — low-priced tickers may need a smaller %; volatile names may need more spacing.
Quick start
Add the indicator to any chart (any timeframe).
Pick a Trigger Source (e.g., RSI Oversold) and set thresholds/lengths.
Choose ASCII Image, Position Above/Below, Offsets, and Plot Mode.
(Optional) Enable Custom Condition and select your Custom Plot Source.
Create an Alert on “ASCII Trigger Alert” using Once Per Bar Close.
Have a variant you’d like (e.g., bearish MA cross, multi-alert pack by trigger, or time-window filters)? Tell me what workflow you want and I’ll tailor the script/description to match.

REMS Synergy OverlayThis 3rd generation REMS indicator builds upon the foundations assessing the relationships between RSI, EMAs, MACDs, and Stochastic RSI across multiple timeframes. Designed to help traders identify less frequent, but high probability entries across 2 time frames. Uses 3 levels of confluence indicators for both long and short moves.
Confluence Level 1 (Highest Conviction):
Evaluates selected criteria across both timeframes. All selected criteria must be in confluence to trigger signal.
Confluence Level 2 (Moderate Conviction):
Selected criteria can be selected by each timeframe individually. All selected criteria must be in confluence to trigger signal.
Confluence Level 3 (Lower/supportive confluence):
Of the selected criteria, this level can evaluate a set number of conditions that must be met. Number of conditions is user-defined.
Includes VWAP and 4 EMAs as optional visual representations.
Includes 'Enhanced Candles' than can colour code candlesticks for better visual identification. (off by default)
Originally designed with 5 minute and 2 minute timeframes in mind, and pairs well with REMS First Strike and/or REMS Snap Shot indicators.
Values coded below:
RSI
-Primary: Length = 14, Smoothing = 20 (via SMA)
-Secondary: Length = 7, Smoothing = 20 (via SMA)
Stochastic RSI
Primary:
-RSI Length = 14
-Stochastic Length = 8
-%K = 3, %D = 3
Secondary:
-RSI Length = 7
-Stochastic Length = 7
-%K = 3, %D = 2
MACD - applied to both timeframes
-Fast = 12, Slow = 26, Signal = 9

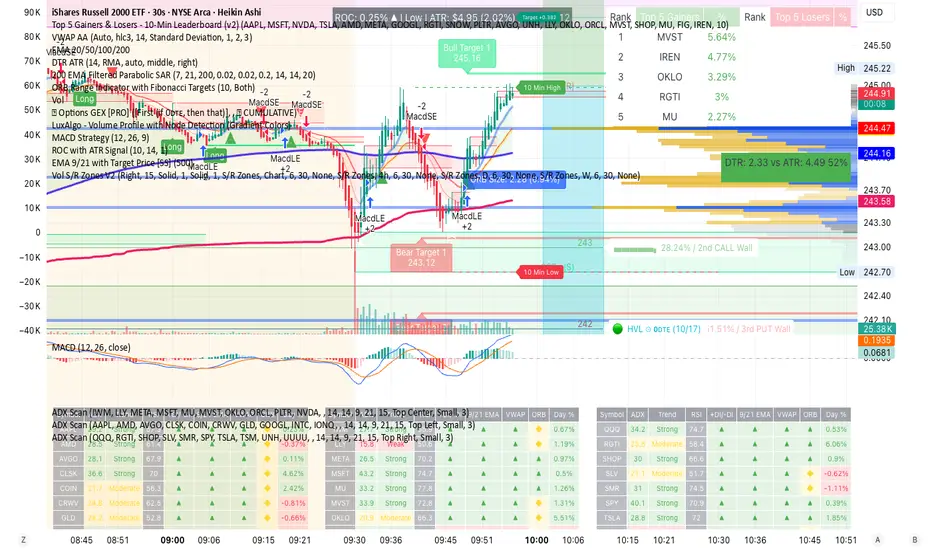
Dobrusky Volume PulseWhat it does & who it’s for
Volume Pulse is a lightweight, customizable volume profile overlay that shows traders how volume is distributed across price levels over a chosen lookback window. Unlike standard profiles, it also maps cumulative buy/sell pressure at each level, so you see not just where volume clustered, but which side dominated.
Core ideas
Cumulative volume by price: Builds a horizontal profile of traded volume at each level, based on user-defined depth and resolution.
Directional pressure mapping: At every price level, the script accumulates bullish vs. bearish volume based on candle closes vs. opens, providing a directional read on whether buyers or sellers had the upper hand.
POC: Automatically highlights the Point of Control (POC) — the level with the most activity.
Customizable presentation: Adjustable profile resolution, bar width, offset, colors, and whether to show cumulative, directional, or both.
How the components work together
The profile provides the “where,” while the buy/sell mapping adds the “who.” By combining these, traders can see whether a high-volume node was buyer-driven absorption or seller-driven distribution — a distinction classic profiles don’t reveal. This directional overlay reduces the guesswork of interpreting raw volume clusters.
How to use
Apply the overlay to your chart.
Watch the POC and areas of significant increase or decrease in volume (and pressure) as natural magnets or rejection areas.
When trading intraday, I've found that higher timeframe volume levels act as strong magnets. In the chart, you can see the volume levels I've drawn on the SPY daily chart. These levels are targets I use when trading the 5-minute chart.
Pay attention to color dominance at those zones — green-heavy nodes suggest buyer control; red-heavy nodes suggest seller control.
Combine with time-based volume tools and price-action for a more comprehensive trade plan.
Settings overview
Lookback depth: Number of bars used for profile calculation.
Profile resolution: Number of horizontal bars to split volume across price.
Bar style: Width, offset, and multiplier for scaling.
Toggle layers: Choose cumulative, directional, or both.
POC display: Optional highlight of the most traded level.
Limitations & best practices
This is a contextual overlay, not a trade-signal system.
Works best on liquid instruments (indices, futures, major stocks, liquid crypto) where volume distribution is meaningful.
Directional mapping uses candle body bias (close vs. open), not raw order flow. For full tape analysis, pair with actual order flow data.
Originality justification
Dual profile: combines cumulative volume-by-price and buyer/seller pressure per bin (close vs. open) — not a standard VP clone.
From-scratch binning + POC in a single pass for speed; no reused libraries.
Flexible display (cumulative / directional / both) with independent resolution, width, and offset for intraday or HTF use.
Clear visuals (optional POC, balanced node coloring) and open-source code so traders can audit and extend.

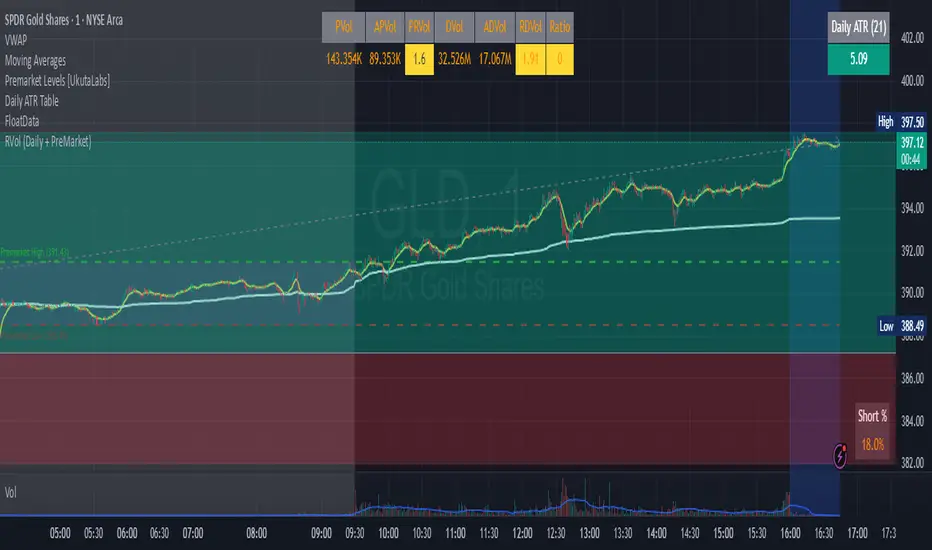
RVol (Daily and PreMarket)RVol with distinction between Pre-Market and Active Trading
Also ration of pre-market to Ave Daily Vol
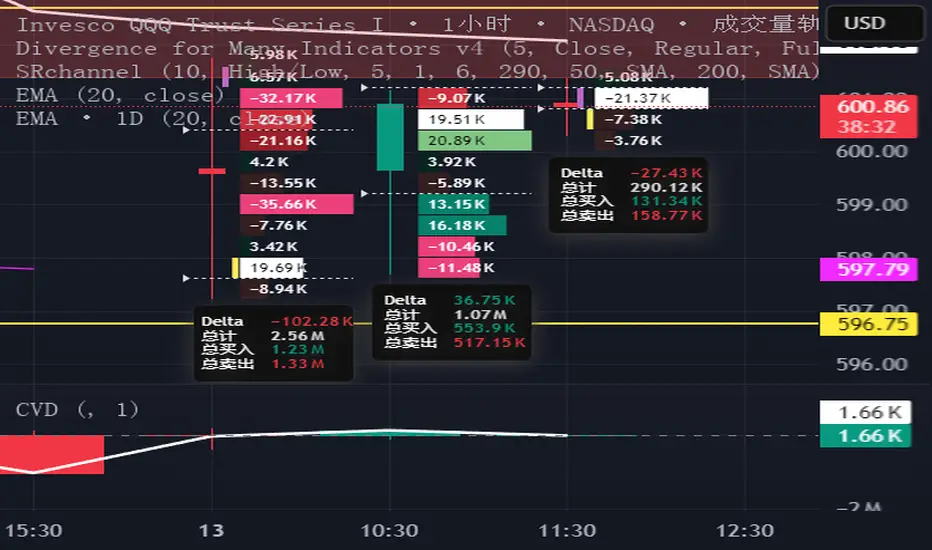
CVD with Trend LineThis indicator augments the traditional Cumulative Volume Delta (CVD) by incorporating a customizable trend line that connects the tops of the CVD histogram bars, enhancing visualization of delta trends and market momentum. The CVD measures the net difference between buying and selling volume, utilizing lower timeframe data for accuracy, with configurable anchor periods and timeframe options. The trend line, which can be tailored in both color and style (e.g., solid, dashed), provides traders with a flexible tool to track cumulative delta movements, aiding in the identification of market sentiment shifts. Perfect for volume-based analysis with a clear, adaptable display.
Premarket Gapper Swing Filter (Long) – v6here’s a plug-and-play Pine Script v5 “screener” you can drop on any chart to flag pre-market gainers that also meet swing-friendly trend/liquidity filters. It works as a chart-level scanner (since Pine can’t screen the whole market by itself): add it to a watchlist; symbols that qualify will light up and you can set alerts to ping you right at the opening bell.

SPY200SMA (+4%/-3%) TQQQ/QQQ STRATEGYSummary of the Improved Strategy: When the price of AMEX:SPY is +4% above the 200SMA BUY NASDAQ:TQQQ and when the price of SPY drops to -3% under the SPY 200SMA SELL everything and slowly DCA into NASDAQ:QQQ over the next 6-12 months or until price returns to +4% above the SPY 200SMA at which point you will go back into 100% TQQQ.
Note: (if the price of QQQ goes 30% above the 200SMA of QQQ deleverage to QQQ or Sell to protect yourself from dot com level event)
More info and stats -https://www.reddit.com/r/LETFs/comments/1nhye66/spy_200sma_43_tqqqqqq_long_term_investment/

KP_EMA_Cross_signal KP_EMA_Cross_signal : This signal removes a lot of false signals and will help in day trading.

Tamu2.0Testing Oct 2025. Indicator tries to identify short periods of volatility and market manipulation.

Extreme Candle Pattern Visualizer🟠 OVERVIEW
This indicator compares the current candle's percentage change against historical data, then highlights past candles with equal or bigger magnitude of movement. Also, for all the highlighted past candles, it tracks how far price extends before recovering to its starting point. It also provides statistical context through percentile rankings.
IN SHORT: Quickly spot similar price movements in the past and understand how unusual the current candle is using percentile rankings.
🟠 CORE CONCEPT
The indicator operates on two fundamental principles:
1. Statistical Rarity Detection
The script calculates the percentage change (open to close) of every candle within a user-defined lookback period and determines where the current candle ranks in this distribution. A candle closing at -9% might fall in the bottom 5th percentile, indicating it's more extreme than 95% of recent candles. This percentile ranking helps traders identify statistically unusual moves that often precede reversals or extended trends.
2. Recovery Path Mapping
Once extreme candles are identified (those matching or exceeding the current candle's magnitude), the indicator tracks their subsequent price action. For bearish candles, it measures how far price dropped before recovering back to the candle's opening price. For bullish candles, it tracks how high price climbed before returning to the open. This reveals whether extreme moves typically extend further or reverse quickly.
🟠 PRACTICAL APPLICATIONS
Mean Reversion Trading:
Candles in extreme percentiles (below 10% or above 90%) often signal oversold/overbought conditions. The recovery lines show typical extension distances, helping traders set profit targets for counter-trend entries.
Momentum Continuation:
When extreme candles show small recovery percentages before price reverses back, it suggests strong directional momentum that may continue.
Stop Loss Placement:
Historical recovery data reveals typical extension ranges after extreme moves, informing more precise stop loss positioning beyond noise but before major reversals.
Pattern Recognition:
By visualizing how similar historical extremes resolved, traders gain context for current price action rather than trading in isolation.
🟠 VISUAL ELEMENTS
Orange Circles: Mark historical candles with similar or greater magnitude to current candle
Red Lines: Track downward extensions after bearish extreme candles
Green Lines: Track upward extensions after bullish extreme candles
Percentage Labels: Show exact extension distance from candle close to extreme point
Percentile Label: Color-coded box displaying current candle's statistical ranking
Hollow Candles: Background rendering for clean chart presentation
🟠 ORIGINALITY
This indicator uniquely combines statistical percentile analysis with forward-looking recovery tracking. While many indicators identify extreme moves, few show what happened next across multiple historical instances simultaneously. The dual approach provides both the "how rare is this?" question (percentile) and "what typically happens after?" answer (recovery paths) in a single visual framework.

3DMA % Declining Issues (Diodato 2019)Description:
This script is a faithful implementation of the "3-DMA % Declining Issues" indicator from Chris Diodato's 2019 CMT paper, "Making The Most Of Panic." It is a simple but highly effective short-term panic meter based on market breadth.
What It Is
This indicator first calculates the percentage of total traded issues on the NYSE that were decliners for that day. It then plots a 3-day simple moving average of that percentage. The result is a 0-100 scale indicator that provides a clear visual of the intensity of recent, widespread selling pressure.
How to Interpret
Unlike a typical "oversold" oscillator where low is a signal, with this indicator, a high value indicates panic.
Panic Spikes: A sharp spike upward suggests that a very large portion of the market is selling off simultaneously. The paper found that when this indicator exceeded 65%, 70%, or 75%, it often marked a point of extreme short-term panic that presented a buying opportunity.
Panic Threshold: The script includes a customizable "Panic Threshold" line (defaulting to 65) to help you instantly spot these events.
Settings
Data Sources: Allows toggling the use of "Unchanged" issues data.
Thresholds: You can set the "Panic Threshold" line to your preferred level (e.g., 65, 70, 75).

Short-Term Capitulation Oscillator (STCO, Diodato 2019)Description:
This script is a faithful implementation of the Short-Term Capitulation Oscillator (STCO) from Chris Diodato's 2019 CMT paper, "Making The Most Of Panic". It's a tactical breadth and volume oscillator designed to "fish for market bottoms" by identifying short-term investor capitulation.
What It Is
The STCO combines the 10-day moving averages of NYSE up-volume and advancing issues. It measures the ratio of advancing momentum (in both volume and number of issues) relative to the total traded momentum. The result is a raw, un-normalized oscillator that typically ranges from 0 to 200.
How to Interpret
The STCO is a tactical tool for identifying near-term oversold conditions and potential bounces.
Low Readings: Indicate that sellers have likely exhausted themselves in the short term, creating a potential entry point for a bounce. The paper found that readings below 90, 85, and 80 were often followed by strong market performance over the next 5-20 days.
Overbought/Oversold Lines: Use the customizable overbought/oversold lines to define your own capitulation zones and potential entry areas.
Settings
Data Sources: Allows toggling the use of "Unchanged" issues/volume data.
Thresholds: You can set the overbought and oversold levels based on the paper's research or your own testing.

Long-Term Capitulation Oscillator (LTCO, Diodato 2019)Description:
This script is a faithful implementation of the Long-Term Capitulation Oscillator (LTCO) from Chris Diodato's award-winning 2019 CMT paper, "Making The Most Of Panic". It is a strategic, market-wide breadth and volume oscillator designed to identify major, long-term market bottoms.
What It Is
The LTCO combines long-term moving averages (34, 55, 89, 144, and 233-day) of NYSE advancing/declining issues and up/down volume. It uses a unique "average of averages" method to create a responsive yet strategic long-term indicator. This script plots the raw, un-normalized value as described in the paper, which typically oscillates in the 700-1100 range.
How to Interpret
The LTCO is a strategic tool for identifying potentially significant market turning points.
Extremely Low Readings: Suggest that a long-term period of selling has reached a point of exhaustion, potentially marking a major bear market low or a generational buying opportunity. The paper backtested various thresholds, with values below 950, 925, and especially 875 showing historically strong forward returns over the next 6-24 months.
Overbought/Oversold Lines: The script includes customizable overbought/oversold lines to help you visually identify these critical zones.
Settings
Data Sources: Allows toggling the use of "Unchanged" issues/volume data for the calculation.
Thresholds: You can set the overbought and oversold levels to your preference, based on the paper's findings or your own research.

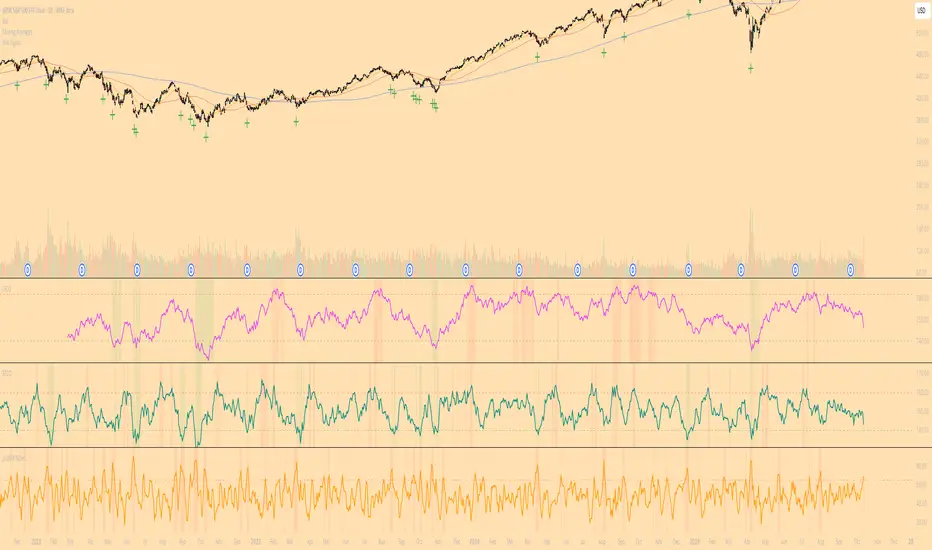
Diodato 'All Stars Align' SignalDescription:
This indicator is an overlay that plots the "All Stars Align" buy signal from Chris Diodato's 2019 CMT paper, "Making The Most Of Panic." It is designed to identify high-conviction, short-term buying opportunities by requiring a confluence of both price-based momentum and market-internal weakness.
What It Is
This script works entirely in the background, calculating three separate indicators: the 14-day Slow Stochastic, the Short-Term Capitulation Oscillator (STCO), and the 3-DMA of % Declining Issues. It then plots a signal directly on the main price chart only when the specific "All Stars Align" conditions are met.
How to Interpret
A green cross (+) appears below a price bar when a high-conviction buy signal is generated. This signal triggers only when two primary conditions are true:
The 14-day Slow Stochastic is in "oversold" territory (e.g., below 20).
AND at least one of the market internal indicators shows a state of panic:
Either the STCO is oversold (e.g., below 140).
Or the 3-DMA % Declines shows a panic spike (e.g., above 65).
This confluence signifies a potential exhaustion of sellers and can mark an opportune moment to look for entries.
Settings
Trigger Thresholds: You can customize the exact levels that define an "oversold" or "panic" state for each of the three underlying indicators.
Data Sources: Allows toggling the use of "Unchanged" data for the background calculations.
Stochastic Settings: You can adjust the parameters for the Slow Stochastic calculation.