Session Moving AveragesAdds EMAs and SMAs to chart using 8am-8pm EST values. Completely configurable in settings.
Some platforms allow users to configure what time frame they would like to view market data. One popular selection is 8am-8pm EST as 8am is when institutional orders go through. An argument can be made that price action before 8am EST is not valid yet moving averages will use that data.
This matters less for shorter moving averages such as a 9 or 20 ema, but it dramatically changes the 200 or the 50 sma for example.
This script allows you to ignore that pre-market data (or any data you choose to configure in the settings) and select up to 3 moving averages (either Exponential or Simple) for a set time.
By default the moving averages include the 9-ema (gray), 20-ema (green), and 200-sma (purple) and is set to 8am-8pm EST
This is configurable in the settings including the time frame you would like the moving averages to start using market data.
By default the script will use your charts timeframe. You are able to use multi-time frames with this script just scroll down to "timeframe", then click "chart" in settings... this will then allow you to select a timeframe.
A popular choice is 5-minute value of 8am-8pm EST moving averages. This means regardless of the time frame you are on (sub 1-minute, 1-minute, etc.) the script will display 5-minute data.
Final note: In settings you are able to turn on/off shapes (the gray lines at the bottom) which shows when the data is being used. This can be helpful on certain tickers that trade continuously such as /ES or /NQ.
"半导体设备ETF" için komut dosyalarını ara

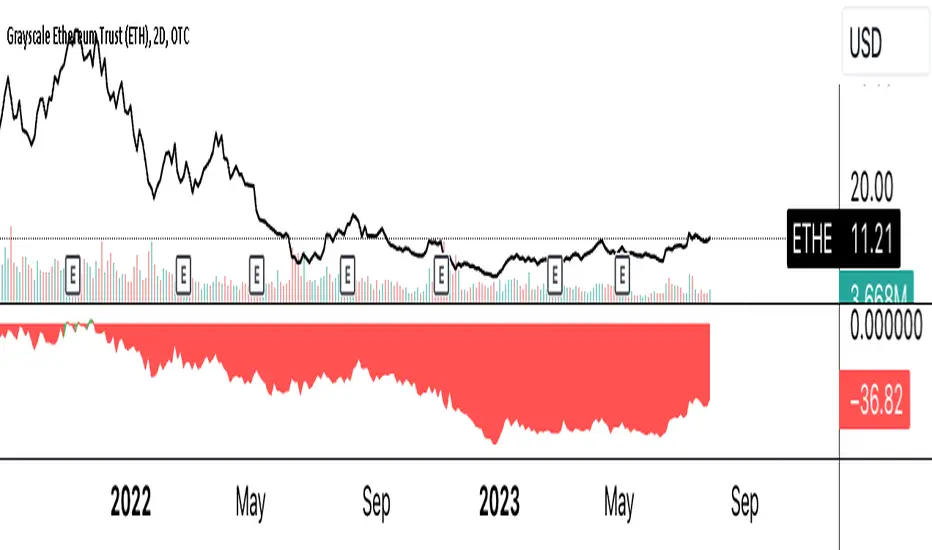
ETHE Discount/Premium to NAVThe provided script calculates the discount or premium of the Grayscale Ethereum Trust (ETHE) to its Net Asset Value (NAV), considering an annual fee of 2.5%. It does this by comparing the ETHE's price to the underlying Ethereum (ETH) value per share, adjusting for the effect of the annual fee.
Stock Open % ChangeWhile the percentage change in price from yesterday's close is important, wouldn't it be more interesting to see how much a stock price changes from the Market Open? Furthermore, you could track multiple indices to see which one has moment based on the percentage change in open, informing trading decisions.
This grid allows you to select 5 different ticker symbols, and display the change% from open, and from the close. Colors, rows, and grid placement may be customized as well.

All Candlestick Patterns Screener [By MUQWISHI]▋ INTRODUCTION :
The Candlestick Patterns Screener has been designed to offer an advanced monitoring solution for up to 40 symbols. Utilizing a log screener style, it efficiently gathers information on confirmed candlestick pattern occurrences and presents it in an organized table. This table includes essential details such as the symbol name, signal price, and the corresponding candlestick pattern name.
_______________________
▋ OVERVIEW:
_______________________
▋ CREDIT:
Credit to public technical “*All Candlestick Patterns*” indicator.
_______________________
▋ USAGE:
_______________________
▋ Final Comments:
For best performance, add the Candlestick Patterns Screener on active symbol chart like QQQ, SPY, AAPL, BTCUSDT, ES, EURUSD or …etc.
Candlestick patterns are not a major concept to build a trading decision.
Personally, I see candlestick patterns as a means to comprehend the psychology of the market, and help to follow the price action.
Please let me know if you have any questions.
Thank you.

CandlestickPatternsLibrary "CandlestickPatterns"
This library provides a wide range of candlestick patterns, and available for user to call each pattern individually. It's a comprehensive and common tool designed for traders seeking to raise their technical analysis, and it may help users identify key turning of price action in financial instruments. Credit to public technical “*All Candlestick Patterns*” indicator.
abandonedBaby(order, d1)
The "Abandoned Baby" candlestick pattern is a bullish/bearish pattern consists of three candles.
Parameters:
order (simple string) : (simple string) Pattern order type "bull" or "bear".
d1 (simple float) : (simple float) Previous candle's body percentage out of candle range. Optional argument, default is 5.
darkCloudCover(c1, n)
The "Dark Cloud Cover" is a bearish pattern consists of two candles.
Parameters:
c1 (simple bool) : (simple bool) Previous candle's body must be higher than average. Optional argument, default is true.
n (simple int) : (simple int) Length of average candle's body. Optional argument, default is 14.
doji(d0)
The "Doji" is neither bullish or bearish consists of one candles.
Parameters:
d0 (simple float) : (simple float) Current candle's body percentage out of candle range. Optional argument, default is 5.
dojiStar(order, c1, n, d0)
The "Doji Star" is a bullish/bearish pattern consists of two candles.
Parameters:
order (simple string) : (simple string) Pattern order type "bull" or "bear" .
c1 (simple bool) : (simple bool) Previous candle's body must be higher than average. Optional argument, default is true.
n (simple int) : (simple int) Length of average candle's body. Optional argument, default is 14.
d0 (simple float) : (simple float) Current candle's body percentage out of candle range. Optional argument, default is 5.
downsideTasukiGap(c2, c1, n)
The "Downside Tasuki Gap" is a bearish pattern consists of three candles.
Parameters:
c2 (simple bool) : (simple bool) Before previous candle's body must be higher than average. Optional argument, default is true.
c1 (simple bool) : (simple bool) Previous candle's body must be lower than average. Optional argument, default is true.
n (simple int) : (simple int) Length of average candle's body. Optional argument, default is 14.
dragonflyDoji(d0)
The "Dragon Fly Doji" is a bullish pattern consists of one candle.
Parameters:
d0 (simple float) : (simple float) Current candle's body percentage out of candle range. Optional argument, default is 5.
engulfing(order, c1, c0, n)
The "Engulfing" is a bullish/bearish pattern consists of two candles.
Parameters:
order (simple string) : (simple string) Pattern order type "bull" or "bear".
c1 (simple bool) : (simple bool) Previous candle's body must be lower than average. Optional argument, default is true.
c0 (simple bool) : (simple bool) Current candle's body must be higher than average. Optional argument, default is true.
n (simple int) : (simple int) Length of average candle's body. Optional argument, default is 14.
eveningDojiStar(c2, c0, d1, n)
The "Evening Doji Star" is a bearish pattern consists of three candles.
Parameters:
c2 (simple bool) : (simple bool) Before previous candle's body must be higher than average, default is true.
c0 (simple bool) : (simple bool) Current candle's body must be higher than average. Optional argument, default is true.
d1 (simple float) : (simple float) Previous candle's body percentage out of candle range. Optional argument, default is 5.
n (simple int) : (simple int) Length of average candle's body. Optional argument, default is 14.
eveningStar(c2, c1, c0, n)
The "Evening Star" is a bearish pattern consists of three candles.
Parameters:
c2 (simple bool) : (simple bool) Before previous candle's body must be higher than average. Optional argument, default is true.
c1 (simple bool) : (simple bool) Previous candle's body must be lower than average. Optional argument, default is true.
c0 (simple bool) : (simple bool) Current candle's body must be higher than average. Optional argument, default is true.
n (simple int) : (simple int) Length of average candle's body. Optional argument, default is 14.
fallingThreeMethods(c4, c3, c2, c1, c0, n)
The "Falling Three Methods" is a bearish pattern consists of five candles.
Parameters:
c4 (simple bool) : (simple bool) 5th candle ago body must be higher than average. Optional argument, default is true.
c3 (simple bool) : (simple bool) 4th candle ago body must be lower than average. Optional argument, default is true.
c2 (simple bool) : (simple bool) 3rd candle ago body must be lower than average. Optional argument, default is true.
c1 (simple bool) : (simple bool) 2nd candle ago body must be lower than average. Optional argument, default is true.
c0 (simple bool) : (simple bool) Current candle's body must be higher than average. Optional argument, default is true.
n (simple int) : (simple int) Length of average candle's body. Optional argument, default is 14.
Returns: (bool)
fallingWindow()
The "Falling Window" is a bearish pattern consists of two candles.
gravestoneDoji(d0)
The "Gravestone Doji" is a bearish pattern consists of one candle.
Parameters:
d0 (simple float) : (simple float) Current candle's body percentage out of candle range. Optional argument, default is 5.
hammer(c0, n)
The "Hammer" is a bullish pattern consists of one candle.
Parameters:
c0 (simple bool) : (simple bool) Current candle's body must be lower than average. Optional argument, default is true.
n (simple int) : (simple int) Length of average candle's body. Optional argument, default is 14.
hangingMan(c0, n)
The "Hanging Man" is a bearish pattern consists of one candle.
Parameters:
c0 (simple bool) : (simple bool) Current candle's body must be lower than average. Optional argument, default is true.
n (simple int) : (simple int) Length of average candle's body. Optional argument, default is 14.
haramiCross(order, c1, n)
The "Harami Cross" candlestick pattern is a bullish/bearish pattern consists of two candles.
Parameters:
order (string) : (simple string) Pattern order type "bull" or "bear".
c1 (simple bool) : (simple bool) Previous candle's body must be higher than average. Optional argument, default is true.
n (simple int) : (simple int) Length of average candle's body. Optional argument, default is 14.
harami(order, c1, c0, n)
The "Harami" candlestick pattern is a bullish/bearish pattern consists of two candles.
Parameters:
order (string) : (simple string) Pattern order type "bull" or "bear"
c1 (simple bool) : (simple bool) Previous candle's body must be higher than average. Optional argument, default is true.
c0 (simple bool) : (simple bool) Current candle's body must be lower than average. Optional argument, default is true.
n (simple int) : (simple int) Length of average candle's body. Optional argument, default is 14.
invertedHammer(c0, n)
The "Inverted Hammer" is a bullish pattern consists of one candle.
Parameters:
c0 (simple bool) : (simple bool) Current candle's body must be lower than average. Optional argument, default is true.
n (simple int) : (simple int) Length of average candle's body. Optional argument, default is 14.
kicking(order, c1, c0, n)
The "Kicking" candlestick pattern is a bullish/bearish pattern consists of two candles.
Parameters:
order (string) : (simple string) Pattern order type "bull" or "bear"
c1 (simple bool) : (simple bool) Previous candle's body must be higher than average. Optional argument, default is true.
c0 (simple bool) : (simple bool) Current candle's body must be higher than average. Optional argument, default is true.
n (simple int) : (simple int) Length of average candle's body. Optional argument, default is 14.
longLowerShadow(l0)
The "Long Lower Shadow" candlestick pattern is a bullish pattern consists of one candles.
Parameters:
l0 (simple float) : (simple float) Current candle's lower wick min percentage out of candle range. Optional argument, default is 75.
longUpperShadow(u0)
The "Long Upper Shadow" candlestick pattern is a bearish pattern consists of one candles.
Parameters:
u0 (simple float) : (simple float) Current candle's upper wick min percentage out of candle range. Optional argument, default is 75.
marubozuBlack(c0, n)
The "Marubozu Black" candlestick pattern is a bearish pattern consists of one candles.
Parameters:
c0 (simple bool) : (simple bool) Current candle's body must be higher than average. Optional argument, default is true.
n (simple int) : (simple int) Length of average candle's body. Optional argument, default is 14.
marubozuWhite(c0, n)
The "Marubozu White" candlestick pattern is a bullish pattern consists of one candles.
Parameters:
c0 (simple bool) : (simple bool) Current candle's body must be higher than average. Optional argument, default is true.
n (simple int) : (simple int) Length of average candle's body. Optional argument, default is 14.
morningDojiStar(c2, d1, c0, n)
The "Morning Doji Star" candlestick pattern is a bullish pattern consists of three candles.
Parameters:
c2 (simple bool) : (simple bool) Before previous candle's body must be higher than average. Optional argument, default is true.
d1 (simple float) : (simple float) Previous candle's body percentage out of candle range. Optional argument, default is 5.
c0 (simple bool) : (simple bool) Current candle's body must be higher than average. Optional argument, default is true.
n (simple int) : (simple int) Length of average candle's body. Optional argument, default is 14.
morningStar(c2, c1, c0, n)
The "Morning Star" candlestick pattern is a bullish pattern consists of three candles.
Parameters:
c2 (simple bool) : (simple bool) Before previous candle's body must be higher than average. Optional argument, default is true.
c1 (simple bool) : (simple bool) Previous candle's body must be lower than average. Optional argument, default is true.
c0 (simple bool) : (simple bool) Cuurent candle's body must be higher than average. Optional argument, default is true.
n (simple int) : (simple int) Length of average candle's body. Optional argument, default is 14.
onNeck(c1, c0, n)
The "On Neck" candlestick pattern is a bearish pattern consists of two candles.
Parameters:
c1 (simple bool) : (simple bool) Previous candle's body must be higher than average. Optional argument, default is true.
c0 (simple bool) : (simple bool) Cuurent candle's body must be lower than average. Optional argument, default is true.
n (simple int) : (simple int) Length of average candle's body. Optional argument, default is 14.
piercing(c1, n)
The "Piercing" candlestick pattern is a bullish pattern consists of two candles.
Parameters:
c1 (simple bool) : (simple bool) Previous candle's body must be higher than average. Optional argument, default is true.
n (simple int) : (simple int) Length of average candle's body. Optional argument, default is 14.
risingThreeMethods(c4, c3, c2, c1, c0, n)
The "Rising Three Methods" candlestick pattern is a bullish pattern consists of five candles.
Parameters:
c4 (simple bool) : (simple bool) 5th candle ago body must be higher than average. Optional argument, default is true.
c3 (simple bool) : (simple bool) 4th candle ago body must be Lower than average. Optional argument, default is true.
c2 (simple bool) : (simple bool) 3rd candle ago body must be Lower than average. Optional argument, default is true.
c1 (simple bool) : (simple bool) 2nd candle ago body must be Lower than average. Optional argument, default is true.
c0 (simple bool) : (simple bool) Current candle's body must be higher than average. Optional argument, default is true.
n (simple int) : (simple int) Length of average candle's body. Optional argument, default is 14.
risingWindow()
The "Rising Window" candlestick pattern is a bullish pattern consists of two candle.
shootingStar(c0, n)
The "Shooting Star" candlestick pattern is a bearish pattern consists of one candle.
Parameters:
c0 (simple bool) : (simple bool) Current candle's body must be higher than average. Optional argument, default is true.
n (simple int) : (simple int) Length of average candle's body. Optional argument, default is 14.
spinningTopBlack(l0, u0)
The "Spinning Top Black" is neither bullish or bearish.
Parameters:
l0 (simple float) : (simple float) Current candle's lower wick min percentage out of candle range. Optional argument, default is 34.
u0 (simple float) : (simple float) Current candle's upper wick min percentage out of candle range. Optional argument, default is 34.
spinningTopWhite(l0, u0)
The "Spinning Top White" is neither bullish or bearish.
Parameters:
l0 (simple float) : (simple float) Current candle's lower wick min percentage out of candle range. Optional argument, default is 34.
u0 (simple float) : (simple float) Current candle's upper wick min percentage out of candle range. Optional argument, default is 34.
threeBlackCrows(c2, c1, c0, n)
The "Three Black Crows" candlestick pattern is a bearish pattern consists of three candles.
Parameters:
c2 (simple bool) : (simple bool) Before previous candle's body must be higher than average. Optional argument, default is true.
c1 (simple bool) : (simple bool) Previous candle's body must be higher than average. Optional argument, default is true.
c0 (simple bool) : (simple bool) Cuurent candle's body must be higher than average. Optional argument, default is true.
n (simple int) : (simple int) Length of average candle's body. Optional argument, default is 14.
threeWhiteSoldiers(c2, c1, c0, n)
The "Three White Soldiers" candlestick pattern is a bullish pattern consists of three candles.
Parameters:
c2 (simple bool) : (simple bool) Before previous candle's body must be higher than average. Optional argument, default is true.
c1 (simple bool) : (simple bool) Previous candle's body must be higher than average. Optional argument, default is true.
c0 (simple bool) : (simple bool) Cuurent candle's body must be higher than average. Optional argument, default is true.
n (simple int) : (simple int) Length of average candle's body. Optional argument, default is 14.
triStar(order, d2, d1, d0)
The "Tri Star" candlestick pattern is a bullish/bearish pattern consists of three candles.
Parameters:
order (simple string) : (simple string) Pattern order type "bull" or "bear".
d2 (simple float) : (simple float) Before previous candle's body percentage out of candle range. Optional argument, default is 5.
d1 (simple float) : (simple float) Previous candle's body percentage out of candle range. Optional argument, default is 5.
d0 (simple float) : (simple float) Current candle's body percentage out of candle range. Optional argument, default is 5.
tweezerBottom(c1, n)
The "Tweezer Bottom" candlestick pattern is a bullish pattern consists of two candles.
Parameters:
c1 (simple bool) : (simple bool) Previous candle's body must be higher than average. Optional argument, default is true.
n (simple int) : (simple int) Length of average candle's body. Optional argument, default is 14.
tweezerTop(c1, n)
The "Tweezer Top" candlestick pattern is a bearish pattern consists of two candles.
Parameters:
c1 (simple bool) : (simple bool) Previous candle's body must be higher than average. Optional argument, default is true.
n (simple int) : (simple int) Length of average candle's body. Optional argument, default is 14.
upsideTasukiGap(c2, c1, n)
The "Tri Star" candlestick pattern is a bullish pattern consists of three candles.
Parameters:
c2 (simple bool) : (simple bool) Before Previous candle's body must be higher than average. Optional argument, default is true.
c1 (simple bool) : (simple bool) Previous candle's body must be lower than average. Optional argument, default is true.
n (simple int) : (simple int) Length of average candle's body. Optional argument, default is 14.
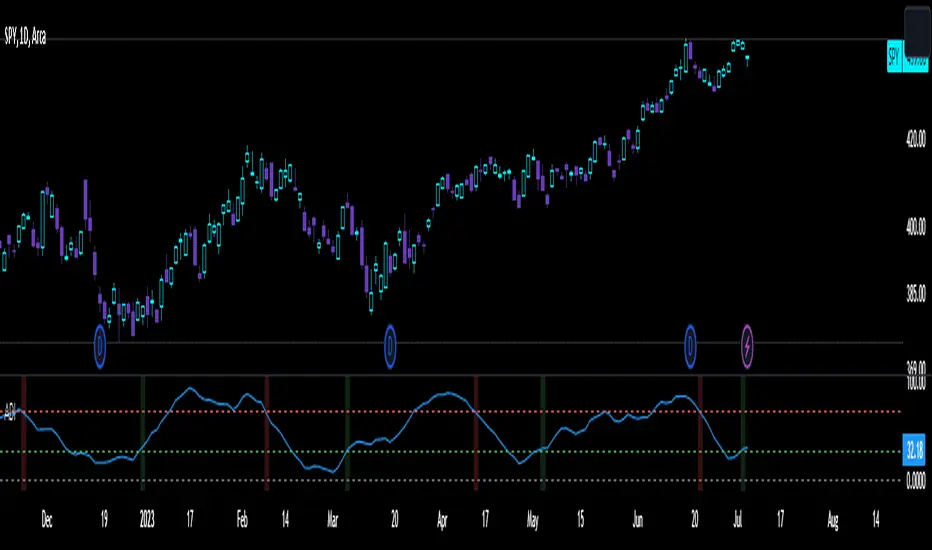
Trend Correlation Oscillator [SS]Hello,
Publishing this simple indicator.
What is it?
The Trend Correlation Oscillator takes the concept of my autocorrelation oscillator but applies it simply to time instead of autocorrelation.
It performs a correlation assessment to time. The theory behind it is the stronger the correlation, the more "exhausted" the trend and the more likely the trend will reverse. It is kind of building off of random walk theory in which the market should be random and efficient.
Does it work?
If you follow me on my indicator side, you will know that my indicators are all based on my own research and findings and stuff that I personally find that works. All of this comes from years of losing money trying to use conventional systems and finally developing my own stuff that I find works well. This is such an invention. It does work extremely well but its best applied for day traders. If you want to use this as a swing trader, play around with the lookback length. I don't have general recommendations to swing traders wanting to use this because this isn't an indicator I personally would use for swing trading (I would use the autocorrelation oscillator for that).
How to use it:
The default setting is to a 14 candle lookback. This works the best. It also should really be used on the 5 minute chart and not the 1 minute chart, as from my experience this works much better.
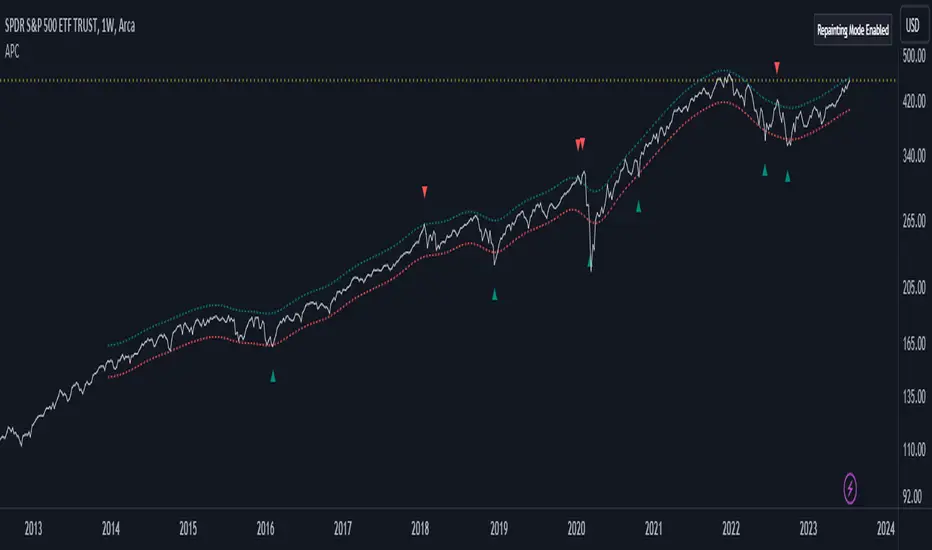
When a trend is approaching "exhaustion" to the upside, the indicator will turn red to let you know we are approaching a trend exhaustion. Once the exhaustion is at its peak and beginning to reverse, the indicator will place a cross symbol on where your entry should be. See the image below for an example:
It also works well if you combine it with my PTCR Correlation Indicator:
Closing thoughts
That is basically the indicator. Its one of my more simple ones, but many times simple is better and most effective!
Hopefully you find it helpful.
As always let me know your questions, comments and feedback/recommendations for improvements below.
Please know I do read and make note of all recommendations for indicators and improvements, however as it is just me managing them, it takes time for implementation and review :-).
Safe trades!

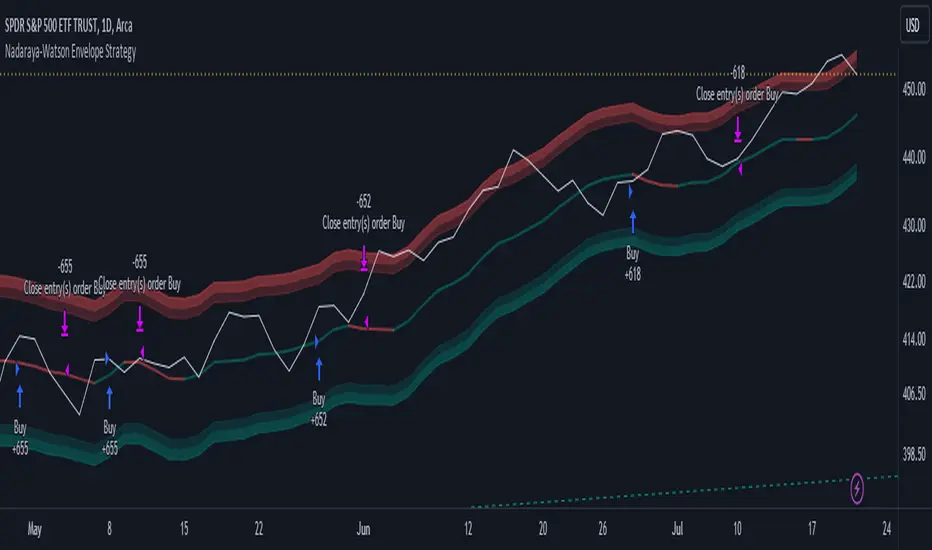
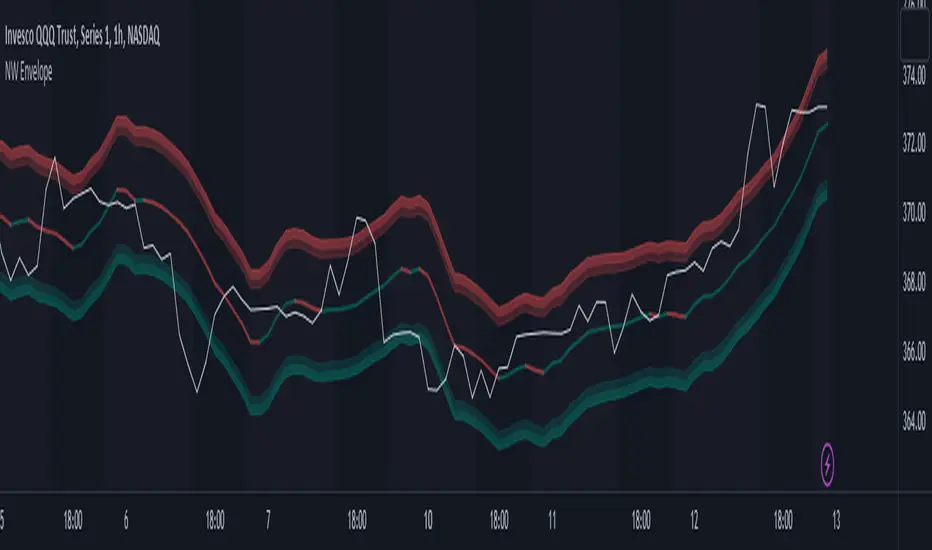
Nadaraya-Watson Envelope Strategy (Non-Repainting) Log ScaleIn the diverse world of trading strategies, the Nadaraya-Watson Envelope Strategy offers a different approach. Grounded in mathematical analysis, this strategy utilizes the Nadaraya-Watson kernel regression, a method traditionally employed for interpreting complex data patterns.
At the core of this strategy lies the concept of 'envelopes', which are essentially dynamic volatility bands formed around the price based on a custom Average True Range (ATR). These envelopes help provide guidance on potential market entry and exit points. The strategy suggests considering a buy when the price crosses the lower envelope and a sell when it crosses the upper envelope.
One distinctive characteristic of the Nadaraya-Watson Envelope Strategy is its use of a logarithmic scale, as opposed to a linear scale. The logarithmic scale can be advantageous when dealing with larger timeframes and assets with wide-ranging price movements.
The strategy is implemented using Pine Script v5, and includes several adjustable parameters such as the lookback window, relative weighting, and the regression start point, providing a level of flexibility.
However, it's important to maintain a balanced view. While the use of mathematical models like the Nadaraya-Watson kernel regression may provide insightful data analysis, no strategy can guarantee success. Thorough backtesting, understanding the mathematical principles involved, and sound risk management are always essential when applying any trading strategy.
The Nadaraya-Watson Envelope Strategy thus offers another tool for traders to consider. As with all strategies, its effectiveness will largely depend on the trader's understanding, application, and the specific market conditions.
Adaptive Price Channel (log scale)The field of technical analysis is consistently expanding, with numerous indicators used for market forecasting. Amongst them, a novel indicator dubbed the Adaptive Price Channel (log scale), inspired by the renowned Nadaraya-Watson Envelope (LuxAlgo) from LuxAlgo, is gaining traction for its distinctive features and versatility. Unlike its predecessor, the Adaptive Price Channel (log scale) is applicable on a logarithmic scale, thereby allowing it to be utilized on both smaller and larger timeframes.
1. Key Features
The Adaptive Price Channel (log scale) is founded on the trading view Pinescript language, version 5, with its primary aim to maximize the versatility and scalability of trading indicators. It allows traders to adapt it according to their preferred timeframe, thereby making it applicable for a wide range of trading strategies.
Its bandwidth can be adjusted through the input parameters, offering traders the flexibility to manipulate the indicator according to their strategic requirements. Furthermore, it provides an option for repainting smoothing. This option enables users to control the repainting effect in which the historical output of the indicator may change over time. When disabled, the indicator provides the endpoints of the calculations, ensuring consistency in historical values.
Moreover, the Adaptive Price Channel (log scale) allows for color customization, thereby improving visibility and user-friendliness. The colors of the indicator's upward and downward directions can be changed according to the user's preference.
2. Working Mechanism
The Adaptive Price Channel (log scale) uses the logarithm of the source, which is typically the closing price of a trading instrument. It leverages a Gaussian function that exponentially decreases the further the price moves away from the mean, accounting for both positive and negative values. The bandwidth of the Gaussian function can be adjusted to adapt to different market conditions.
Additionally, the Adaptive Price Channel (log scale) features an array of 500 lines for each bar, which helps in defining the boundaries or envelope for price movements. The calculations are executed using the Nadaraya-Watson estimator, which uses kernel regression for non-parametric analysis.
The calculated values for the upper and lower bounds of the envelope are then converted back from the logarithmic scale using the exponential function. This calculation process continues for each bar until the last bar in the data set.
To ensure optimal performance, the Adaptive Price Channel (log scale) uses dynamic repainting. If the repainting mode is enabled, it adjusts the smoothing of the indicator for the entire historical data, making the results more accurate.
3. Visualization and Alerts
The Adaptive Price Channel (log scale) offers an array of visual aids, including labels and plots. The upper and lower bounds of the envelope are plotted, and the indicator triggers labels at points where the closing price crosses these boundaries. These labels serve as alerts for potential trading opportunities.
4. Conclusion
The Adaptive Price Channel (log scale) is an innovative and adaptable trading indicator, drawing inspiration from its predecessor but introducing unique features to increase its versatility. By providing a repainting option, it ensures consistent historical values, thereby enhancing the reliability of the indicator. Furthermore, the capability to operate on a logarithmic scale broadens its usability for different timeframes. The Adaptive Price Channel (log scale) is a powerful tool for any trader, facilitating a better understanding of market dynamics, and enabling more informed decision-making.
GBTC Discount/Premium to NAVGBTC Discount/Premium to NAV, dynamically adjust BTC holdings per share daily

[EKIN] ATR Exit StrategyMy exit strategy to reduce risk via tracking price and ATR. Sets new STOP price based on how many ATR is current price above from the entry price.
I only check 5 and 20 EMAs for entry strategy. I intentionally used a simple entry strategy to further test the impact of this exit strategy.
First sets STOP at 1.5 ATR below the entry price.
If there is a 2 ATR increase, pulls STOP to the entry point to eliminate the possibility of loss.
If there is a 3 ATR increase, takes a 50% profit and moves STOP to 1 ATR above the entry price.
If there is a 4 ATR increase, moves STOP to 2 ATR above the entry price.
If there is a 5 ATR increase, moves STOP to 3 ATR above the entry price.
.
.
.
This is my first strategy attempt so I am open to any recommendations. I am planning to update this strategy overtime when I get better at pinescript and trading in general

Buyers & Sellers / RangeBuyers & Sellers / Range
Volatility oscillator that measures the relationship of Buying & Selling Pressure to True Range.
In other words, how much % Buyers and Sellers separately occupy the Bar
BSP is a part of Bar Range. Entire bar metrics will always have bigger value than its composite elements (body and wicks).
Since there will be NO chance of BP or SP being more than ATR, their ratio would serve crucial Volatility details.
Hence, we can relate each of them to the overall range.
As a result we have simultaneous measurements of proportions buyers and sellers to the bar.
Default mode shows BP/ATR and SP/ATR mirrored. When one rises, the other falls to compensate.
Buying Pressure / True Range ⬆️🟢 ⬇️🔵
Selling Pressure / True Range ⬆️🔴 ⬇️🟠
They are being averaged in 2 different ways:
Pre-average first, then relate as ratio
Related first, then Averaged
Enable "Preaveraged" to use already averaged BSP and Ranges in ratio instead of averaging the ratio of BSP to individual bar. For example, we're looking BP/ATR, in calculation of buyers / Range it will use "MA(Buying Pressure) / MA(True Range)" instead of "MA(Buying Pressure / True Range)".
Due such calculation, it is going to be more lagging than in off mode. Nevertheless, it reduces noise from the impact of individual bar change.
Second way of noise reduction is enabling "Body / Range"
BSP Body / Range where Bullish & Bearish Body = Buying & Selling Pressure - Relevant Wick
Buying Body = Buying Pressure - Lower Wick
Selling Body = Selling Pressure - Upper Wick
And only then it is divided to ATR.
Note that Balance line differs because body is less than it used to be with wicks. So change in wicks won't play any role in computing the ratio anymore. Thus, signals of their crossings will be more reliable than in default mode.

Trailing Stop Loss SuperTrendThe Trailing Stop Loss SuperTrend indicator is a popular technical analysis tool used by traders to identify trends and determine optimal entry and exit points in financial markets. This indicator combines elements of the SuperTrend indicator and trailing stop loss orders to provide valuable insights into market trends and potential reversals. By incorporating Average True Range (ATR) calculations, it adapts to market volatility, making it suitable for various trading strategies. Let's explore the key use cases and benefits of the Trailing Stop Loss SuperTrend indicator:
Trend Identification:
The primary purpose of the Trailing Stop Loss SuperTrend indicator is to identify market trends. It plots two lines on the chart: an upper band (referred to as the "up" line) and a lower band (referred to as the "dn" line). The direction of these bands helps traders determine the prevailing trend. When the price is above the upper band, it suggests a bullish trend, and when it is below the lower band, it indicates a bearish trend.
Entry and Exit Signals:
The Trailing Stop Loss SuperTrend indicator generates entry and exit signals based on trend changes. When the trend changes from bearish to bullish, a buy signal is triggered, indicating a potential entry point. Conversely, when the trend changes from bullish to bearish, a sell signal is generated, suggesting a possible exit or short-selling opportunity. These signals can be used in conjunction with other trading strategies or indicators to enhance trading decisions.
Trailing Stop Loss Orders:
One of the distinguishing features of the Trailing Stop Loss SuperTrend indicator is its ability to incorporate trailing stop loss orders. Traders can use the indicator's upper and lower bands as trailing stop levels to protect profits and manage risk. For example, in a bullish trend, the stop loss level can be set at the lower band, and as the price rises, the stop loss level trails along with it, locking in profits and reducing potential losses.
Volatility Adaptation:
By incorporating the ATR (Average True Range) calculation, the Trailing Stop Loss SuperTrend indicator adjusts its sensitivity to market volatility. A higher ATR multiplier widens the distance between the price and the bands, accommodating higher volatility, while a lower multiplier tightens the bands during periods of lower volatility. This adaptability makes the indicator versatile and suitable for various market conditions.
Alerts and Notifications:
The Trailing Stop Loss SuperTrend indicator provides the ability to set alerts for specific events, such as trend changes, buy signals, and sell signals. Traders can receive real-time notifications via email, SMS, or on-platform alerts, ensuring they stay informed about potential trading opportunities and important market developments.
Conclusion:
The Trailing Stop Loss SuperTrend indicator is a valuable tool for traders seeking to identify trends, generate entry and exit signals, and effectively manage risk. Its ability to adapt to market volatility and incorporate trailing stop loss orders enhances trading strategies and decision-making. By combining the SuperTrend concept with trailing stop loss functionality, this indicator provides traders with a comprehensive approach to trend analysis and risk management. Whether used in isolation or in conjunction with other indicators, the Trailing Stop Loss SuperTrend indicator offers a powerful tool for navigating the dynamic world of financial markets.

Baseline Indicator [SS]Hello,
This is the Baseline Indicator. I modelled it after one of my favourite Tradingview chart types, the baseline type (shown in image below):
I really love this chart, but I wanted a way for it to:
a) Be static and not move with the chart; and
b) Auto calculate the baseline average for a specified period of time.
So I created this indicator which does essentially that.
What it does:
The indicator will calculate the average between the high and low of a user defined timeframe. The timeframe is customizable, but it defaults to daily. It will then plot the average (or baseline) of the high and low over that specified timeframe. The default plot is a candle plot. It will change the colours of the candles to green (for above the baseline) and red (for below the baseline). The chart below shows an example of the indicator with candles on SPY. The Baseline timeframe is set to 1 hour:
You can choose whether you want to plot the current baseline average or the previous.
The advantage to plotting the previous is that this provide a static reference point and can be helpful on the 30 and 60 minute timeframe. Here is an example:
In this example on SPY, the indicator is plotting the previous average. You can see SPY is using this as support and creating a "staircase" pattern. This is indicative of a trend.
The example above is using the previous day average on the daily timeframe during a sideways day. You can see that the price action accumulates and is consistently drawn to this point.
Inversely, you can manually select your own baseline price if you want a static, self-calculated baseline reference point.
Options and Settings:
Below is an outline of the menu as well as a brief explanation of the options and settings:
To view your chart as a baseline chart, make sure you select the "Line" input and then hide the candles on your chart using your chart settings (see image below):
The purple arrow shows how to hide the candles. You select the "Eye" Icon which should then become greyed out and you will be left with the baseline chart from the indicator.
Why use baseline average?
The average between the high and low of a designated timeframe is a very helpful value. In choppy markets, this acts as a key point of frequent return. In trendy markets, this acts as a reference point of trend direction and strength. I encourage you to play around with the indicator and review some historical charts using it, and you will see some patterns emerge!
Final thoughts:
I have also done a quick tutorial video on the indicator for your reference, you can check that out below:
Thanks for checking out the indicator and I hope you like it!

MW Volume ImpulseMW Volume Impulse
Settings
* Moving Average Period: The moving average period used to generate the moving average line for the bar chart. Default=14
* Dot Size: The size of the dot that indicates when the moving average of the CVD is breached. Default=10
* Dot Transparency: The transparency of the dot that indicates when the moving average of the CVD is breached. Default=50
* EMA: The exponential moving average that the price must break through, in addition to the CVD moving
* Accumulation Length: Period used to generate the Cumulative Volume Delta (CVD) for the bar chart. Default=14
Introduction
Velocity = Change in Position over time
Acceleration = Change in Velocity over time
For this indicator, Position is synonymous with the Cumulative Volume Delta (CVD) value. What the indicator attempts to do is to determine when the rate of acceleration of buying or selling volume is changing in either or buying or selling direction in a meaningful way.
Calculations
The CVD, upon which these changes is calculated using candle bodies and wicks. For a red candle, buying volume is calculated by multiplying the volume by the spread percentage of the average of the top and bottom wicks, while Selling Volume is calculated multiplying the volume by the spread percentage of the average of the top and bottom wicks - in addition to the spread percentage of the candle body.
For a green candle, buying volume is calculated by multiplying the volume by the spread percentage of the average of the top and bottom wicks - plus the spread percentage of the candle body - while Selling Volume is calculated using only the spread percentage average of the top and bottom wicks.
How to Interpret
The difference between the buying volume and selling volume is the source of what generates the red and green bars on the indicator. But, more specifically, this indicator uses an exponential moving average of these volumes (14 EMA by default) to determine that actual bar size. The change in this value indicates the velocity of volume and, ultimately, the red and green bars on the indicator.
- When the bar height is zero, that means that there is no velocity, which indicates either a balance between buyers and sellers, or very little volume.
- When the bar height remains largely unchanged from period to period - and not zero - it means that the velocity of volume is constant in one direction. That direction is indicated by the color of the bar. Buyers are dominating when the bars are green, and sellers are dominating when the bars are red.
- When the bar height increases, regardless of bar color, it means that volume is accelerating in a buying direction.
- When the bar height decreases, regardless of bar color, it means that volume is accelerating in a selling direction.
The white line represents the moving average of the bar values, while the red and white - and green and white - dots show when the moving average has been breached by the Cumulative Volume Delta value AND the price has broken the 7 EMA (which is user editable). As with most moving averages, a breach can indicate a move in a bearish or bullish direction, and the sensitivity can be adjusted for differing market conditions
Other Usage Notes and Limitations
For better use of the signal, consider the following,
1. Volume moving below the moving average can indicate that the volume may be ready to exit an overbought condition, especially if the bars were making lower highs prior to the signal - regardless of bar color.
3. Volume moving above the moving average can indicate that the volume may be ready to exit an oversold condition, especially if the bars were making higher lows prior to the signal - regardless of bar color.
Additionally, a green dot that occurs with a positive (green) Cumulative Volume Delta can indicate a buying condition, while a red dot that occurs with a negative (red) Cumulative Volume Delta can indicate a selling condition. What this means is that buying or selling momentum briefly went against the direction of buying or selling Cumulative Volume Delta , but was not strong enough to change the buying or selling direction. In cases like this, once the volume begins to accelerate again in the direction of the buying or selling volume - indicated by a red or green dot - then the price is more likely to favor the direction of the Cumulative Volume Delta and its corresponding acceleration.
Although a red or green signal can indicate a change in direction, this script cannot predict the magnitude or duration of the change. It is best used with accompanying indicators that can be used to confirm a direction change, such as a moving average, or a supply or demand range.

Modern Portfolio Management IndicatorAfter weeks of grueling over this indicator, I am excited to be releasing it!
Intro:
This is not a sexy, technical or math based indicator that will give you buy and sell signals or anything fancy, but it is an indicator that I created in hopes to bridge a gap I have noticed. That gap is the lack of indicators and technical resources for those who also like to plan their investments. This indicator is tailored to those who are either established investors and to those who are looking to get into investing but don't really know where to start.
The premise of this indicator is based on Modern Portfolio Theory (MPT). Before we get into the indicator itself, I think its important to provide a quick synopsis of MPT.
About MPT:
Modern Portfolio Theory (MPT) is an investment framework that was developed by Harry Markowitz in the 1950s. It is based on the idea that an investor can optimize their investment portfolio by considering the trade-off between risk and return. MPT emphasizes diversification and holds that the risk of an individual asset should be assessed in the context of its contribution to the overall portfolio's risk. The theory suggests that by diversifying investments across different asset classes with varying levels of risk, an investor can achieve a more efficient portfolio that maximizes returns for a given level of risk or minimizes risk for a desired level of return. MPT also introduced the concept of the efficient frontier, which represents the set of portfolios that offer the highest expected return for a given level of risk. MPT has been widely adopted and used by investors, financial advisors, and portfolio managers to construct and manage portfolios.
So how does this indicator help with MPT?
The thinking and theory that went behind this indicator was this: I wanted an indicator, or really just a "way" to test and back-test ticker performance over time and under various circumstances and help manage risk.
Over the last 3 years we have seen a massive bull market, followed by a pretty huge bear market, followed by a very unexpected bull market. We have been and continue to be plagued with economic and political uncertainty that seems to constantly be looming over everyone with each waking day. Some people have liquidated their retirement investments, while others are fomoing in to catch this current bull run. But which tickers are sound and how tickers and funds have compared amongst each other remains somewhat difficult to ascertain, absent manually reviewing and calculating each ticker individually.
That is where this indicator comes in. This indicator permits the user to define up to 5 equities that they are potentially interested in investing in, or are already invested in. The user can then select a specific period in time, say from the beginning of 2022 till now. The user can then define how much they want to invest in each company by number of shares, so if they want to buy 1 share a week, or 2 shares a month, they can input these variables into the indicator to draw conclusions. As many brokers are also now permitting fractional share trading, this ability is also integrated into the indicator. So for shares, you can put in, say, 0.25 shares of SPY and the indicator will accept this and account for this fractional share.
The indicator will then show you a portfolio summary of what your earnings and returns would be for the defined period. It will provide a percent return as well as the projected P&L based on your desired investment amount and frequency.
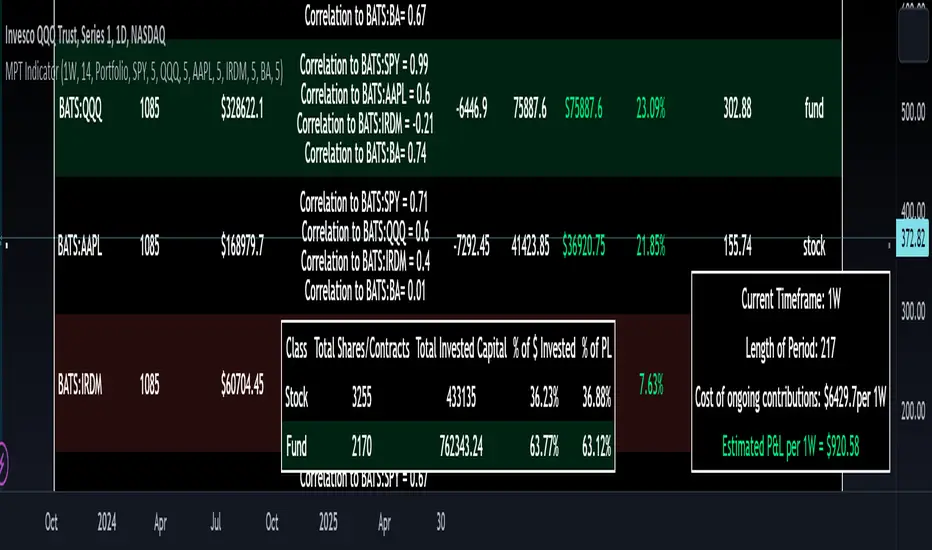
But it goes beyond just that, you can also have the indicator display a simple forecasting projection of the portfolio. It will show the projected P&L and % Return over various periods in time on each of the ticker (see image below):
The indicator will also break down your portfolio allocation, it will show where the majority of your holdings are and where the majority of your P&L in coming from (best performers will show a green fill and worst will show a red fill, see image below):
This colour coding also extends to the portfolio breakdown itself.
Dollar cost averaging (DCA) is incorporated into the indicator itself, by assuming ongoing contributions. If you want to stop contributions at a certain point, you just select your end time for contributions at the point in which you would stop contributing.
The indicator also provides some basic fundamental information about the company tickers (if applicable). Simply select the "Fundamental" chart and it will display a breakdown of the fundamentals, including dividends paid, market cap and earnings yield:
The indicator also provides a correlation assessment of each holding against each other holding. This emphasizes the profound role of diversification on portfolios. The less correlation you have in your portfolio among your holdings, the better diversified you are. As well, if you have holdings that are perfectly inverse other holdings, you have a pseudo hedge against the downturn of one of your holdings. This is even more helpful if the inverse is a company with solid fundamentals.
In the below example you will see NASDAQ:IRDM in the portfolio. You will be able to see that NASDAQ:IRDM has a slight inverse relationship to SPY:
Yet IRDM has solid fundamentals and is performing well fundamentally. Thus, this makes IRDIM a solid addition to your portfolio as it can potentially hedge against a downturn for SPY and is less risky than simply holding an inverse leveraged share on SPY which is most likely just going to cost you money than make you money.
Concluding remarks:
There are many fun and interesting things you can do with this indicator and I encourage you to try it out and have fun with it! The overall objective with the indicator is to help you plan for your portfolio and not necessarily to manage your portfolio. If you have a few stocks you are looking at and contemplating investing in, this will help you run some theoretical scenarios with this stock based on historical performance and also help give you a feel of how it will perform in the future based on past behaviour.
It is important to remember that past behaviour does not indicate future behaviour, but the indicator provides you with tools to get a feel for how a stock has performed under various circumstances and get a general feel of the fundamentals of the company you could potentially be investing in.
Please note, this indicator is not meant to replace full, fundamental analyses of individual companies. It is simply meant to give you a "gist" of how companies are fundamentally and how they have performed historically.
I hope you enjoy it!
Safe trades everyone!
Nadaraya-Watson Envelope (Non-Repainting) Logarithmic ScaleIn the fast-paced world of trading, having a reliable and accurate indicator can make all the difference. Enter the Nadaraya-Watson Envelope Indicator, a cutting-edge tool designed to provide traders with valuable insights into market trends and potential price movements. In this article, we'll explore the advantages of this non-repainting indicator and how it can empower traders to make informed decisions with confidence.
Accurate Price Analysis:
The Nadaraya-Watson Envelope Indicator operates in a logarithmic scale, allowing for more accurate price analysis. By considering the logarithmic nature of price movements, this indicator captures the subtle nuances of market dynamics, providing a comprehensive view of price action. Traders can leverage this advantage to identify key support and resistance levels, spot potential breakouts, and anticipate trend reversals.
Non-Repainting Reliability:
One of the most significant advantages of the Nadaraya-Watson Envelope Indicator is its non-repainting nature. Repainting indicators can mislead traders by changing historical signals, making it difficult to evaluate past performance accurately. With the non-repainting characteristic of this indicator, traders can have confidence in the reliability and consistency of the signals generated, ensuring more accurate backtesting and decision-making.
Customizable Parameters:
Every trader has unique preferences and trading styles. The Nadaraya-Watson Envelope Indicator offers a range of customizable parameters, allowing traders to fine-tune the indicator to their specific needs. From adjusting the lookback window and relative weighting to defining the start of regression, traders have the flexibility to adapt the indicator to different timeframes and trading strategies, enhancing its effectiveness and versatility.
Envelope Bounds and Estimation:
The Nadaraya-Watson Envelope Indicator calculates upper and lower bounds based on the Average True Range (ATR) and specified factors. These envelope bounds act as dynamic support and resistance levels, providing traders with valuable reference points for potential price targets and stop-loss levels. Additionally, the indicator generates an estimation plot, visually representing the projected price movement, enabling traders to anticipate market trends and make well-informed trading decisions.
Visual Clarity with Plots and Fills:
Clear visualization is crucial for effective technical analysis. The Nadaraya-Watson Envelope Indicator offers plots and fills to enhance visual clarity and ease of interpretation. The upper and lower boundaries are plotted, along with the estimation line, allowing traders to quickly assess price trends and volatility. Fills between the boundaries provide a visual representation of different price regions, aiding in identifying potential trading opportunities and risk management.
Conclusion:
The Nadaraya-Watson Envelope Indicator is a powerful tool for traders seeking accurate and reliable insights into market trends and price movements. With its logarithmic scale, non-repainting nature, customizable parameters, and visual clarity, this indicator equips traders with a competitive edge in the financial markets. By harnessing the advantages offered by the Nadaraya-Watson Envelope Indicator, traders can navigate the complexities of trading with confidence and precision. Unlock the potential of this advanced indicator and elevate your trading strategy to new heights.
Volume Pressure Based Buy and Sell SignalsThis script uses a volume pressure indicator to generate buy and sell signals. The volume pressure indicator is calculated by taking the sum of the product of volume and price change over a specified period of time, and then dividing that sum by the total volume over the same period. This gives a measure of the amount of buying pressure or selling pressure in the market.
The script then compares the volume pressure indicator to a moving average of the volume pressure indicator. When the volume pressure indicator crosses above the moving average, a buy signal is generated. When the volume pressure indicator crosses below the moving average, a sell signal is generated.
This script is beneficial to traders because it can help them to identify potential trend reversals. When the volume pressure indicator crosses above the moving average, it indicates that there is a growing amount of buying pressure in the market. This could be a sign that the trend is about to reverse from a downtrend to an uptrend. Conversely, when the volume pressure indicator crosses below the moving average, it indicates that there is a growing amount of selling pressure in the market. This could be a sign that the trend is about to reverse from an uptrend to a downtrend.

Market Smith IndicatorsMarket Smith has a collection of tools that are useful for identifying stocks. On their charts they have a 21/50/200 day moving averages, high and low pivot points, a relative strength line, and a relative strength rating. This script contains indicators for the following:
21/50/200 Day Moving Averages
High and Low pivot points
A Relative Strength line
A Relative Strength rating
21/50/200 Day Moving Averages
The 21/50/200 Day moving averages are simple moving averages. They are visible in any chart increment but to use them properly you need to set you charts to be by day. Labels will appear on the right of the lines to show that they are representative of 21/50/200 day moving averages.
High and Low pivot points
The High and Low pivot points are green for high pivot points and red for low points. They are show in the Market Smith style with the numbers simply above the pivot points.
Relative Strength line
The Relative Strength line is a line that shows the strength of the stock compared to the S&P 500. In this case we utilize the SPX ticker to compare the stock to. This line is almost identical to the Market Smith tool and is an excellent tool to determine how a stock is doing compared to the market. When movements in the stock and shown with sideways trending of the RS line that means that the stock is following the market. When a stock is outperforming the market the RS line will follow.
Relative Strength rating
Thank you to ©Fred6724 for the RS Rating inspiration. They wrote excellent open source code for a RS Rating comparable to Market Smith. As the RS Rating in Market Smith is not open source it is difficult to know exactly how it is being calculated. After simplifying Fred's code and building upon a few ideas I had I compared the RS Rating to multiple Market Smith Ratings. The rating is close but often off by multiple points. If there is anyone who has a better idea on how to get this rating or how to improve on the code please send me a PM or fork this project. This rating is a good indicator to see how a certain stock compares to other stocks in the market. In Market Smith they are able to utilize their database to compare it to all other stocks. Since we do not have access to the same tools we are only able to compare it to the percentage of stocks above the 200, 150, 100, 50, and 20 day moving average.
Using these tools together are a small fraction what make people like Bill O'neill and Jim Roppel so successful. I plan on updating the RS Rating as I continue to work on this project so if there is anyone who has ideas then please send me a PM. Ultimately the goal of this project is to have a solution that is identical to Market Smith.

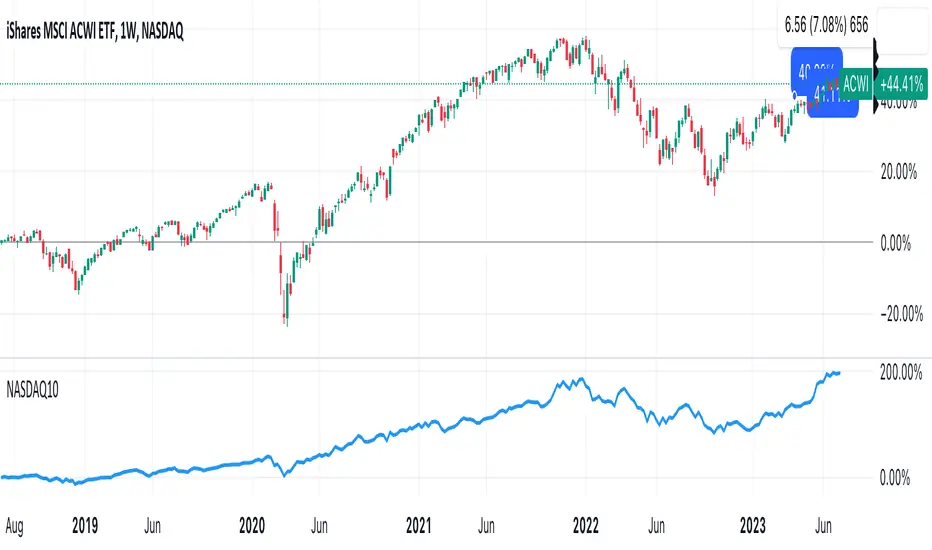
DrNon_NASDAQ10Title: NASDAQ 10 Index with TOP 10 Securities
Introduction:
TradingView offers traders and investors a powerful platform for technical analysis and trading. One of its notable features is the ability to create custom indices based on the values of multiple individual securities. In this blog post, we will explore how to build a custom index with 10 securities in TradingView using Pine Script, the platform's proprietary programming language.
Description:
Custom indices allow market participants to track the performance of a specific group of securities, providing valuable insights into the collective performance of the chosen assets. By leveraging Pine Script, traders can easily develop and deploy custom indicators and strategies to build their own indices.
The script provided focuses on creating a custom index with 10 securities. The selected securities include popular stocks such as AAPL (Apple Inc.), MSFT (Microsoft Corporation), GOOG (Alphabet Inc.), AMZN (Amazon.com Inc.), NVDA (NVIDIA Corporation), TSLA (Tesla Inc.), META (Facebook, Inc.), AVGO (Broadcom Inc.), PEP (PepsiCo, Inc.), and COST (Costco Wholesale Corporation).
Using the security() function in Pine Script, we retrieve the closing prices of each individual security to ensure accurate data for the index calculation.
The index value is then calculated by summing the closing prices of the 10 securities. This simple arithmetic operation captures the overall performance of the custom index.
To visualize the index, we use the plot() function to display the index value on the chart. Traders can observe the custom index alongside other technical indicators or price action, aiding in decision-making and market analysis.
By building a custom index with 10 securities in TradingView, traders gain a consolidated view of the performance of these chosen assets. This allows for easier tracking of sector trends, evaluation of specific strategies, and the ability to compare the performance of individual portfolios against the broader market.
Conclusion:
TradingView's Pine Script provides traders and investors with a flexible solution to build custom indices. By defining the 10 individual securities, calculating the index value, and plotting it on the chart, traders can monitor the collective performance of these chosen assets. Custom indices offer insights into sector performance, enable the evaluation of specific strategies, and provide a benchmark for comparing portfolio performance. By harnessing the power of custom indices in TradingView, traders can enhance their decision-making process and gain a competitive edge in the market.
HILOCLOP AnalysisThe "HILOCLOP Analysis" indicator is designed to analyze price data based on different conditions and provide insights into market trends and patterns. Let's break down its features and understand its potential usefulness in trading:
Sample Length: The indicator allows the user to specify the sample length, which determines the number of bars or periods considered for the analysis. This parameter can be adjusted to capture short-term or long-term trends and patterns in the market.
Raw Up/Down Analysis: The indicator calculates the number of occurrences where the current price values (high, low, open, close) are higher or lower than their previous values. It provides separate counts for each price component. By visualizing these counts on the chart, traders can identify periods of upward or downward movement in the price data.
HICLOP Analysis: The indicator offers a color scheme option called "HICLOP," which determines the color of the plotted results. If the HICLOP analysis is enabled, the plots representing raw up/down counts will have different colors based on whether the current count is higher or lower than the previous count. This color coding helps traders quickly identify changes in price trends.
Unchecking this Box will Show the general trend.
Raw HICLOP Color Scheme
Trend Color Scheme
Analysis Up vs. Down: The indicator provides an option to analyze instances where all four price components (high, low, open, close) are higher or lower than their respective previous values. This analysis helps traders identify periods of strong upward or downward movement in the market.
Analysis High vs. Low: The indicator compares the number of occurrences where the current high is higher than the previous high and the current low is higher than the previous low. It provides insights into whether the market is experiencing higher highs or higher lows, which can help traders determine the strength of an upward or downward trend.
Analysis Open vs. Close: The indicator compares the number of occurrences where the current close is higher than the previous close and the current open is higher than the previous open. This analysis helps traders assess the relationship between opening and closing prices, providing insights into the strength of buying or selling pressure in the market.
The usefulness of the "HILOCLOP Analysis" indicator in trading depends on the specific trading strategy and the trader's preferences. Here are a few potential use cases:
Trend Identification: By analyzing the raw up/down counts and the HICLOP color scheme, traders can identify trends and changes in price momentum. Increasing raw up counts and corresponding color changes to positive values may indicate an upward trend, while increasing raw down counts and negative color changes may suggest a downward trend.
Confirmation of Breakouts: Traders often look for confirmation of breakouts from key levels or chart patterns. The "Analysis Up V Dn" feature can help identify instances where all four price components simultaneously confirm a breakout, indicating a potentially significant move in the market.
Trend Reversals: The "Analysis High V Low" and "Analysis Open V Close" features can provide insights into potential trend reversals. For example, if there are more higher highs than higher lows, it may indicate a weakening trend, potentially signaling a reversal or a correction.

Disparity IndexThe Disparity Index is a technical momentum indicator that measures the relative position of the most recent closing price to a selected moving average. It calculates the percentage difference between the closing price and the moving average, providing insights into price momentum and potential reversals.
The formula for the Disparity Index is: * 100, where Close is the most recent closing price and n-period MA is the chosen moving average over n periods.
The Disparity Index can be used in various ways:
Trend Identification: The Disparity Index helps identify the relationship between the price and a chosen moving average. A positive value indicates that the price is above the moving average, suggesting bullish momentum, while a negative value suggests bearish momentum.
Overbought and Oversold Conditions: The Disparity Index can be used to identify potential overbought and oversold conditions. When the index reaches an extremely high value, it may indicate an overbought condition, implying a possible price correction. Conversely, an extremely low value can signal an oversold condition, indicating a potential price rebound.
Divergence: Traders can use the Disparity Index to identify divergence between the price and the indicator. Divergence occurs when the price and the Disparity Index move in opposite directions, potentially signaling an upcoming price reversal.
Personal Strategy: When the Disparity Index generates a green background, it suggests a potential bullish signal. This occurs when the Disparity Index crosses above the oversold threshold or exhibits a bullish reversal pattern. The green background signifies an area where buyers may have gained control, indicating a favorable environment for initiating long positions. This approach allows you to capitalize on potential upward price movements and join the uptrend.
On the other hand, when the Disparity Index generates a red background, it implies a potential bearish signal. This occurs when the Disparity Index crosses below the overbought threshold or exhibits a bearish reversal pattern. The red background highlights a zone where sellers might dominate, indicating a higher likelihood of downward price movements. By considering selling opportunities in these zones, you can position yourself to profit from potential downside moves and align with the prevailing downtrend.
The Disparity Index can be customized by using different types of moving averages such as simple moving averages (SMAs), exponential moving averages (EMAs), or weighted moving averages (WMAs). Additionally, it can be smoothed using another moving average to reduce noise and generate smoother signals, improving trend identification.
In trending markets, the Disparity Index is particularly effective as a trend indicator due to its ability to quickly capture price changes. It can provide early indications of trend strength and potential reversals, allowing traders to enter or exit positions in a timely manner. This advantage over traditional moving averages makes the Disparity Index a valuable tool for trend-following strategies.
Enjoy!
Webby's Tight IndicatorWebby's Tight Indicator is used to measure a securities volatility relative to itself over time. This is achieved by taking the average of three short term ATR's (average true range) and creating a ratio versus three longer term ATR's.
Mike Webster recently stated he is using the 3,5,8 for the short term ATR's and the 55,89,144 for the long term ATR's. All of the ATR lengths are part of the Fibonacci sequence.
The ratio of the ATR's is then calculated and plotted as a histogram with 0 representing the ATR's being equal. As a stocks short term ATR contracts the histogram will rise above 0 meaning volatility in the short term is contracting relative to long term volatility. On the other hand if the short ATR's are expanding versus the long term ATR's the histogram will fall below 0 and turn red, signifying short term volatility is greater than long term volatility.
The easy visualization of this indicator allows you to quickly see when a stock is in a tight range and could be ready for a potential breakout to the long side or breakdown to the short side.
In this example we see tight price action with a blue histogram followed by volatility to the upside coinciding with a breakout.
In this example we see volatility expanding as a stock continues to fall.
To help differentiate between trending contraction or expansion and just short term blips 5-day exponential moving average of the ratio is also plotted on the histogram and dynamically changes colors as it rises and falls.
Indicator options include:
Change histogram colors
Choose ema line width

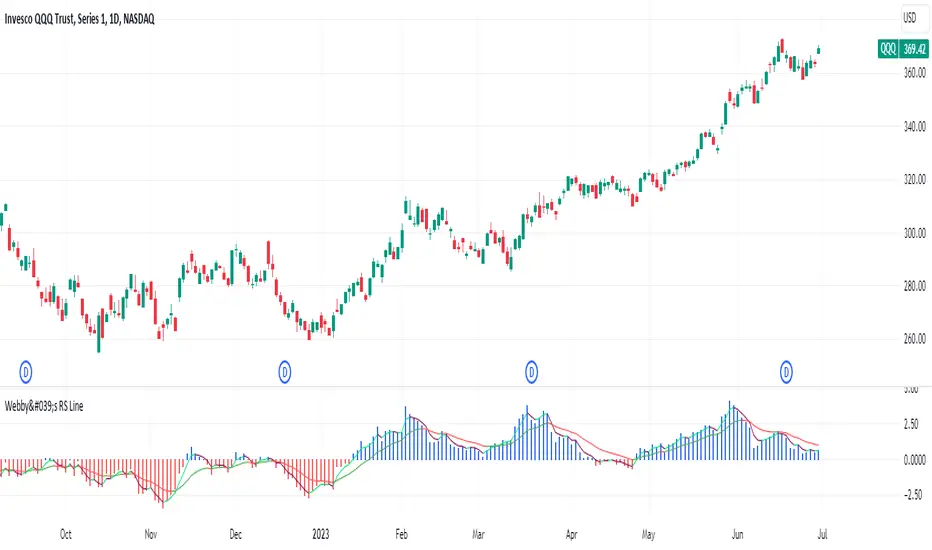
Webby's RS LineThe Relative Strength (RS) line is something many investors are familiar with. It is used to measure a stocks performance versus the S&P 500 and is typically calculated by dividing the closing price of the stock by the closing price of the S&P. This means if a stock moves up and the S&P moves down or the stock moves up more than the S&P the RS line will increase, if the stock moves down while the S&P moves up the line will decrease.
While the standard RS line is a powerful tool, Mike Webster recently discussed how he has made changes to the standard RS line and also uses a 21 exponential moving average of the RS line to help guide his decision making. This script puts those new twists on the standard RS line, by first calculating the RS line using the low of both the security and the S&P rather than the closing prices. Next it measures the 21-day exponential moving average of the RS line and plots the distance between the two as a histogram.
A strong trending stock that is out performing the market will see an extended period of a positive blue histogram signifying the RS line is above the 21-ema.
While on the other hand a stock in a downtrend that is underperforming will see a negative red histogram a red histogram signifying the RS line is below the 21-ema.
On top of all of that, the indicator also keeps 3 & 13 exponential moving average of the distance between the RS line and the 21 ema to help identify shorter term relative strength and capture more immediate shifts in momentum. Both of those are plotted on the histogram as well and will change color as they rise and fall making it easy to spot the direction.
Indicator options include:
Choose symbol to measure performance against
Change histogram colors
Choose ema line width
* Note this indicator does not plot the actual RS line, it is the histogram representing the distance between the RS line calculated using the lows and the 21 ema, as well as the two ema's of the relationship.