BitCoin RSI TrendWhat is it?
This indicator will plot the RSI of BTC with a red or green background based on the top and bottom values which you can set.
How to use it?
For example, you want to trade only if the RSI of BTC is between 50 and 70, so the top value is 70 and bottom is 50. If the RSI value between those values the background will be green, else it will be red.
Why to use it?
The buy and sell strength of the BTC controls the other coins, and it is noticeable when the BTC is over sold and the RSI exceeding the 70, the price will reverse its movement to down, thus it is advisable to not open long position if the RSI of BTC is above the 70-75. Also, if the RSI is under 50 there is a big possibility to move down further to the over bought areas. The best is to buy a altcoins when the BTC RSI is between 50 and 70.
For example, I could avoid a bad long trade on MATICUSDT when the RSI of BTC is going under 50
Or, get a good long trade on MATICUSDT when the RSI of BTC is between 50 and 70
"北证50+股票+新浪财经" için komut dosyalarını ara

Combined Moving Averages + Squeeze & Volume Spike SignalsThis is a set of 4 combined moving averages. Each moving average is a combination of an EMA, SMA, HMA, RMA, WMA and VWMA with the same length as set in your input settings. All 6 of them are added together and then divided by 6 for an average of all of them. This is based on the theory that most traders use their own preference of moving averages, so combining them all should give us a better idea of where price should actually react since we are using the average of what most traders are using on their charts. It also smooths the moving averages out as well so you get a much easier to read moving average than any of them on their own which should help you hold positions longer and time your entries better.
The default lengths used for this indicator are as follows: 10, 50, 100 and 500. These lengths can be updated in the settings. The 10 and 500 will change colors when the individual moving average is less than or greater than its previous value. Price above or below the moving average does not affect the colors. The 50 and 100 are colored based on whether the 50 is greater/less than the 100.
The two middle length moving averages by default are the 50 and 100. This has been turned into a cloud because it is the area where price typically bounces, since tons of traders use the 50 and 100 moving averages. This should be your long/short zone when price is trending.
Each moving average can be set to use a different source such as close, open, high, low, ohlc4, etc. You can also adjust the length of each moving average. Default settings work well, but feel free to customize them to your liking. You can also change the colors of the lines in the settings.
Beware that changing the lengths of MA #2 and MA #3 will change the signals, squeezes and the cloud.
VOLUME SPIKES
The cloud will change to a brighter color when a volume spike is detected. When a major volume spike is detected, it will turn very bright colored green/red according to the direction of the cloud. This notifies you of volume spikes so you have a better idea of how strong the trend is. If the cloud is a dark green/red then that means that volume is less than or equal to the recent median volume.
SIGNALS
There are also signals that will be given when the current candle is in the cloud, the candle is going in the same direction as the cloud, the MA #2 and MA #3 is going in the same direction and a volume spike is detected. These help you identify good entries when markets are trending. Be cautious of these signals when the trend is sideways and not clearly moving in one direction. The signals can be turned on or off in the settings.
SQUEEZE
Many times when moving averages squeeze together, a big move happens shortly after. Because of this I added a yellow background color when a squeeze is detected. It looks at the median value difference of the MA #2 and MA #3 and if the current value difference is less than the median multiplied by the multiplier in the settings then it will change the background color to notify you. The default value of the multiplier is .6, meaning the squeeze signal will only show if the current value difference of the cloud is less than .6 of the median difference. The multiplier can be adjusted in the settings to suit your preferences. Lower values will only show tighter squeezes.
MARKETS
This indicator can be used on all markets including stocks, crypto, futures and forex.
TIMEFRAMES
This indicator can be used on all timeframes.
PAIRINGS
We recommend pairing this combined moving average with Trend Friend Swing Trade And Scalp Signals for extra confluence. Look for price to bounce in the cloud with good volume and a confirming signal from Trend Friend for highly probable moves.
RSI Trend Heatmap in Multi TimeframesRSI Trend Heatmap in Multi Timeframes
Description
Sometimes you want to look at the RSI Trend across multiple time frames.
You have to waste time browsing through them.
So we've put together every time frame you want to see in one indicator.
We have 10 layers of RSI Trend heatmap available for you.
You can set the timeframe as you want on the Settings page.
Description of Parameter RSI Setting ** You can change it by setting.
RSI Trend Length : (Default 50)
Source : (Default close)
RSI Sideways Length : (Default 2 = RSI between 48 .. 52)
Description of Parameter RSI Timeframe ** You can change it by setting.
""=None,
"M"=1Month, "2W"=2Weeks, "W"=1Week,
"3D"=3Days, "2D"=2Days, "D"=1Day,
"720"=12Hours, "480"=4Hours, "240"=4Hours, "180"=3Hours, "120"=2Hours,
"60"=60Minutes, "30"=30Minutes, "15"=15Minutes, "5"=5Minutes, "1"=1Minute
Default Configurate of RSI Timeframe (for a time frame of 1 hour to 1 day)
"W"= Timeframe 1 month shown in line 90-100 --> Represent Long Trend of RSI
---------------------------------------
"D2"= Timeframe 2 days shown in line 70-80 --> Represent Trend of RSI
"D"= Timeframe 1 day shown in line 60-70 --> Represent Trend of RSI
---------------------------------------
"240"= Timeframe 3 hours shown in line 40-50 --> Represent Signal Up/Signal Down/Divergence of RSI
"120"= Timeframe 2 hours shown in line 30-40 --> Represent Signal Up/Signal Down/Divergence of RSI
"60"= Timeframe 1 hour shown in line 20-30 --> Represent Signal Up/Signal Down/Divergence of RSI
"30"= Timeframe 30 minutes shown in line 10-20 --> Represent Signal Up/Signal Down/Divergence of RSI
"15"= Timeframe 15 minutes shown in line 00-10 --> Represent Signal Up/Signal Down/Divergence of RSI
Description of Colors
Dark Bule = Extreme Uptrend / Overbought / Bull Market (RSI > 67)
Light Bule = Uptrend (RSI between 50-52 .. 67)
Yellow = Sideways Trend / Trend Reversal (RSI between 48 .. 52) ** You can change it by setting.
Light Red = Downtrend (RSI between 33 .. 48-50)
Dark Red = Extreme Downtrend / Oversold / Bear Market (RSI < 33)
How to use
1. You must first know what the main trend of the RSI is (look at the 60-80 line). If it is red, it is a downtrend. and if it's blue shows that it is an uptrend
2. Throughout the period of the main trend There will always be a reversal of the sub-trend. (Can see from the 0-50 line), but eventually will return to follow the main trend.
3. Unless the sub trend persists for a long time until the main trend changes.

Multiple Indicator 50EMA Cross AlertsHere’s a screener including Symbol, Price, TSI, and 50 ema cross in a table output.
The 50 Exponential Moving Average is a trend indicator
You can find bullish momentum when the 50 ema crossed over or a bearish momentum when the 50 ema crossed under we are looking to take advantage by trading the reversion of these trends.
True strength index (TSI) is a trend momentum indicator
Readings are bullish when the True Strength Index shows positive values
Readings are bearish when the indicator displays negative values.
When a value is above 20, we look for selling overbought opportunity and when the value is under 20, we look for buying oversold opportunity.
You can select the pair of your choice in the settings.
Make sure to create an alert and choose any alerts then an alert will trigger when a price cross under or cross over the 50 ema for every pair separately.
This allow the user to verify if there is a trade set up or not.
Disclaimer
This post and the script don’t provide any financial advice.

ROC PercentileRate Of Change Percentile calculates the current ROC (user defined length) as a percentile rank.
We use 2 separate arrays, one for all positive ROC values and one for all negative values within a defined lookback period. Then the current ROC value is compared to those arrays to find it's percentile ranking.
For example, a ranking of 75 means the ROC is in the 75th percentile of all POSITIVE ROC values over the lookback period.
A ranking of -80 is in the 80th percentile of all NEGATIVE ROC values over the lookback period.
Most ROC scripts use raw ROC values (or smoothed or otherwise altered), or have stochastic formula applied to them, I've not seen one that displays ROC as percentile ranking of previous positive/negative values.
What is the advantage?
Raw ROC data only gives half the picture. What we want to do is compare the ROC to previous ROC values, to give a sense of scale. Raw ROC values don't give you that context and you can only compare visually, usually limited to the number of bars you can see on your screen.
Using a percentile ranking gives us the context of current Rate of Change relative to the previous Rate of Change over a large lookback period, and not just visually but mathematically.
Why not using a long stochastic ROC? The problem with stochastics in general is that an outlier data point can ruin the data for the rest of the lookback period.
For example, imagine a huge outlier 8% ROC. The 2nd largest ROC is 4% and the 3rd largest is 2%, with all other values below this.
In this example, a stochastic ROC would display the 8% outlier as 100, the 4% as 50, the 2% as 25 and all other data would be squeezed down between 0-25.
Additionally, a value of 60 may have vastly different meaning depending on whether the lookback period contains a large outlier or not.
With a percentile ranking, that 8% outlier would still have a value of 100. But the 4% and 2% would be 99 and 98 respectively (this assumes 100 data points in the series, in reality values will usually be decimals).
This effectively flattens the curve and gives a more consistent and dependable experience, allowing you to more accurately assess the relative importance of the current ROC.
The line of circles is set at the 50 and -50 values for quick comparison.
Values > 50 represent ROC greater than 50% of previous positive ROC values.
Values < -50 represent ROC greater than 50% of previous negative ROC values.

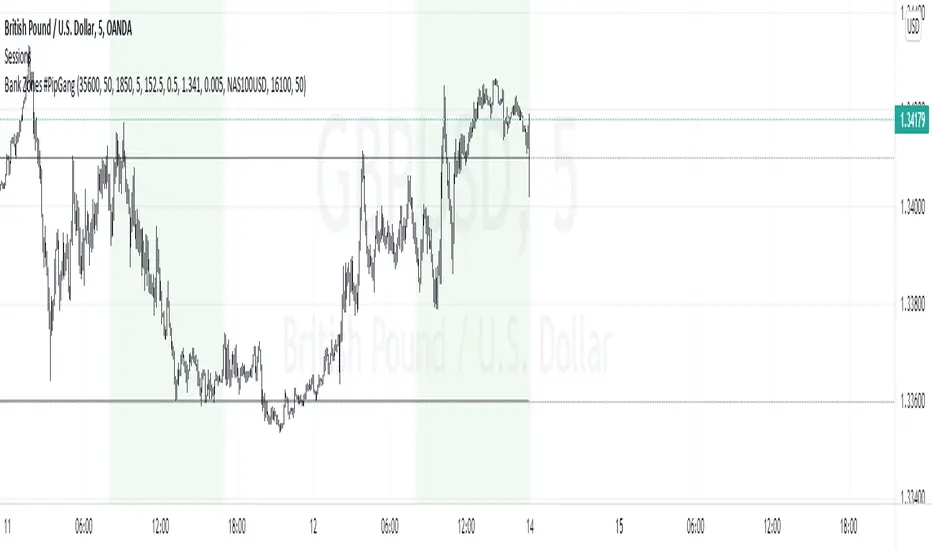
Bank Zones #PipGangHello Traders,
If you trade Forex and Indices this indicator will help you identify Buying and Selling levels that Banks are interested in. These levels are displayed on all time frames. Colors of the lines can be customized.
I also added code to show two EMA's, just uncomment the code to show them. :-)
How to use this indicator.
Show Bank Zones - this will enable/disable horizonal lines on the chart.
Price - enter bank zone price.
Increment By - plots three horizonal lines in pips above and below bank zone price.
Note: Decimal placement is KEY, this may vary by symbol.
Sample Settings:
US30USD
Price 35600.0
IncrementBy 50 (equals 50 pips)
XAUUSD
Price 1850.000
IncrementBy 5 (equals 50 pips)
GBPJPY
Price 152.500
IncrementBy .5 (equals 50 pips)
GBPUSD
Price 1.34100
IncrementBy .005 (equals 50 pips)
Forex scalper 2xEMA + SRSI + MACDThis is a forex scalping strategy designed for the most liquid pairs, like major forex pairs.
Its made of
1 EMA 50
1 EMA 100
Stochastic RSI
MACD
Rules
For long :close of the candle is above moving average 50, moving average 50> moving average 100, macd histogram is positive and cross over of stochastic rsi with the oversold level.
For short :close of the candle is below moving average 50, moving average 50 < moving average 100, macd histogram is negative and cross under of stochastic rsi with the overbought level.
Exit
For exit we have take profit and stop loss using fixed pip points.
For this example on EURUSD we use 20 pips for both tp and sl
IF you have any questions let me know !

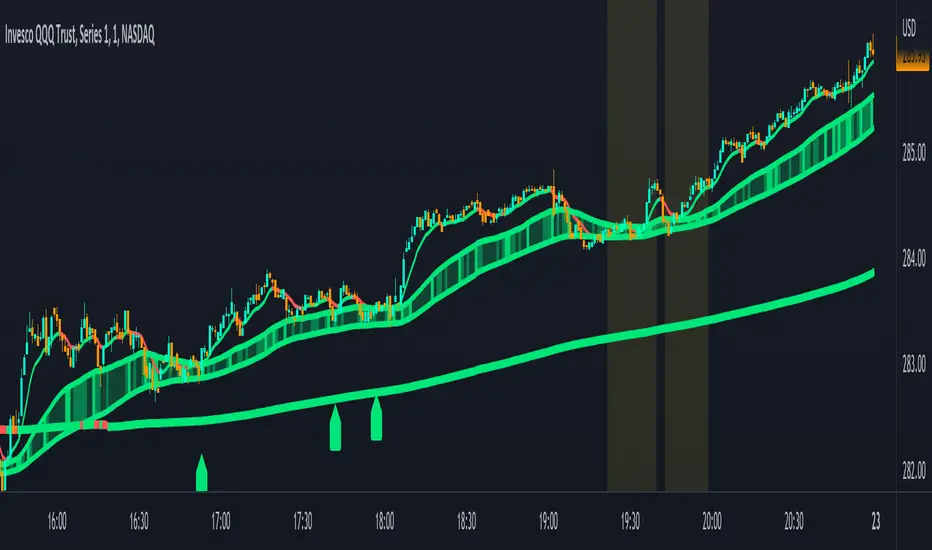
EBB & Flow: a multi-EMA-based BB cloudIntro
This is an idea evolved out of the market maker method and EMA convergence, divergence, and mean reversion.
The market maker method informs us that the 5, 13, 50 and 200 EMAs are important to regulating price. Those EMA lengths are multiples of the 50 and 200 on lower major timeframes -- the 1 minute, 5, 15, 1H, 4H, 1D. I include the 21 because it is also a multiple and in crypto very often respected.
When market makers are testing price, they set their range and spike in the direction they test for liquidity. This can get chaotic. For instance, in a shorter time frame consolidation inside a bigger timeframe uptrend, it can be too easy to forget where you are in the many trends playing out.
When the EMAs are dragged over each other during normal price movement, you get these crisscrossing tracks of price, and the individual breaks can be hard to trace.
The range is what matters, ultimately, and the range is dynamic. In that case, the Bollinger Band is a great tool for detecting outliers in this case.
The Answer
So the answer this indicator seeks to give, is to look for outliers. This gives you a scalping strategy built on Traders Reality thinking and best put together with the PVSRA indicator, which I may include in this indicator just for the sake of concision, but they can work alongside each other or separately.
The key thing is the different EMA clouds, which are bollinger bands. Tight bands mean imminent breaks, favouring the trend. Vector candles out of a zone, pins to the low/high, etc. are all very relevant alongside this indicator.
You can also use it on its own and scalp the breaks of a cloud.
How it works
Each cloud is a standard deviation from their respective EMA, all in the same colour. The deviation multiple is 1.618 by default. Yes, fibonacci sequences are usually nonsense, but it works better with the BB than 2, 2.5 or 3.
Using just the clouds, you can see where each EMA is headed and how it behaves within the deviation of the others.
But that on its own isn't enough.
The indicator will also print snowflakes above and below the candle for notable outliers. It will be in the colour of the cloud it breaks, but only if that break is also breaking the smaller EMA clouds too.
The most snowflakes will be yellow because that's the 13 EMA. That one is dependent on nothing else and every break will print a snowflake. The 21 will be dependent on the 13. The 50 dependent on the 13 and 21 breaks. The 200 the most important.
For example, if the 200 EMA-BB or EBB is broken at the upper band, deviating by more than 162% of price over a 200 period EMA, and that break is not above the 50 EMA cloud, there will be no snowflake. However, if it exceeds the 13, 21, 50, and 200 clouds, then a purple snowflake will appear above the bar.
Any snowflake is an extreme in price. The purple is an especially good point of entry. That doesn't mean it is a perfect entry. You can build position from it, though, and be relatively certain of a price correction in the near future, because not only was this major EMA cloud violated, but all of the smaller ones too.
Reminder
You still need your PVSRA and candlesticks. This indicator on its own may have a nice hit rate for scalping and building position, as an alternative to the TDI or alongside it, but it is not enough on its own, just like the TDI.
Enjoy!

Quantitative Qualitative Estimation QQE
The QQE indicator is a momentum based indicator to determine trend and sideways.
The Qualitative Quantitative Estimation (QQE) indicator works like a smoother version of the popular Relative Strength Index (RSI) indicator. QQE expands on RSI by adding two volatility based trailing stop lines. These trailing stop lines are composed of a fast and a slow moving Average True Range (ATR). These ATR lines are smoothed making this indicator less susceptible to short term volatility.
The most common method of using QQE is to look for crosses of the fast and slow moving trailing stop lines during periods when the QQE line reflects overbought or oversold conditions
Qualitative Quantitative Estimation made up of a smoothed Relative Strength Index (RSI) indicator plus fast and slow volatility-based trailing levels.
Qualitative Quantitative Estimation can be used in two directions:
1.Determine the trend, i.e. if the line is above the 50 level, the trend is ascending, if below - descending;
2.Search for signals at the moment of crossing of the QQE FAST (maroon) and QQE SLOW (blue) lines.
The QQE itself is generally considered to indicate an up-trend ifQQE FAST is above QQE SLOW, and a down-trend if below QQE SLOW.
Often a middle-range between 40 and 60 is set and if the indicator is in that range, then the market is considered to be tracking sideways, or in no trend.
You will need to set only one parameter – “SF” "RSI SMoothing Factor", an analogue of the period in RSI.
By the way, judging from the open source information, the algorithm used the standard strength index with a period of 14 for calculations.
Various signals can be created from the indicator such as:
-Buy when QQE FAST crosses above QQE SLOW below 50 level or just buy when QQE lines crosses above 50 level.
-Sell when QQE FAST crosses below QQE SLOW above 50 level or just sell when QQE lines crosses below 50 level.
WARNING: QQE IS A RSI BASED INDICATOR SO THAT IT CAN TRIGGER FALSE SIGNALS DURING DIVERGENCES!
Kıvanç Özbilgiç

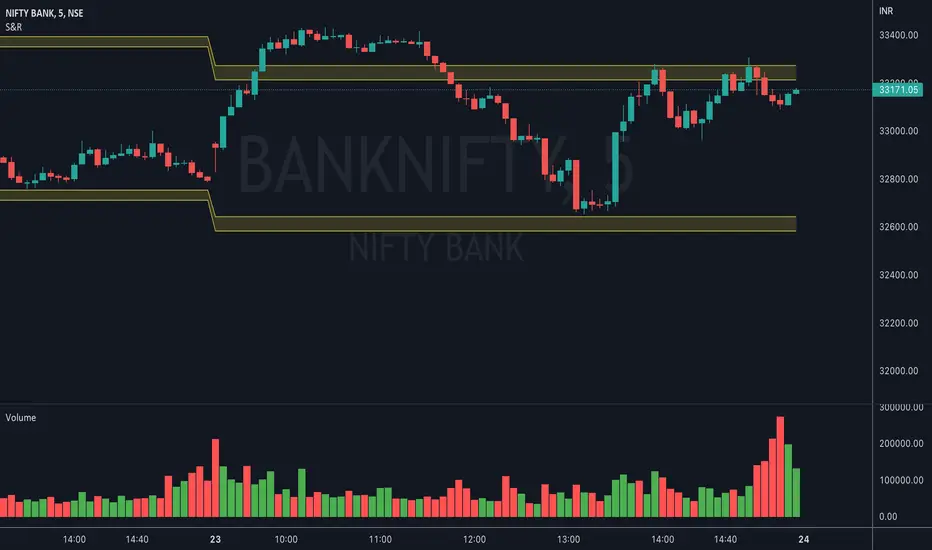
Nifty VolumeWhy this Script : Nifty 50 does not provide volume and some time it is really useful to understand the volume .
This is the pine script which calculate the nifty 50 volume .
Logic :
Take each stock contribute to nifty 50 and find it's volume .
Multiply the same with contribution percentage of the same on Nifty 50
Add up all of them and find the total volume .
There is a similar script by @daytraderph which is built for Bank Nifty (custom volume) . I took the same and built for Nfity.
Nifty has 50 stocks and you cant call security method more than 40 times from one Pine script, so this is the limitation of this script. It consider top 40 stocks and find the volume (which contribute pretty much around 95% of the volume) and convert the same to 100 %
Simple Moving Average Double HelixThis one is a mix of colour-coded moving averages and Ichimoku. It features two pairs of SMAs--default values of 9/20 and 50/200. Each SMA will be green when it rises and red when it falls. The spaces between each pair will fill with green or red depending on which line is on top. 9 over 20 or 50 over 200 makes a green cloud; if 9 or 50 falls below, the cloud will switch to green.
There's also the Ichimoku lagging span and a 35-period SMA (grey) that can be used as a trailing stop loss guideline.
Ideal long setup:
9, 20, 50, and 200 SMA are all green
both clouds are green
lagging span is above historic price action
Ideal short setup:
9, 20, 50, and 200 SMA are all red
both clouds are red
lagging span is below historic price action

RSI5_50 with DivergenceThis is variation of RSI Divergence strategy.
I have added a filter (long term RSI) to the Rules. strategy BUYs when RSI 50 period is above 50 line and there is divergence on the short term RSI
settings
=========
short term RSI period 5
long term RSI period 50
stopLoss is 8% --- if setting is enabled
BUY Rule
========
RSI 50 is above 50 line
short term RSI is showing divergence
Add to existing
==============
if already in position, BUY when shorTermRSI is crossing above 20
TakeProfit
=========
when longTermRSI reaches 60,65, 70 and 75 level , take partial profits .
(not when crossing down --- This may affect on profits , because when price goes down , it goes very fast )
Exit
=====
when longTermRSI is crossing down 30
OR stopLoss value hits
Note: When I tested this with GOOGL stock , I have got excellent results ... any experts there , please check everything is good with scripting ...
Happy Trading

PowerX Strategy Bar Coloring [OFFICIAL VERSION]This script colors the bars according to the PowerX Strategy by Markus Heitkoetter:
The PowerX Strategy uses 3 indicators:
- RSI (7)
- Stochastics (14, 3, 3)
- MACD (12, 26 , 9)
The bars are colored GREEN if...
1.) The RSI (7) is above 50 AND
2.) The Stochastic (14, 3, 3) is above 50 AND
3.) The MACD (12, 26, 9) is above its Moving Average, i.e. MACD Histogram is positive.
The bars are colored RED if...
1.) The RSI (7) is below 50 AND
2.) The Stochastic (14, 3, 3) is below 50 AND
3.) The MACD (12, 26, 9) is below its Moving Average, i.e. MACD Histogram is negative.
If only 2 of these 3 conditions are met, then the bars are black (default color)
We highly recommend plotting the indicators mentioned above on your chart, too, so that you can see when bars are getting close to being "RED" or "GREEN", e.g. RSI is getting close to the 50 line.

BO - Bar's direction Signal - BacktestingBO - Bar's direction Signal - Backtesting Options:
A. Factors Calculate probability of x bars same direction
1. Periods Counting: Data to count From day/month/year To day/month/year
2. Trading Time: only cases occurred in trading time were counted.
B. Timezone
1. Trading time depend on Time zone and specified chart.
2. Enable Highlight Trading Time to check your period time is correct
C. Date Backtesting
* Only cases occurred in Date Backtesting were reported.
D. Setup Options & Rule
1. Reversal after 2 bars same direction
* Probability of 3 bars same direction < 50
* 2 bars same direction is start of series
2. Reversal after 3 bars same direction
* Probability of 4 bars same direction < 50
* 3 bars same direction is start of series
3. Reversal after 4 bars same direction
* Probability of 4 bars same direction < 50
* 3 bars same direction is start of series
4. Reversal after 5 bars same direction
* Probability of 5 bars same direction < 50
* 4 bars same direction is start of series
5. Reversal after 6 bars same direction
* Probability of 6 bars same direction < 50
* 5 bars same direction is start of series

Technical Analysis - Panel Info//A. Oscillators & B. Moving Averages base on TradingView's Technical Analysis by ThiagoSchmitz
//C.Pivot base on Ultimate Pivot Points Alerts by elbartt
//D. Summary & Panel info by anhnguyen14
Panel Info base on these indicators:
A. Oscillators
1. Rsi (14)
2. Stochastic (14,3,3)
3. CCI (20)
4. ADX (14)
5. AO
6. Momentum (10)
7. MACD (12,26)
8. Stoch RSI (3,3,14,14)
9. %R (14)
10. Bull bear
11. UO (7,14,28)
B. Moving Averages
1. SMA & EMA: 5-10-20-30-50-100-200
2. Ichimoku Cloud - Baseline (26)
3. Hull MA (9)
C. Pivot
1. Traditional
2. Fibonacci
3. Woodie
4. Camarilla
D. Summary
Sum_red=A_red+B_red+C_red
Sum_blue=A_blue+B_blue+C_blue
sell_point=(Sum_red/32)*100
buy_point=(Sum_blue/32)*100
sell =
Sum_red>Sum_blue
and sell_point>50
Strong_sell =
A_red>A_blue
and B_red>B_blue
and C_red>C_blue
and sell_point>50
and not crossunder(sell_point,75)
buy =
Sum_red>Sum_blue
and buy_point>50
Strong_buy =
A_red50
and not crossunder(buy_point,75)
neutral = not sell and not Strong_sell and not buy and not Strong_buy

Multi SMA EMA WMA HMA BB (5x8 MAs Bollinger Bands) MAX MTF - RRBMulti SMA EMA WMA HMA 4x7 Moving Averages with Bollinger Bands MAX MTF by RagingRocketBull 2019
Version 1.0
All available MAX MTF versions are listed below (They are very similar and I don't want to publish them as separate indicators):
ver 1.0: 4x7 = 28 MTF MAs + 28 Levels + 3 BB = 59 < 64
ver 2.0: 5x6 = 30 MTF MAs + 30 Levels + 3 BB = 63 < 64
ver 3.0: 3x10 = 30 MTF MAs + 30 Levels + 3 BB = 63 < 64
ver 4.0: 5(4+1)x8 = 8 CurTF MAs + 32 MTF MAs + 20 Levels + 3 BB = 63 < 64
ver 5.0: 6(5+1)x6 = 6 CurTF MAs + 30 MTF MAs + 24 Levels + 3 BB = 63 < 64
ver 6.0: 4(3+1)x10 = 10 CurTF MAs + 30 MTF MAs + 20 Levels + 3 BB = 63 < 64
Fib numbers: 8, 13, 21, 34, 55, 89, 144, 233, 377
This indicator shows multiple MAs of any type SMA EMA WMA HMA etc with BB and MTF support, can show MAs as dynamically moving levels.
There are 4 MA groups + 1 BB group, a total of 4 TFs * 7 MAs = 28 MAs. You can assign any type/timeframe combo to a group, for example:
- EMAs 9,12,26,50,100,200,400 x H1, H4, D1, W1 (4 TFs x 7 MAs x 1 type)
- EMAs 8,13,21,30,34,50,55,89,100,144,200,233,377,400 x M15, H1 (2 TFs x 14 MAs x 1 type)
- D1 EMAs and SMAs 8,13,21,30,34,50,55,89,100,144,200,233,377,400 (1 TF x 14 MAs x 2 types)
- H1 WMAs 13,21,34,55,89,144,233; H4 HMAs 9,12,26,50,100,200,400; D1 EMAs 12,26,89,144,169,233,377; W1 SMAs 9,12,26,50,100,200,400 (4 TFs x 7 MAs x 4 types)
- +1 extra MA type/timeframe for BB
There are several versions: Simple, MTF, Pro MTF, Advanced MTF, MAX MTF and Ultimate MTF. This is the MAX MTF version. The Differences are listed below. All versions have BB
- Simple: you have 2 groups of MAs that can be assigned any type (5+5)
- MTF: +2 custom Timeframes for each group (2x5 MTF) +1 TF for BB, TF XY smoothing
- Pro MTF: 4 custom Timeframes for each group (4x3 MTF), 1 TF for BB, MA levels and show max bars back options
- Advanced MTF: +4 extra MAs/group (4x7 MTF), custom Ticker/Symbols, Timeframe <>= filter, Remove Duplicates Option
- MAX MTF: +2 subtypes/group, packed to the limit with max possible MAs/TFs: 4x7, 5x6, 3x10, 4(3+1)x10, 5(4+1)x8, 6(5+1)x6
- Ultimate MTF: +individual settings for each MA, custom Ticker/Symbols
MAX MTF version tests the limits of Pinescript trying to squeeze as many MAs/TFs as possible into a single indicator.
It's basically a maxed out Advanced version with subtypes allowing for mixed types within a group (i.e. both emas and smas in a single group/TF)
Pinescript has the following limits:
- max 40 security calls (6 calls are reserved for dupe checks and smoothing, 2 are used for BB, so only 32 calls are available)
- max 64 plot outputs (BB uses 3 outputs, so only 61 plot outputs are available)
- max 50000 (50kb) size of the compiled code
Based on those limits, you can only have the following MAs/TFs combos in a single script:
1. 4x7, 5x6, 3x10 - total number of MTF MAs must always be <= 32, and you can still have BB and Num Levels = total MAs, without any compromises
2. 5(4+1)x8, 6(5+1)x6, 4(3+1)x10 - you can use the Current Symbol/Timeframe as an extra (+1) fixed TF with the same number of MTF MAs
- you don't need to call security to display MAs on the Current Symbol/Timeframe, so the total number of MTF MAs remains the same and is still <= 32
- to fit that many MAs into the max 64 plot outputs limit you need to reduce the number of levels (not every MA Group will have corresponding levels)
Features:
- 4x7 = 28 MAs of any type
- 4x MTF groups with XY step line smoothing
- +1 extra TF/type for BB MAs
- 2 MA subtypes within each group/TF
- 4x7 = 28 MA levels with adjustable group offsets, indents and shift
- supports any existing type of MA: SMA, EMA, WMA, Hull Moving Average (HMA)
- custom tickers/symbols for each group
- show max bars back option
- show/hide both groups of MAs/levels/BB and individual MAs
- timeframe filter: show only MAs/Levels with TFs <>= Current TF
- hide MAs/Levels with duplicate TFs
- support for custom TFs that are not available in free accounts: 2D, 3D etc
- support for timeframes in H: H, 2H, 4H etc
Notes:
- Uses timeframe textbox instead of input resolution dropdown to allow for 240 120 and other custom TFs
- Uses symbol textbox instead of input symbol to avoid establishing multiple dummy security connections to the current ticker - otherwise empty symbols will prevent script from running
- Possible reasons for missing MAs on a chart:
- there may not be enough bars in history to start plotting it. For example, W1 EMA200 needs at least 200 bars on a weekly chart.
- for charts with low/fractional prices i.e. 0.00002 << 0.001 (default Y smoothing step) decrease Y smoothing as needed (set Y = 0.0000001) or disable it completely (set X,Y to 0,0)
- for charts with high price values i.e. 20000 >> 0.001 increase Y smoothing as needed (set Y = 10-20). Higher values exceeding MAs point density will cause it to disappear as there will be no points to plot. Different TFs may require diff adjustments
- TradingView Replay Mode UI and Pinescript security calls are limited to TFs >= D (D,2D,W,MN...) for free accounts
- attempting to plot any TF < D1 in Replay Mode will only result in straight lines, but all TFs will work properly in history and real-time modes. This is not a bug.
- Max Bars Back (num_bars) is limited to 5000 for free accounts (10000 for paid), will show error when exceeded. To plot on all available history set to 0 (default)
- Slow load/redraw times. This indicator becomes slower, its UI less responsive when:
- Pinescript Node.js graphics library is too slow and inefficient at plotting bars/objects in a browser window. Code optimization doesn't help much - the graphics engine is the main reason for general slowness.
- the chart has a long history (10000+ bars) in a browser's cache (you have scrolled back a couple of screens in a max zoom mode).
- Reload the page/Load a fresh chart and then apply the indicator or
- Switch to another Timeframe (old TF history will still remain in cache and that TF will be slow)
- in max possible zoom mode around 4500 bars can fit on 1 screen - this also slows down responsiveness. Reset Zoom level
- initial load and redraw times after a param change in UI also depend on TF. For example: D1/W1 - 2 sec, H1/H4 - 5-6 sec, M30 - 10 sec, M15/M5 - 4 sec, M1 - 5 sec. M30 usually has the longest history (up to 16000 bars) and W1 - the shortest (1000 bars).
- when indicator uses more MAs (plots) and timeframes it will redraw slower. Seems that up to 5 Timeframes is acceptable, but 6+ Timeframes can become very slow.
- show_last=last_bars plot limit doesn't affect load/redraw times, so it was removed from MA plot
- Max Bars Back (num_bars) default/custom set UI value doesn't seem to affect load/redraw times
- In max zoom mode all dynamic levels disappear (they behave like text)
- Dupe check includes symbol: symbol, tf, both subtypes - all must match for a duplicate group
- For the dupe check to work correctly a custom symbol must always include an exchange prefix. BB is not checked for dupes
Good Luck! Feel free to learn from/reuse the code to build your own indicators.

Multi SMA EMA WMA HMA BB (4x5 MAs Bollinger Bands) Adv MTF - RRBMulti SMA EMA WMA HMA 4x5 Moving Averages with Bollinger Bands Advanced MTF by RagingRocketBull 2019
Version 1.0
This indicator shows multiple MAs of any type SMA EMA WMA HMA etc with BB and MTF support, can show MAs as dynamically moving levels.
There are 4 MA groups + 1 BB group, a total of 4 TFs * 5 MAs = 20 MAs. You can assign any type/timeframe combo to a group, for example:
- EMAs 12,26,50,100,200 x H1, H4, D1, W1 (4 TFs x 5 MAs x 1 type)
- EMAs 8,10,13,21,30,50,55,100,200,400 x M15, H1 (2 TFs x 10 MAs x 1 type)
- D1 EMAs and SMAs 8,10,12,26,30,50,55,100,200,400 (1 TF x 10 MAs x 2 types)
- H1 WMAs 7,77,89,167,231; H4 HMAs 12,26,50,100,200; D1 EMAs 89,144,169,233,377; W1 SMAs 12,26,50,100,200 (4 TFs x 5 MAs x 4 types)
- +1 extra MA type/timeframe for BB
There are several versions: Simple, MTF, Pro MTF, Advanced MTF and Ultimate MTF. This is the Advanced MTF version. The Differences are listed below. All versions have BB
- Simple: you have 2 groups of MAs that can be assigned any type (5+5)
- MTF: +2 custom Timeframes for each group (2x5 MTF) +1 TF for BB, TF XY smoothing
- Pro MTF: 4 custom Timeframes for each group (4x3 MTF), 1 TF for BB, MA levels and show max bars back options
- Advanced MTF: +2 extra MAs/group (4x5 MTF), custom Ticker/Symbols, Timeframe <>= filter, Remove Duplicates Option
- Ultimate MTF: +individual settings for each MA, custom Ticker/Symbols
Features:
- 4x5 = 20 MAs of any type
- 4x MTF groups with XY step line smoothing
- +1 extra TF/type for BB MAs
- 4x5 = 20 MA levels with adjustable group offsets, indents and shift
- supports any existing type of MA: SMA, EMA, WMA, Hull Moving Average (HMA)
- custom tickers/symbols for each group - you can compare MAs of the same symbol across exchanges
- show max bars back option
- show/hide both groups of MAs/levels/BB and individual MAs
- timeframe filter: show only MAs/Levels with TFs <>= Current TF
- hide MAs/Levels with duplicate TFs
- support for custom TFs that are not available in free accounts: 2D, 3D etc
- support for timeframes in H: H, 2H, 4H etc
Notes:
- Uses timeframe textbox instead of input resolution dropdown to allow for 240 120 and other custom TFs
- Uses symbol textbox instead of input symbol to avoid establishing multiple dummy security connections to the current ticker - otherwise empty symbols will prevent script from running
- Possible reasons for missing MAs on a chart:
- there may not be enough bars in history to start plotting it. For example, W1 EMA200 needs at least 200 bars on a weekly chart.
- price << default Y smoothing step 5. For charts with low/fractional prices (i.e. 0.00002 << 5) adjust X Y smoothing as needed (set Y = 0.0000001) or disable it completely (set X,Y to 0,0)
- TradingView Replay Mode UI and Pinescript security calls are limited to TFs >= D (D,2D,W,MN...) for free accounts
- attempting to plot any TF < D1 in Replay Mode will only result in straight lines, but all TFs will work properly in history and real-time modes. This is not a bug.
- Max Bars Back (num_bars) is limited to 5000 for free accounts (10000 for paid), will show error when exceeded. To plot on all available history set to 0 (default)
- Slow load/redraw times. This indicator becomes slower, its UI less responsive when:
- Pinescript Node.js graphics library is too slow and inefficient at plotting bars/objects in a browser window. Code optimization doesn't help much - the graphics engine is the main reason for general slowness.
- the chart has a long history (10000+ bars) in a browser's cache (you have scrolled back a couple of screens in a max zoom mode).
- Reload the page/Load a fresh chart and then apply the indicator or
- Switch to another Timeframe (old TF history will still remain in cache and that TF will be slow)
- in max possible zoom mode around 4500 bars can fit on 1 screen - this also slows down responsiveness. Reset Zoom level
- initial load and redraw times after a param change in UI also depend on TF. For example:
D1/W1 - 2 sec, H1/H4 - 5-6 sec, M30 - 10 sec, M15/M5 - 4 sec, M1 - 5 sec.
M30 usually has the longest history (up to 16000 bars) and W1 - the shortest (1000 bars).
- when indicator uses more MAs (plots) and timeframes it will redraw slower. Seems that up to 5 Timeframes is acceptable, but 6+ Timeframes can become very slow.
- show_last=last_bars plot limit doesn't affect load/redraw times, so it was removed from MA plot
- Max Bars Back (num_bars) default/custom set UI value doesn't seem to affect load/redraw times
- In max zoom mode all dynamic levels disappear (they behave like text)
1. based on 3EmaBB, uses plot*, barssince and security functions
2. you can't set certain constants from input due to Pinescript limitations - change the code as needed, recompile and use as a private version
3. Levels = trackprice implementation
4. Show Max Bars Back = show_last implementation
5. swma has a fixed length = 4, alma and linreg have additional offset and smoothing params
6. Smoothing is applied by default for visual aesthetics on MTF. To use exact ma mtf values (lines with stair stepping) - disable it
Good Luck! You can explore, modify/reuse the code to build your own indicators.

BB Quick Fire5 Bollinger Bands in levels 50,2.0 | 50,2.5 |50,3.0 |50,3.5 |50,4.0
This is used to identify pullbakcs and future pitchfork's.

CM Stochastic POP Method 2-Jake Bernstein_V1Yesterday Jake Bernstein authorized me to post his updated results with the Stochastic Pop Trading System he developed many years ago.
You can take a look at the Original System with Updated Settings at
This indicator is a different set of rules Jake mentioned in the PDF he allowed me to post.
To view the PDF use this link:
dl.dropboxusercontent.com
Today we’re releasing the version described in the PDF that uses the StochK values of 55, 50, and 45. The rules are discussed in the PDF but here is a simple breakdown:
Enter Long when StochK is below 50 and Crosses Above 55
Exit Long on Cross Below 55
Enter Short when StochK is Above 50 and crosses Below 45
Exit Short on Cross Above 45
Two Important Items to understand about this method:
To code the rules Precisely we need a function that will be available when Strategy Capabilities are released on TradingView.
There is one of Jakes Profit Maximizing Strategies that needs to be integrated with this code…which again we need the Strategy based Function that will be coming soon.
To Compare this system to the Stochastic Pop Method 1 System shown yesterday at I used the same Symbol and dates for you to compare…but remember to give this Method 2 System a Fair Look/Evaluation…we need the Soon To Be Released…TradingView Strategy Capabilities.
BackTesting Results Example: EUR-USD Daily Chart Since 01/01/2005
Strategy 1 – Stochastic Pop Method 2 System:
Go Long When Stochasticis below 50 and Crosses Above 55. Go Short When Stochastic is above 50 and Crosses Below 45. Exit Long/Short When Stochastic has a Reverse Cross of Entry Value.
Results:
Total Trades = 151
Profit = 40,758 Pips
Win% = 37.1%
Profit Factor = 1.26
Avg Trade = 270 Pips Profit
***Most Consecutive Wins = 4 ... Most Consecutive Losses = 7
Strategy 2:
Rules - Proprietary Optimization Jake Will Teach. Only Added 1 Additional Exit Rule.
Results:
Total Trades = 151
Profit = 60.305 Pips
Win% = 37.1%
Profit Factor = 1.38
Avg Trade = 399 Pips Profit
***Most Consecutive Wins = 4 ... Most Consecutive Losses = 7
Indicator Includes:
-Ability to Color Candles (CheckBox In Inputs Tab)
Green = Long Trade
Blue = No Trade
Red = Short Trade
Jake Bernstein will be a contributor on TradingView when Backtesting/Strategies are released. Jake is one of the Top Trading System Developers in the world with 45+ years experience and he is going to teach TradingView.com’s community how to create Trading Systems and how to Optimize the correct way.
Link To PDF:
dl.dropboxusercontent.com
Link to Original Version of Indicator with Updated Settings.

SHAP-Aligned BUY Signal (Daily, Edge-Triggered)Based on the XGBoost + SHAP interpretation report, I'll explain which indicators to monitor for buying NVO. However, I must emphasize that this model performed poorly (47.5% accuracy) and should NOT be used for actual trading! That said, here's what the model learned (for educational purposes):
📊 Top Indicators to Monitor for BUY Signals
1. Days_Since_Low (Most Important - 1.264)
Direction: BULLISH ↑
Interpretation: Higher values → UP prediction
What to monitor: Track how many days since the stock hit its recent low
Buy signal: When the stock has been recovering for an extended period (e.g., 100+ days from low)
Why it matters: The model learned that stocks in long-term recovery tend to continue rising
2. SMA_50 (50-day Moving Average) (0.413)
Direction: BULLISH ↑
Interpretation: Higher absolute SMA_50 values → UP prediction
What to monitor: The 50-day simple moving average price level
Buy signal: When SMA_50 is at higher levels (e.g., above $80-90)
Why it matters: Higher moving averages indicate stronger long-term trends
3. SMA_200 (200-day Moving Average) (0.274)
Direction: BULLISH ↑
Interpretation: Higher SMA_200 → UP prediction
What to monitor: The 200-day simple moving average
Buy signal: When SMA_200 is trending upward and at elevated levels
Why it matters: Long-term trend indicator; golden cross (SMA_50 > SMA_200) is traditionally bullish
4. BB_Width (Bollinger Band Width) (0.199)
Direction: BULLISH ↑
Interpretation: WIDER Bollinger Bands → UP prediction
What to monitor: The distance between upper and lower Bollinger Bands
Buy signal: When BB_Width is expanding (increasing volatility often precedes trend moves)
Why it matters: Widening bands can signal the start of a new trend
5. Price_SMA_50_Ratio (0.158)
Direction: BULLISH ↑
Interpretation: When price is ABOVE the 50-day MA → UP prediction
What to monitor: Current price ÷ SMA_50
Buy signal: When ratio > 1.0 (price is above the 50-day average)
Why it matters: Price above moving averages indicates uptrend
6. Momentum_21D (21-day Momentum) (0.152)
Direction: BULLISH ↑
Interpretation: Positive 21-day momentum → UP prediction
What to monitor: 21-day rate of change
Buy signal: When momentum is positive and increasing
Why it matters: Positive momentum suggests continuation
7. Stoch_K (Stochastic Oscillator) (0.142)
Direction: BULLISH ↑
Interpretation: Higher Stochastic K → UP prediction
What to monitor: Stochastic oscillator (0-100 scale)
Buy signal: When Stoch_K is rising from oversold (<20) or in mid-range (40-60)
Why it matters: Measures momentum and overbought/oversold conditions

Hybrid Trend-Following Inside Bar BreakoutHybrid Trend-Following Inside Bar Breakout Strategy
The Hybrid Trend-Following Inside Bar Breakout Strategy is a rule-based trading system designed to capture strong directional moves while controlling risk during uncertain market conditions. It combines trend-following, price action, and volatility-based risk management into a single robust framework.
Core Concept
The strategy trades inside bar breakouts only in the direction of the dominant market trend. Inside bars represent periods of consolidation, and when price breaks out of this consolidation in a trending market, it often leads to impulsive moves with favorable risk–reward characteristics.
Key Components
1. Trend Filter
Uses 50 EMA and 200 EMA to define the market trend.
Bullish bias: 50 EMA above 200 EMA
Bearish bias: 50 EMA below 200 EMA
This filter prevents counter-trend trades and improves trade quality.
2. Volatility Filter
Compares fast ATR (14) with slow ATR (50).
Trades are taken only when volatility is expanding or above a minimum threshold.
This avoids low-volatility, choppy market conditions.
3. Inside Bar Breakout
An inside bar forms when the current candle’s high is lower than the previous candle’s high and the low is higher than the previous candle’s low.
A trade is triggered only when price breaks above or below the inside bar range in the direction of the trend.
4. Candle Quality Filter
Requires a minimum body-to-range ratio, ensuring that the breakout candle has strong momentum and is not driven by weak wicks.
Risk Management & Trade Management
Stop Loss (SL)
Placed using ATR-based dynamic stops, adapting to current market volatility.
Prevents tight stops in volatile conditions and wide stops in calm markets.
Partial Profit Taking
50% of the position is exited at 1.5R, locking in profits early.
This reduces psychological pressure and improves equity stability.
Trailing Stop
After partial profit is taken, the remaining position is managed with an ATR-based trailing stop.
Allows the strategy to capture large trend moves while protecting gains.
Cooldown Mechanism
After a losing trade, the system enters a cooldown period and skips a fixed number of bars.
This helps avoid revenge trading and overtrading during unfavorable market phases.
Why This Strategy Works
Trades only high-probability breakouts in trending markets
Adapts automatically to changing volatility
Combines price action precision with systematic risk control
Designed for consistent performance over long historical periods

Trend Prediction Meter [PointAlgo]The Trend Prediction Meter & Levels is a composite market-bias and volatility visualization tool designed to summarize trend strength, momentum, price positioning, and volatility into a single normalized score.
It provides a structured framework to interpret directional bias and probable price expansion zones during active market conditions.
Concept Overview
Markets often reflect multiple conditions simultaneously—trend direction, momentum strength, price location within a range, and volatility.
This indicator combines these elements into a unified Bullish Score (0–100), displayed as a meter and supported by projected ATR-based levels.
Rather than focusing on a single signal, the script aims to present context about current market conditions.
Bullish Score Composition (0–100)
The meter represents a weighted blend of multiple market factors:
1. Trend Strength (EMA Structure)
Uses a fast and slow EMA to assess directional bias.
The distance between EMAs is normalized into a trend strength score.
Strong separation indicates directional conviction; compression suggests balance.
2. Momentum Strength (RSI Blend)
Combines a short-term and mid-term RSI.
Helps capture both immediate momentum and broader directional stability.
Higher readings indicate sustained bullish pressure, lower readings indicate bearish pressure.
3. Position Within Recent Range
Measures where price is trading relative to its recent high–low range.
Values near the top of the range reflect strength; values near the bottom reflect weakness.
Mid-range positioning indicates equilibrium.
4. Volume Participation
Compares current volume against its recent average.
Acts as a minor confidence modifier rather than a primary driver.
Each component is normalized and combined using fixed weights to produce a final Bullish Score between 0 and 100.
Bias Classification
The Bullish Score is translated into descriptive market states:
Extreme Bullish
Very Bullish
Bullish
Neutral
Bearish
Very Bearish
These labels describe current bias, not future certainty.
Meter Visualization
The meter plot dynamically changes color based on the score range.
A dashed midline at 50 represents balance.
Background shading highlights strong bullish or bearish dominance zones.
Crossovers of the 50-level indicate shifts in directional control.
ATR-Based Projection Levels:
To provide volatility context, the indicator calculates ATR-based upside and downside reference levels:
Two potential expansion levels (TP1 and TP2) are projected above and below price.
The distance of these levels adapts based on current bias strength.
These levels are contextual reference zones, not fixed targets.
Prediction Dashboard
An optional side table summarizes key readings at the most recent bar:
Symbol
Current bias label
Bullish Score
Current price
ATR value
Upside and downside projection levels
Directional comment (Upside favoured / Downside favoured / Balanced)
This dashboard is designed to provide a quick structural overview without requiring manual calculation.
Signals & Alerts
Built-in alerts are available for:
Bullish bias conditions
Bearish bias conditions
Bullish Score crossing above 50
Bullish Score crossing below 50
Alerts are informational and reflect internal state changes only.
Customization:
Users can adjust:
RSI lengths
EMA lengths
Range lookback period
ATR parameters
Display options for the meter and dashboard
This allows adaptation across different instruments and timeframes.
Usage Notes
Best suited for analytical interpretation rather than standalone decision-making.
Designed to complement price action, structure, or other indicators.
Works across multiple markets where volume and volatility data are available.
Disclaimer :
This indicator is intended for educational and analytical purposes only.
It does not provide investment, trading, or financial advice.
All signals and levels should be validated with independent analysis and appropriate risk management.

Stochastic RSI + RSI/ADX Stochastic RSI with RSI/ADX Display
DESCRIPTION:
Advanced momentum oscillator combining Stochastic RSI with Ehlers SuperSmoother filter for reduced noise and cleaner signals. Includes real-time RSI and ADX value displays for complete market analysis.
KEY FEATURES:
- Stochastic RSI applied to logarithmic price for normalized movements
- Ehlers SuperSmoother filter reduces lag while eliminating false signals
- Second derivative (curvature) analysis filters out low-probability setups
- Real-time RSI and ADX boxes with color-coded thresholds
- Buy/Sell signals only trigger with confirmed momentum and curvature alignment
COMPONENTS:
1. K Line (Blue): Smoothed Stochastic RSI
2. D Line (Orange): Signal line (SMA of K)
3. RSI Box: Green above 50, Red below 50
4. ADX Box: Green above 25 (trending), Red below 25 (ranging)
SIGNAL LOGIC:
BUY: K crosses above D + positive curvature + below midpoint (50)
SELL: K crosses below D + negative curvature + above midpoint (50)
PARAMETERS:
- K Smoothing: 10 (Ehlers filter period)
- D Smoothing: 3 (Signal line)
- RSI
