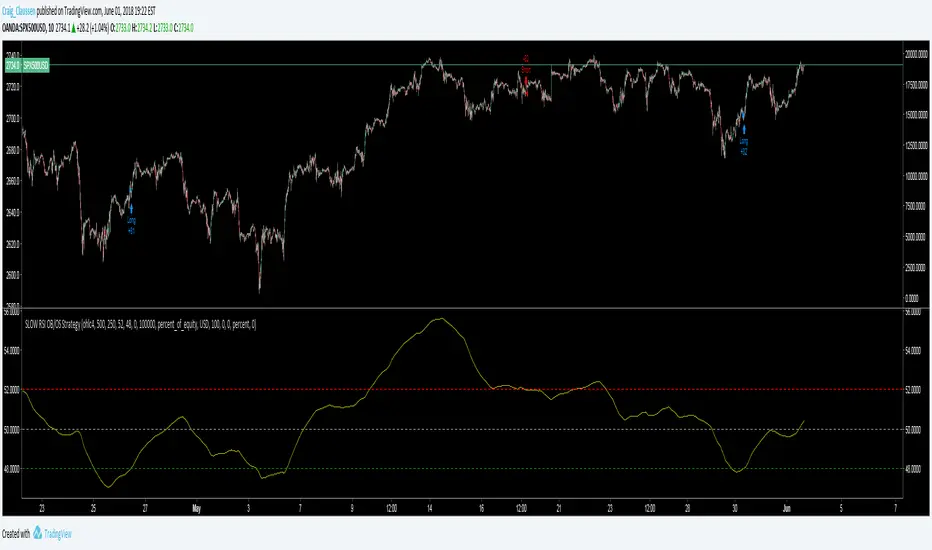
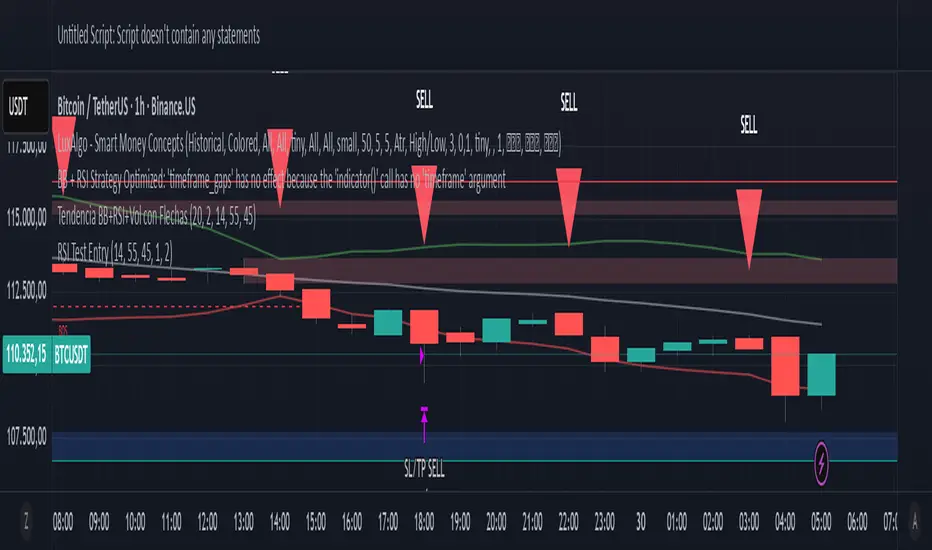
SLOW RSI OB/OS StrategySlowing the RSI down opens up a whole new world of possibilities.
This concept can work for a lot of TA indicators including the MACD.
See script source code for further description. Feel free to add pyramid trades at your own discretion in your format menu.
No this doesn't repaint!
"勺设股份的RSI指标分析" için komut dosyalarını ara
RSI BitfinexRSI applied to BTC longs/shorts ratio on Bitfinex. You can use the oscillator as you'd use RSI:
- Divergences
- Oversold/overbought signals
- R/S on the indicator
- Trend indication
- etc


RSI 7 avec fenêtre en haut à droiteRsi 7 survente 80 avec fenêtre en haut a droite. En vert en dessous de 80 en rouge au dessus


RSI potente 2.0rsi mas refinado e indicadores correctos a corto ,mediano y largo plazo .. el mejor indicador
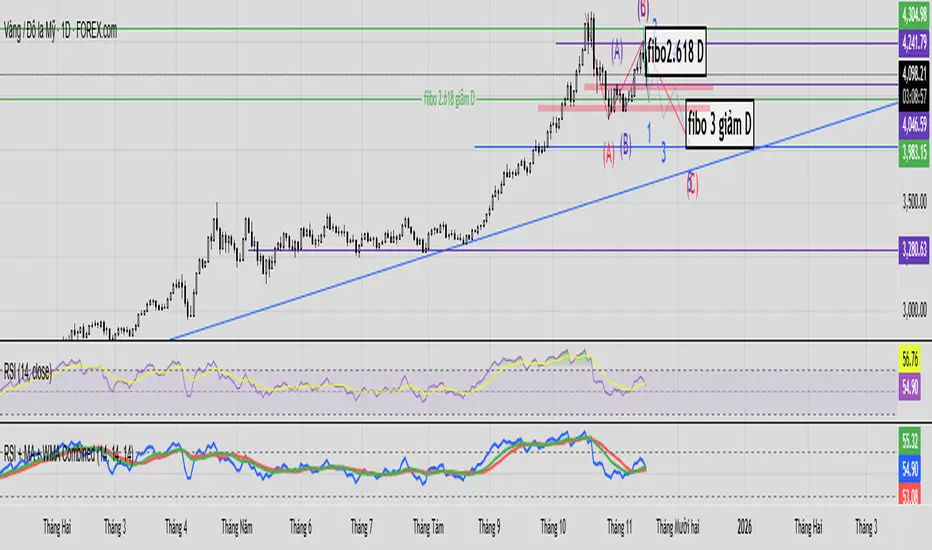
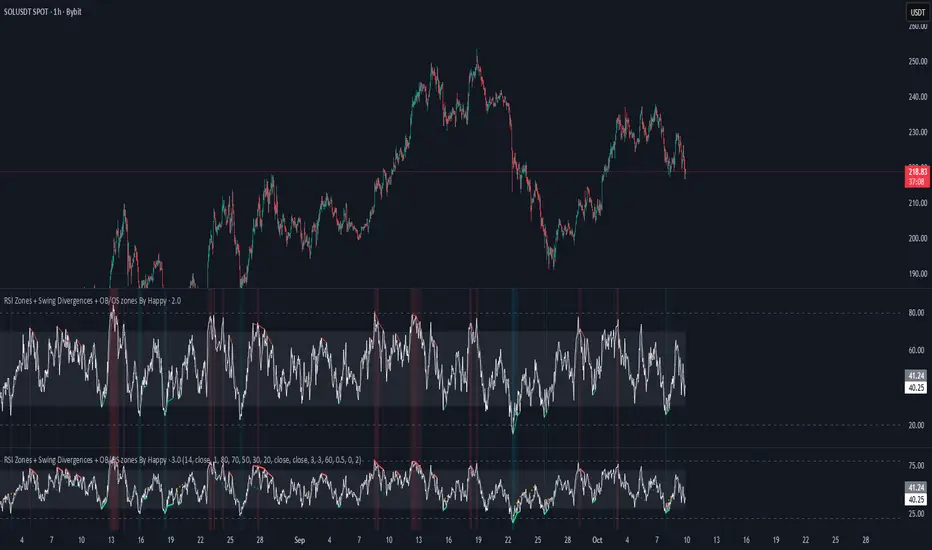
RSI Zones + Swing Divergences + OB/OS zones By HappyRsi with + divergences/ convergences + OB/OS zones
hidden bull/bear
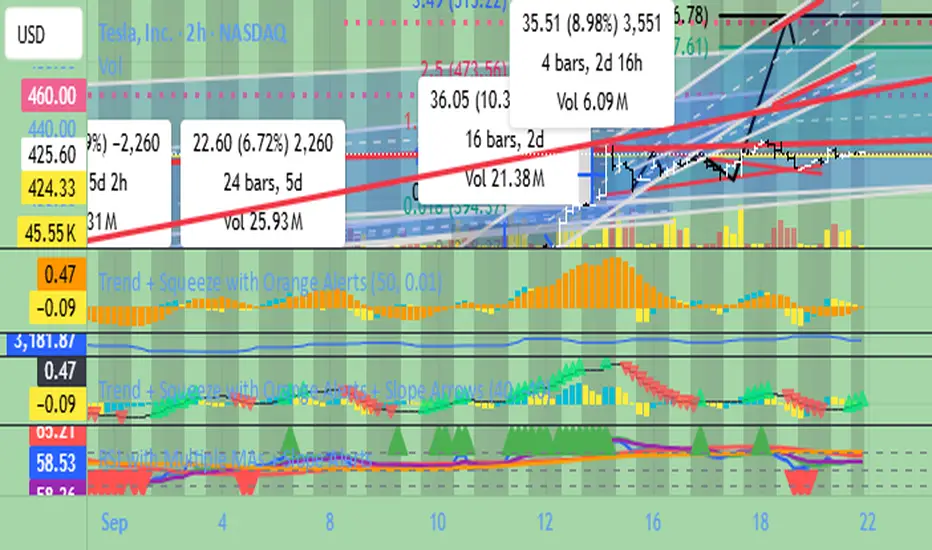
RSI with Multiple MAs + Slope Alerts 5,9,34,55RSI with Multiple MAs + Slope Alerts 5,9,34,55
Stacking Alerts Available
RSI + Stoch + Bollinger — Tableau compact (coin sup. droit)RSI + Stoch + Bollinger — Tableau compact (coin sup. droit)

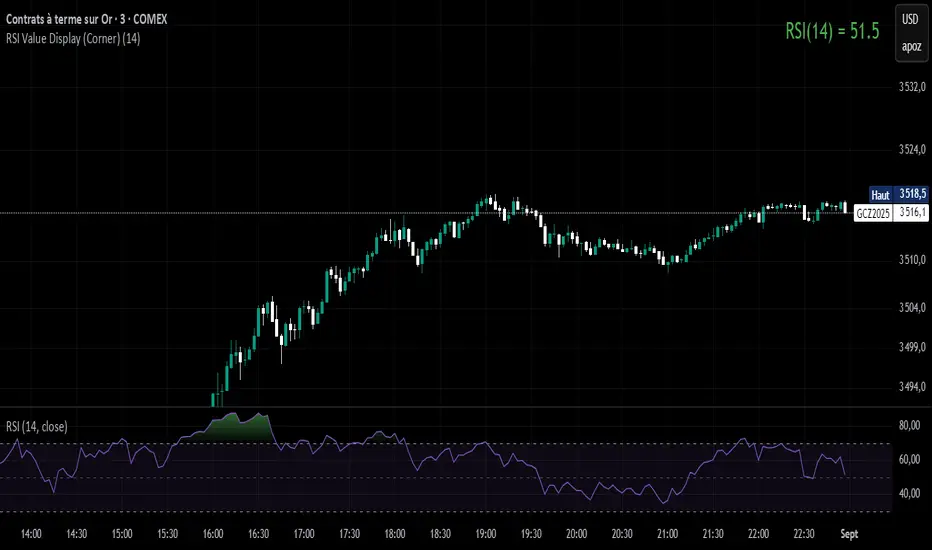
RSI Value Display (Corner)RSI in the right corner (red when is above 70 and below 30 - Green for the rest)
RSI Multi Length + Normalized BBW (Butrait)RSI + BB: este indicador muestra cuando el valor esta en sobre venta o sobre compra.

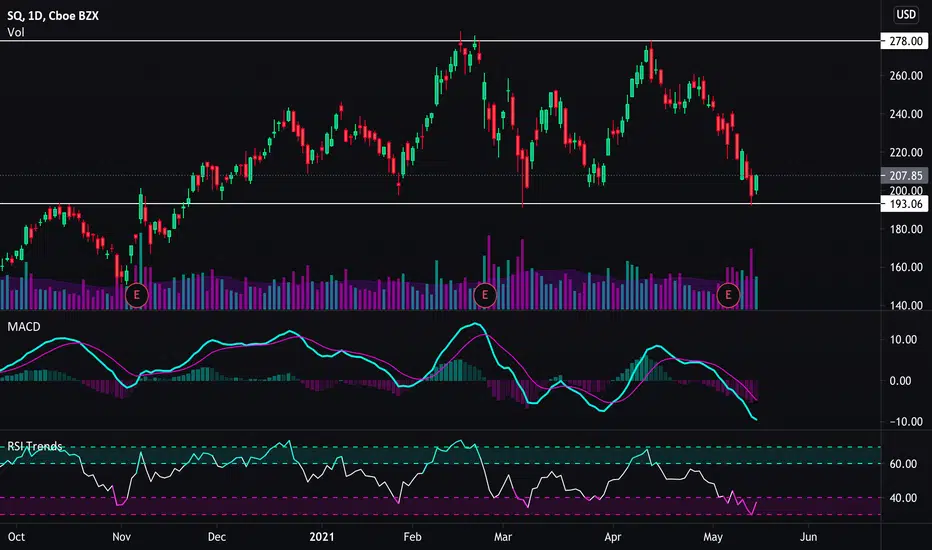
RSI + MACD + EMA Buy/Sell ComboRSI + MACD + EMA Buy/Sell Combo with signals if all 2 lines up it will create buy and cell signals
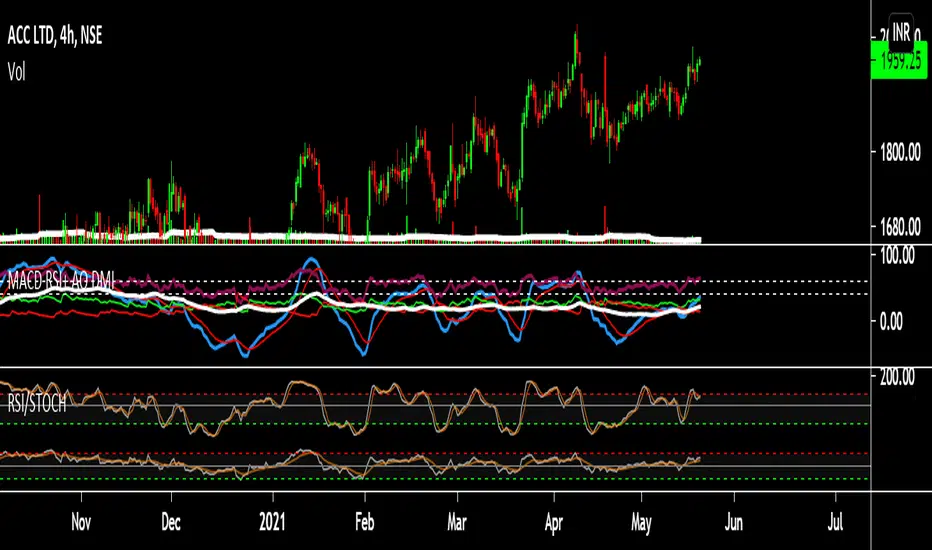
RSI-CCI Momentum ScreenerRSI-CCI Momentum Screener;
How to Use:
Apply this script to 1H or 4H timeframe
Works well for NSE stocks, crypto, or forex
Look for a green label “BUY” that shows when the screener conditions are met

RSI HeatmapRSI Heatmap right on your chart. Cold and Hot areas means oversold and overbought cycles respectly.


RSI MTF TableRSI MTF covers the timeframes 1m, 5m, 15m, 1H, 4H and Daily
Works on any intraday chart and appears in bottom left of screen
Can customise colors and transparency