YJ Mean ReversionMean reversion strategy, based upon the price deviation (%) from a chosen moving average (bars). Do note that the "gains" are always relative to your starting capital, so if you set a smaller starting capital (e.g. $10000) your gains will look bigger. Also when the strategy tester has finished calculating, check the "Open P/L", as there could still be open trades.
Some Tips:
- Was designed firstly to work on an index like the S&P 500 , which over time tends to go up in value.
- Avoid trading too frequently (e.g. Daily, Weekly), to avoid getting eaten by fees.
- If you change the underlying asset, or time frame, tweaking the moving average may be necessary.
- Can work with a starting capital of just $1000, optimise the settings as necessary.
- Accepts floating point values for the amount of units to purchase (e.g. Bitcoin ).
- If price of units exceeds available capital, script will cancel the buy.
- Adjusted the input parameters to be more intuitive.
"做空标普500" için komut dosyalarını ara

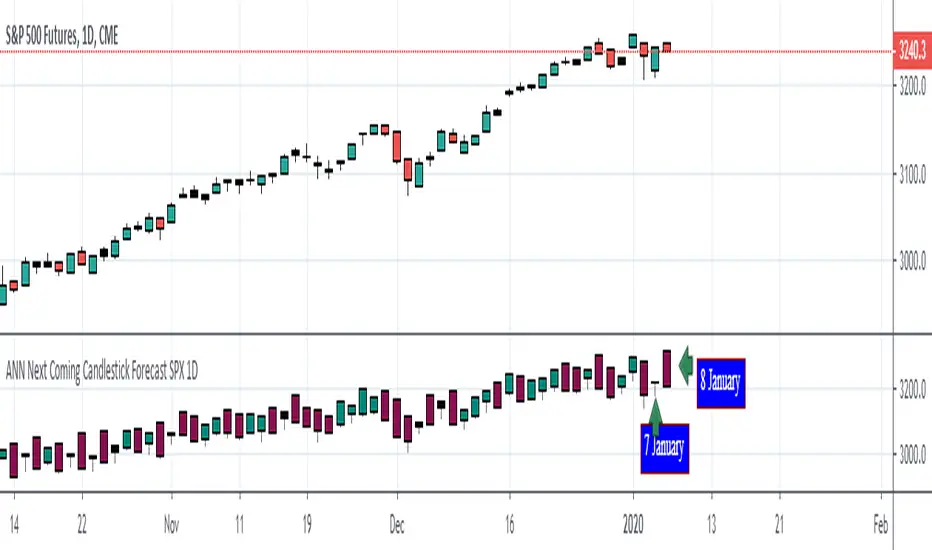
ANN Next Coming Candlestick Forecast SPX 1D v1.0WARNING:
Experimental and incomplete.
Script is open to development and will be developed.
This is just version 1.0
STRUCTURE
This script is trained according to the open, close, high and low values of the bars.
It is tried to predict the future values of opening, closing, high and low values.
A few simple codes were used to correlate expectation with current values. (You can see between line 129 - 159 )
Therefore, they are all individually trained.
You can see in functions.
The average training error of each variable is less than 0.011.
NOTE :
This script is designed for experimental use on S & P 500 and connected instruments only on 1-day bars.
The Plotcandle function is inspired by the following script of alexgrover :
Since we estimate the next values, our error rates should be much lower for all candlestick values. This is just first version to show logic.
I will continue to look for other variables to reach average error = 0.001 - 0.005 for each candlestick status.
Feel free to use and improve , this is open-source.
Best regards.
Price Relative / Relative StrengthThe Price Relative indicator compares the performance of one security to another with a ratio chart. This indicator is also known as the Relative Strength indicator or Relative Strength Comparative. Often, the Price Relative indicator is used to compare the performance of a stock against a benchmark index, S&P 500, BIST:XU100 etc.
Chartists can also use the Price Relative to compare the performance of a stock to its sector or industry group. This makes it possible to determine if a stock is leading or lagging its peers. The Price Relative indicator can also be used to find stocks that are holding up better during a broad market decline or showing weakness during a broad market advance. (Source: stockcharts)
This also can be used for Trend Identification and Bullish/Bearish Divergences.
Good Luck

TradersAI_UTBotCREDITS to @HPotter for the orginal code.
CREDITS to @Yo_adriiiiaan for recently publishing the UT Bot study based on the original code -
I just added some simple code to turn it into a strategy. Now, anyone can simply add the strategy to their chart to see the backtesting results!
While @Yo_adriiiiaan mentions it works best on a 4-hour timeframe or above, I am happy to share that this seems to be working on a 15-minute chart on e-mini S&P 500 Index (using the KeyValue setting at 10)! You can play around with the different settings, and may be you might discover even better settings.
Hope this helps. Btw, if any of you play with different settings and discover great settings for a specific instrument, please share them with the community here - it will be rewarded back multiple times!

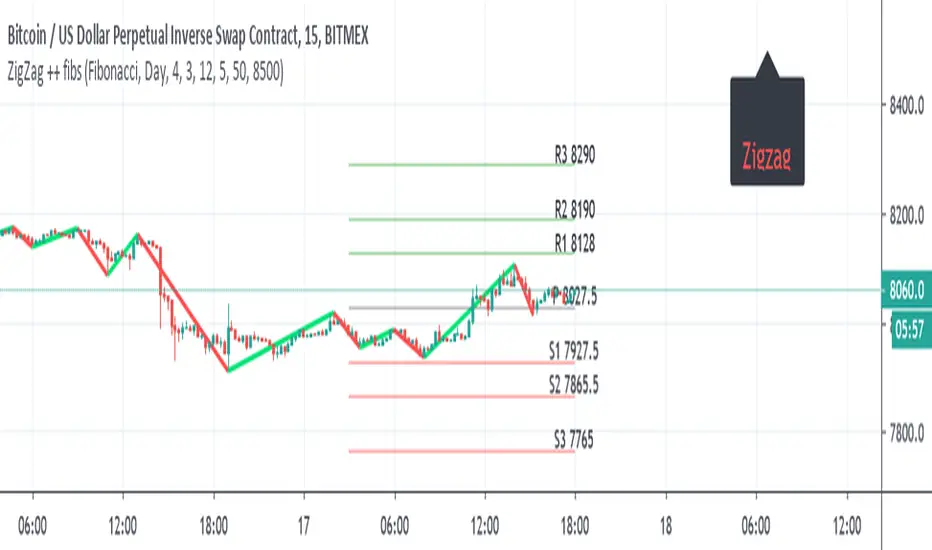
ZigZag ++ fibsI just put this as one user ask for me to do it.
So it the zigzag++ and fibs ,and other pivots type
the fibs can daily , monthly , year
the info panel need to be adjusted by either offset =distance from
or by putting a number , here its btc so I put about 500 above from close =8500
this important as otherwise it will look messy and not pretty
so for each type of asset you use , you expect to adjust this two variables or the data of fibs (daily , weekly etc)
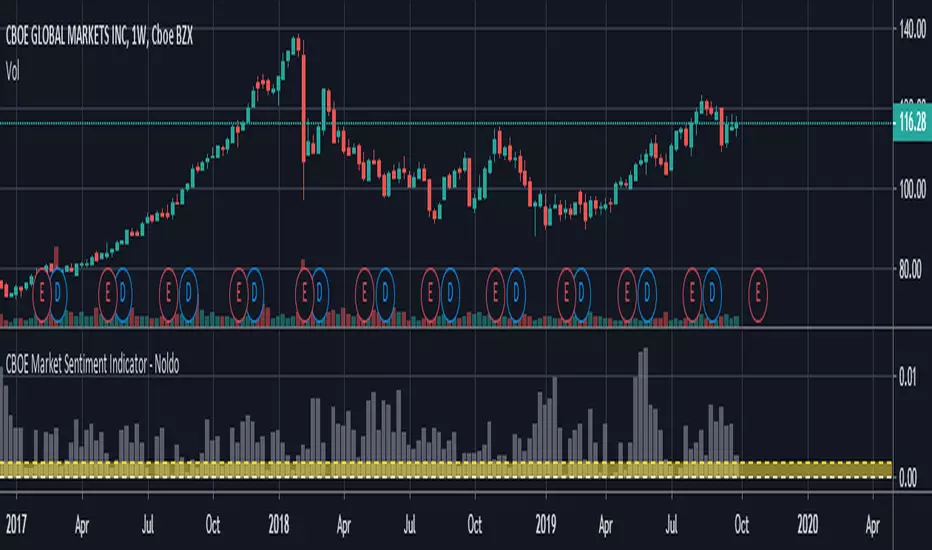
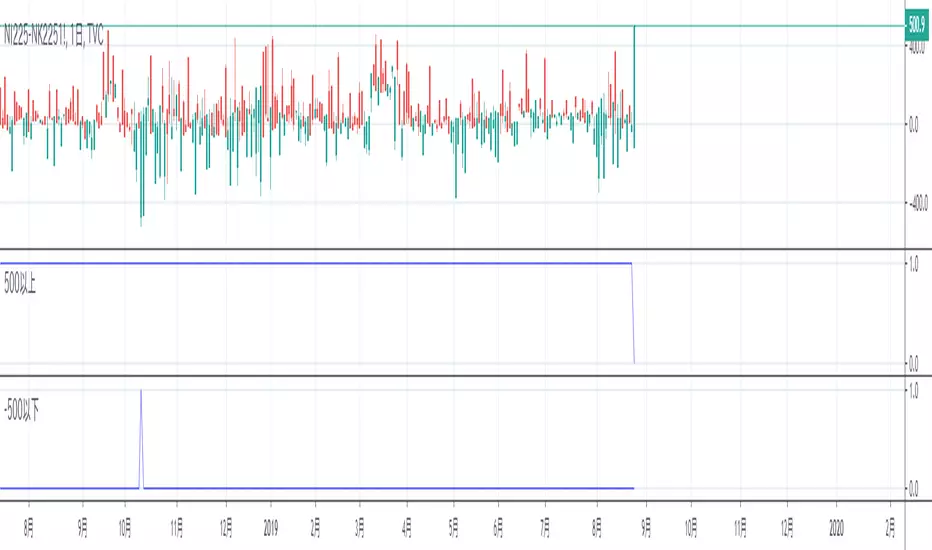
Call / All Ratio ( C / A ) - NoldoFirst of all this script inspired by MagicEins' Put/Call-Ratio-Buschi script .
What is the Put-Call Ratio
The put-call ratio is an indicator ratio that provides information about relative trading volumes of an underlying security's put options to its call options. The put-call ratio has long been viewed as an indicator of investor sentiment in the markets, where a large proportion of puts to calls indicates bearish sentiment, and vice versa. Technical traders use the put-call ratio as an indicator of performance and as a barometer of overall market sentiment. Put-call ratios on broader indexes such as the S&P 500 are also used as more general gauges of market climate.
Put-Call Ratio Interpretation
One way to interpret the put-call ratio is to say that a higher ratio means it's time to sell and a lower ratio means it's time to buy, because when the ratio is high it suggests that people are either expecting or protecting more readily against a future decline in the price of the underlying. A Put-Call ratio between 0.5 and 1 is considered a sideways trend in the markets.
Some also view the Put-Call ratio as a contrarian indicator. Traders know that derivatives are used to do more than place bets; they are used as hedges and insurance. If there's a lot of insurance being placed to the sell side, it means traders are worried about prices falling.
Some traders buy when the put-call ratio is above 1, meaning the market is out of balance to the sell side, and sell when the put-call ratio is below 1, meaning the market is out of balance to the buy side. These traders are looking to make money on the correction. The interpretation of the ratio is left to the analyst's or trader's investment philosophy.
Reference : Investopedia (www.investopedia.com)
Let' s start.
In short, calls represent "bulls" and puts represent "bears".
Some analysts do the opposite,for trend reversals the choice is up to you.
I usually look at the opposite comments in commercial positions because I look at this flow angle neutral.
If you want to do the opposite, you must create Put / All Ratio.
So i created this ratio to observe easily movements under or over 0.50 area .
Or you can take the point close to 0.50 as a horizontal trend. Many more comments can be made.I have a few ideas about this, and I'm going to publish them soon . My best suggestion is that it covers a single bar and is very volatile, so you can look for averages and strong accelerations.
This code is open source under the MIT license. If you have any improvements or corrections to suggest, please send me a pull request via the github repository github.com
Stay tuned , best regards.
Trend Direction Helper (ZigZag and S/R and HH/LL labels)Hey everyone
First of all, I'd like to thank Ricardo Santos, Backtest Rookies for the inspiration for this script.
Actually, most of it is coming from them and I only mixed them up (and added my secret sauce ^^). If some of you are not thinking about a trading secret sauce, please get serious for a moment :)
Some of you asked me how I do to set the trend direction. You all understood that if you get an UP label, then the price should go up and vice-versa for down.
But it's not so easy to define the good signals for each asset and each timeframe. I'm going to repeat what I said yesterday because ... well... that's what trading is about
So quoting myself here "The inputs set by default will have to be changed for your asset/timeframe and can't be generic for everything. You have to play with the inputs until the signals will make sense to you
The indicator/strategy with a unique configuration that you'll never check or update according to the market condition DOES NOT exit. "
BUT... a bit of patience and practice and you might do wonders.
The Method
I never realized until now but by connecting the higher highs/lower lows, I was drawing zigzag lines.
The Zig Zag Master is Ricardo Santos . Please give him a follow, he's awesome
For those who don't want to draw on the chart or (my preferred choice) need some inspiration to define your trend directions, this script is for YOU (and your family, your pet, your girlfriend/boyfriend, ...)
I think that each asset/timeframe chart has its own history. What worked in a post could work in the future.
In that regard, if a trend direction worked in the past, that's the parameter that I'll use to trade with it in a demo account and make sure it's relevant. If not then I will adjust
If you're trading with new indicators or a new method right away on your real trading account, you're gonna have a bad time imgflip.com
Lines EVERYWHERE
The script draws the classical horizontal pivots + the zig zag lines + the Higher Highs/Lower Lows label in just 1 script. I'm very excited to share a script (on which I coded 100 lines out of 500) but no one else did it
The horizontal pivots part are coming from Backtest Rookies
For more security, you can add a pullback on a moving average after getting a signal. Pullbacks are necessary to limit any eventual loss or maximize your gains by getting in the trend sooner.
I really give you a solid method and a great script in my opinion. 6 years of experience given away for FREE :p (when Dave will start thinking as a business man instead :O)
Does it repaint ?
Getting this question twice a day. You guys are obsessed with the repainting :)
Short answer, yes because it will calculate the pivots and zig zags whenever new higher highs/lower lows will be formed.
However, the trend direction code is based on the candle close so it shouldn't repaint. If it does, please let me know
See you all on Monday
Love you all
Dave
____________________________________________________________
Be sure to hit the thumbs up. Building those indicators take a lot of time and likes are always rewarding for me :) (tips are accepted too)
- If you want to suggest some indicators that I can develop and share with the community, please use my personal TRELLO board
- I'm an officially approved PineEditor/LUA/MT4 approved mentor on codementor. You can request a coaching with me if you want and I'll teach you how to build kick-ass indicators and strategies
Jump on a 1 to 1 coaching with me
- You can also hire for a custom dev of your indicator/strategy/bot/chrome extension/python
Disclaimer:
Trading involves a high level of financial risk, and may not be appropriate because you may experience losses greater than your deposit. Leverage can be against you.
Do not trade with capital that you can not afford to lose. You must be aware and have a complete understanding of all the risks associated with the market and trading. We can not be held responsible for any loss you incur.
Trading also involves risks of gambling addiction.
Please notice I do not provide financial advice - my indicators, strategies, educational ideas are intended to provide only some source code for anyone interested in improving their trading
The proprietary indicators and strategies developed by Best Trading Indicator, the object of intellectual property rights are and remain the exclusive property of Best Trading Indicator, at the exclusion of images and videos and texts free of rights or provided by the Company or external legal or physical person.
No assignment of intellectual property rights is carried out through these Terms and Conditions.
Any total or partial reproduction, modification or use of these properties for any reason whatsoever is strictly prohibited without the express written authorization of the Company.


ck - Crypto Correlation IndicatorA simple Correlation Indicator initially configured for Crypto Trader use (but other markets can use this too).
It plots the correlation between the current chart (say BTCUSD ) versus 4 user-definable indices, currency pairs, stocks etc.
By default, the indicator is preconfigured for:
GOLD (Oz/$),
Dow Jones Index (DJI),
Standard & Poor 500 Index (SPX) ,
Dollar Index ( DXY )
You can set the period (currently 1D resolution) in the "Period" box in the settings, valid inputs are:
minutes (number), days (1D, 2D, 3D etc), weeks (1W, 2W etc), months (1M, 2M etc)
Length is the lagging period/smoothing applied - default is 14
When changing comparison instruments/tickers, you may find it useful to prefix the exchange with the instrument's ticker, for example:
Binance:BTCUSDT, NYSE:GOOG etc
*** Idea originally from the brilliant Backtest Rookies - backtest-rookies.com ***
MBK Multi MAsHello,
this is a Moving Average (9,25,50,100,200,300,400,500) very simple script with golden cross and death cross spots.
feel free to modify it as you like.
trade safe

Multiple lines EMA/SMA [AKUBI] Ver.2 - 5本の指数平滑・移動平均線単純移動平均線と指数平滑移動平均線(SMA/EMA)を最大5本引けるインジケーターです。
これまでのものとの違いは
・線の太さ
・名前の変更←これ重要
です。いままでのものをそのまま使用いただいても、問題はありません。
通常、トレーディングビューでは、
移動平均線を5本同時に表示させるには「5つのインジケーターを必要とします」。
しかし、 このインジケーターは1つ使えば最大5本まで同時に表示させることができます 。
また、余計なオプションは一切ありませんので、 どなたにでも、すぐにご使用いただけます 。
1)まず、この画面の右下にある「お気に入りに追加」をクリックしてください。
そうすると、インジケーターの「お気に入り」からいつでも呼び出せます。
もしくはインジケーターの検索欄から「AKUBI」と検索しても見つけられます。
使い方は簡単。
2)EMA(指数平滑移動平均線)か SMA(単純移動平均線)のいずれかを選択。
3)その後、お好きな期間を入力してください。
単純移動平均線(SMA)というのは、「5」と入力すれば、5本分のローソク足の終値の平均が表示され、それを結んだ線です。
指数平滑移動平均線(EMA)というのは、少し計算を複雑にして、より素早い動作を実現したものです。
デフォルトでは期間として(7,28,84,100,500)の5種類があらかじめ入力されています。
このまま使っても問題ありませんが、ネットで「移動平均線 設定」と検索すれば、いろいろな設定が紹介されていますので、参考にしてみてください。
不要な線があれば、チェックを外すだけです。
とっても簡単、便利です。
It is all in one. You can use 5 moving average lines with this one indicator only.
It is so easy. Just add this indicator. Next step, please add your favorite periods.
If you think this is an unnecessary line, you just remove in the check box.
Thank you!

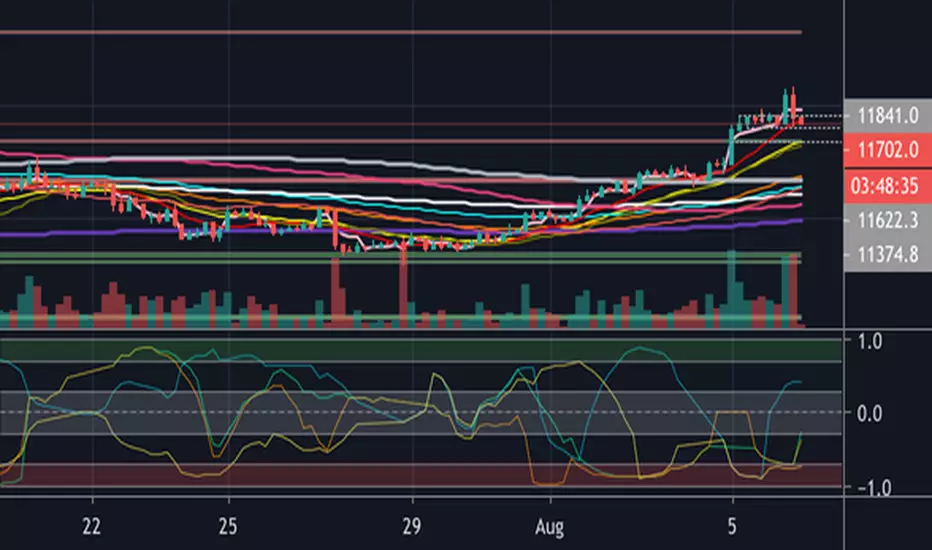
VWMA VWAP RibbonsPrimarily this script visually represents the differential between the volume weighted moving averages and the SMA. This is shown in the VWMA-SMA ribbons: green 20, yellow 50, red 200.
The VWAP ribbon is purple and is calculated separately from VWMA ribbons mentioned above.
300,400,500 SMA are shown in grey.
Brighter means more recent.

Multi-indicador MACD/RSI/volumen en ventanaComplemento para el otro indicador que ya publiqué.
En esta caso añado las gráficas de MACD, RSI y volumen en una sola ventana.
El problema para esto es el escalado de las gráficas del MACD y el volumen para que entren en una escala de 1 a 100 para lo que tomo los máximos y mínimos de 500 velas (este valor se puede cambiar).
Adicionalmente, coloreo el macd de verde cuando sobrepasa a la señal o de rojo cuando va por debajo y lo mismo con el rsi.
Añado el volumen a todo esto, también escalado.

TICK gapUsed with the "Cumulative TICK", highlights a gap up candle in yellow and a gap down candle in white, then plots a line 500 points away, signalling a counter trend entry.

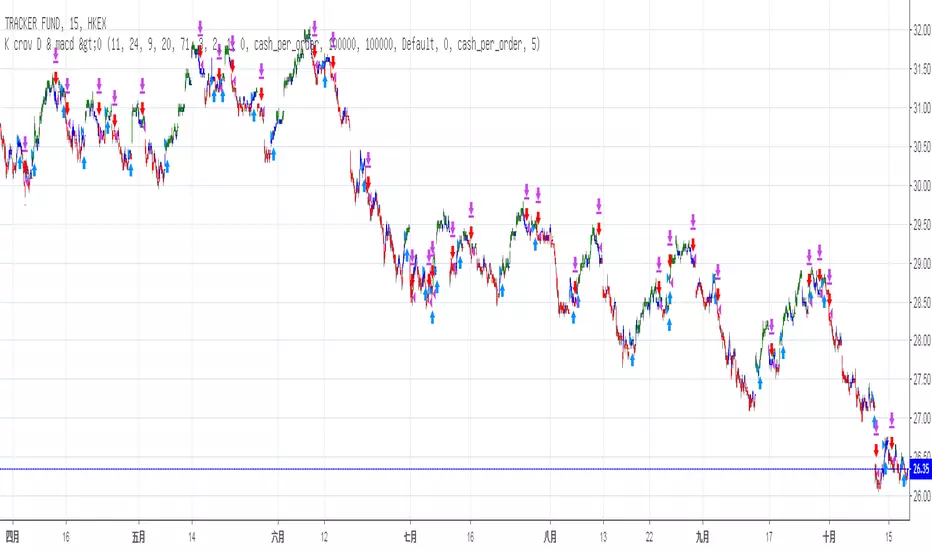
Stochastic & MACD Strategy Ver 1.0This strategy is inspired by ChartArt and jasonluk28.
The following input changes from the initial ChartArt version to achieve higher stability and profit:
Fast MA Len:11
Slow MA len: 24
Stoch Len: 20
No difference is found in minor changes (+-10) lv. of overbought/oversold
It works above 40% winning rate in Heng Heng Index, Shanghai Composite, Dow Jones Industrial Averge, S&P 500 NASDAQ, VT (World Total Market) and in 15 mins chart
Profit: above ~10 to 30% in less than 1year backtest for most major indice of China and US and ~62% in Heng Seng Index (Hong Kong) & 40.5% in SZSE Composite (Shen Zhen)
P.S. Profit: 700 (Tencent) +150.5%, 939 (CCB) +66.5%, 1299 (AIA) +45%, 2628 (CLIC) +41%, 1 (CK Hutchison) +31%
NFLX +82.5%, BABA +55.5%, AMZN +44%, GOOG +38%, MCD +24.5%
However, Loss in FB -19% , AMD -38.5%
Not suitable for stocks with great influences in News or Events ???