TTP SuperTrend ADXThis indicator uses the strength of the trend from ADX to decide how the SuperTrend (ST) should behave.
Motivation
ST is a great trend following indicator but it's not capable of adapting to the trend strength.
The ADX, Average Directional Index measures the strength of the trend and can be use to dynamically tweak the ST factor so that it's sensitivity can adapt to the trend strength.
Implementation
The indicator calculates a normalised value of the ADX based on the data available in the chart.
Based on these values ST will use different factors to increase or reduce the factor use by ST: expansion or compression.
ST expansion vs compression
Expanding the ST would mean that the stronger a trends get the ST factor will grow causing it to distance further from the price delaying the next ST trend flip.
Compressing the ST would mean that the stronger a trends get the ST factor will shrink causing it to get closer to the price speeding up the next ST trend flip.
Features
- Alerts for trend flip
- Alerts for trend status
- Backtestable stream
- SuperTrend color gets more intense with the strength of the trend
"乌德勒支+VS+赫拉克勒斯" için komut dosyalarını ara

Momentum Probability Oscillator [SS]This is the momentum based probability indicator.
What it does?
This takes the average of MFI, Stochastics and RSI and plots it out as an independent oscillator.
It then tracks bullish vs bearish instances. Bullish is defined as a greater move from open to high than open to low and inverse for bearish.
It stores this data and these averages and plots these levels as a graph.
The graph depicts the max bullish values at the top, the min bearish values at the bottom and the averages in between:
It will plot the average "threshold" value in yellow:
The threshold value is key. A ticker trading above the threshold is generally bullish. Below is bearish.
The threshold value frequently acts as support and resistance levels (see below):
Resistance:
Support:
The indicator also shows you the amount of time a ticker has spent in each region, over a defined lookback period (defaulted to 500):
When you see that cumulatively, more time has been spent in a bullish range or a bearish range, it can help you ascertain the prevailing sentiment at that time.
The indicator will also calculate the average price range based on the underlying oscillator value. It does this through use of ATR based techniques, as its not usually possible to calculate a price from an oscillator:
This is intended as a general reference and not a precise target, as it is using ATR as opposed to the actual technical value itself.
As this is an oscillator, you can use it to look for divergences as well. The advantage to having it formulated in this way is:
a) You get the power of all 3 indicators (stochastics, MFI and RSI) in one and
b) You are adding context to the underlying technical reading. The indicator is plotting out the average, max and min ranges for the selected ticker and performing assessments based on these ranges that add context to the current PA.
You also have the ability to see the specific technical levels associated with each specific technical indicator. If you open up the settings menu and select "Show Table", this will appear:
This will show you the exact values of each of the technicals the indicator is using in its range assessment.
And that is basically the bulk of the indicator!
I use this predominately on the smaller timeframes, especially when there is a lot of chop, to ascertain the overall sentiment.
I also will reference it on the 1 hour to see what the prevailing sentiment is and whether the stock is at an area of technical resistance or support. For example, here is what I referenced on SPY today:
QUICK NOTE:
It works best with RTH (regular trading hours) turned on and ETH (extended trading hours) turned off!
That's it!
Hopefully you like it and leave your comments and suggestions below!

MarketSmith Daily Market IndicatorsMarketSmith Daily Market Indicators is designed to mimic the Daily Market Indicators tab found in MarketSmith. This tab contains 4 different secondary indicators to help gauge the health of the overall market.
This indicator allows you to choose which of the 4 indicators to show, as well as which index to pull data from, Nasdaq or NYSE. There is also a snapshot table showing the following:
# of stock advancing and up volume
# of stocks declining and down volume
# of stock unchanged and unchanged volume
# of stocks making new highs and new lows
Now let's look at the 4 indicators and how they work.
Advance/Decline Line
Plots the number of advancing shares vs the number of declining shares. Heavily weighted index stocks can skew price action, this line helps reveal that and whether most stocks are aligned with the trend.
Short Term Overbought/Oversold Oscillator
A 10-day moving average of the number of stocks moving up in price less the number of stocks moving down in price.
10 Day Moving Average of Up & Down Volume
Two 10 day moving averages to represent the volume of all stocks. Blue line: total volume of all stocks moving up in price. Red line: the total volume of all stocks moving down in price.
10 Day Moving Average of New Highs & New Lows
Two 10-day moving average to represent stocks making new highs and new lows. Blue line: The number of stocks making new price highs. Red line: The number of stocks reaching new lows.
Note this indicator is designed to work on a daily time frame chart. Data typically updates 90 minutes after the close. Data may differ from Marketsmith due to different providers, however the general trends are the same.

Filtered Volume Profile [ChartPrime]The "Filtered Volume Profile" is a powerful tool that offers insights into market activity. It's a technical analysis tool used to understand the behavior of financial markets. It uses a fixed range volume profile to provide a histogram representing how much volume occurred at distinct price levels.
Profile in action with various significant levels displayed
How to Use
The script is designed to analyze cumulative trading volumes in different price bins over a certain period, also known as `'lookback'`. This lookback period can be defined by the user and it represents the number of bars to look back for calculating levels of support and resistance.
The `'Smoothing'` input determines the degree to which the output is smoothed. Higher values lead to smoother results but may impede the responsiveness of the indicator to rapid changes in volatility.
The `'Peak Sensitivity'` input is used to adjust the sensitivity of the script's peak detection algorithm. Setting this to a lower value makes the algorithm more sensitive to local changes in trading volume and may result in "noisier" outputs.
The `'Peak Threshold'` input specifies the number of bins that the peak detection mechanism should account for. Larger numbers imply that more volume bins are taken into account, and the resultant peaks are based on wider intervals.
The `'Mean Score Length'` input is used for scaling the mean score range. This is particularly important in defining the length of lookback bars that will be used to calculate the average close price.
Sinc Filter
The application of the sinc-filter to the Filtered Volume Profile reduces the risk of viewing artefacts that may misrepresent the underlying market behavior. Sinc filtering is a high-quality and sharp filter that doesn't manifest any ringing effects, making it an optimal choice for such volume profiling.
Histogram
On the histogram, the volume profile is colored based on the balance of bullish to bearish volume. If a particular bar is more intense in color, it represents a larger than usual volume during a single price bar. This is a clear signal of a strong buying or selling pressure at a particular price level.
Threshold for Peaks
The `peak_thresh` input determines the number of bins the algorithm takes in account for the peak detection feature. The 'peak' represents the level where a significant amount of volume trading has occurred, and usually is of interest as an indicative of support or resistance level.
By increasing the `peak_thresh`, you're raising the bar for what the algorithm perceives as a peak. This could result in fewer, but more significant peaks being identified.
History of Volume Profiles and Evolution into Sinc Filtering
Volume profiling has a rich history in market analysis, dating back to the 1950s when Richard D. Wyckoff, a legendary trader, introduced the concept of volume studies. He understood the critical significance of volume and its relationship with market price movement. The core of Wyckoff's technical analysis suite was the relationship between prices and volume, often termed as "Effort vs Results".
Moving forward, in the early 1800s, the esteemed mathematician J. R. Carson made key improvements to the sinc function, which formed the basis for sinc filtering application in time series data. Following these contributions, trading studies continued to create and integrate more advanced statistical measures into market analysis.
This culminated in the 1980s with J. Peter Steidlmayer’s introduction of Market Profile. He suggested that markets were a function of continuous two-way auction processes thus introducing the concept of viewing markets in price/time continuum and price distribution forms. Steidlmayer's Market Profile was the first wide-scale operation of organized volume and price data.
However, despite the introduction of such features, challenges in the analysis persisted, especially due to noise that could misinform trading decisions. This gap has given rise to the need for smoothing functions to help eliminate the noise and better interpret the data. Among such techniques, the sinc filter has become widely recognized within the trading community.
The sinc filter, because of its properties of constructing a smooth passing through all data points precisely and its ability to eliminate high-frequency noise, has been considered a natural transition in the evolution of volume profile strategies. The superior ability of the sinc filter to reduce noise and shield against over-fitting makes it an ideal choice for smoothing purposes in trading scripts, particularly where volume profiling forms the crux of the market analysis strategy, such as in Filtered Volume Profile.
Moving ahead, the use of volume-based studies seems likely to remain a core part of technical analysis. As long as markets operate based on supply and demand principles, understanding volume will remain key to discerning the intent behind price movements. And with the incorporation of advanced methods like sinc filtering, the accuracy and insight provided by these methodologies will only improve.
Mean Score
The mean score in the Filtered Volume Profile script plays an important role in probabilistic inferences regarding future price direction. This score essentially characterizes the statistical likelihood of price trends based on historical data.
The mean score is calculated over a configurable `'Mean Score Length'`. This variable sets the window or the timeframe for calculation of the mean score of the closing prices.
Statistically, this score takes advantage of the concept of z-scores and probabilities associated with the t-distribution (a type of probability distribution that is symmetric and bell-shaped, just like the standard normal distribution, but has heavier tails).
The z-score represents how many standard deviations an element is from the mean. In this case, the "element" is the price level (Point of Control).
The mean score section of the script calculates standard errors for the root mean squared error (RMSE) and addresses the uncertainty in the prediction of the future value of a random variable.
The RMSE of a model prediction concerning observed values is used to measure the differences between values predicted by a model and the values observed.
The lower the RMSE, the better the model is able to predict. A zero RMSE means a perfect fit to the data. In essence, it's a measure of how concentrated the data is around the line of best fit.
Through the mean score, the script effectively predicts the likelihood of the future close price being above or below our identified price level.
Summary
Filtered Volume Profile is a comprehensive trading view indicator which utilizes volume profiling, peak detection, mean score computations, and sinc-filter smoothing, altogether providing the finer details of market behavior.
It offers a customizable look back period, smoothing options, and peak sensitivity setting along with a uniquely set peak threshold. The application of the Sinc Filter ensures a high level of accuracy and noise reduction in volume profiling, making this script a reliable tool for gaining market insights.
Furthermore, the use of mean score calculations provides probabilistic insights into price movements, thus providing traders with a statistically sound foundation for their trading decisions. As trading markets advance, the use of such methodologies plays a pivotal role in formulating effective trading strategies and the Filtered Volume Profile is a successful embodiment of such advancements in the field of market analysis.

DTR & ATR
Description
This ATR and DTR label is update of Existing Label provided by © ssksubam
Please See Notes on original Script Here :
Original Code is not mine but I have done few code changes which I believe will help everyone who are looking to add more labels together and save space on the chart
ATR & DTR Script is very helpful for Day Traders as I will explain in detail bellow
Following are changes I have incorporated
Previous Label took more space on the charts with Header and Footer.
I removed the Header and moved both DTR vs ATR descriptions on the same line, saving space on the chart.
I updated the code to remove => signs, which are self-explanatory as I will explain below.
I made the label in 1 single compact line for maximum space efficiency and aesthetics.
These changes improve the content's clarity and conciseness while optimizing space on the charts. If you have any further requests or need additional assistance, feel free to let me know!
What Does DTR Signify?
Stock ATR stands for Average True Range, which is a technical indicator used in trading and investment analysis. The Average True Range measures the volatility of a stock over a given period of time. It provides insights into the price movement and potential price ranges of the stock.
The ATR is calculated as the average of the true ranges over a specific number of periods. The true range is the greatest of the following three values:
The difference between the current high and the current low.
The absolute value of the difference between the current high and the previous close.
The absolute value of the difference between the current low and the previous close.
Traders and investors use ATR to assess the potential risk and reward of a stock. A higher ATR value indicates higher volatility and larger price swings, while a lower ATR value suggests lower volatility and smaller price movements. By understanding the ATR, traders can set appropriate stop-loss levels and make informed decisions about position sizing and risk management.
It's important to note that the ATR is not a directional indicator like moving averages or oscillators. Instead, it provides a measure of volatility, helping traders adapt their strategies to suit the current market conditions.
What Does ATR Signify?
The Average True Range (ATR) signifies the level of volatility or price variability in a particular financial asset, such as a stock, currency pair, or commodity, over a specific period of time. It provides valuable information to traders and investors regarding the potential risk and reward associated with the asset.
Here are the key significances of ATR:
Volatility Measurement: ATR measures the average price range between high and low prices over a specified timeframe. Higher ATR values indicate greater volatility, while lower values suggest lower volatility. Traders use this information to gauge the potential price movements and adjust their strategies accordingly.
Risk Assessment: A higher ATR value implies larger price swings, indicating increased market uncertainty and risk. Traders can use ATR to set appropriate stop-loss levels and manage risk by adjusting position sizes based on the current volatility.
Trend Strength: ATR can also be used to assess the strength of a trend. In an uptrend or downtrend, ATR tends to increase, indicating a more powerful price movement. Conversely, a declining ATR might signify a weakening trend or a consolidation period.
Range-Bound Market Identification: In a range-bound or sideways market, the ATR value tends to be relatively low, reflecting the lack of significant price movements. This information can be helpful for range-trading strategies.
Volatility Breakouts: Traders often use ATR to identify potential breakouts from consolidation patterns. When the ATR value expands significantly, it may indicate the beginning of a new trend or a breakout move.
Comparison between Assets: ATR allows traders to compare the volatility of different
How to use DTR & ATR for Trading
Using Average True Range (ATR) and Daily Trading Range (DTR) can be beneficial for day trading to assess potential price movements, manage risk, and identify trading opportunities. Here's how you can use both indicators effectively:
Calculate ATR and DTR: First, calculate the ATR and DTR values for the asset you are interested in trading. ATR is the average of true ranges over a specified period (e.g., 14 days), while DTR is the difference between the high and low prices of a single trading day.
Assess Volatility: Compare the ATR and DTR values to understand the current volatility of the asset. Higher values indicate increased volatility, while lower values suggest reduced volatility.
Setting Stop-Loss: Use ATR to set appropriate stop-loss levels. For example, you might decide to set your stop-loss a certain number of ATR points away from your entry point. This approach allows you to factor in market volatility when determining your risk tolerance.
Identify Trading Range: Analyze DTR to determine the typical daily price range of the asset. This information can help you identify potential support and resistance levels, which are essential for day trading strategies such as breakout or range trading.
Breakout Strategies: ATR can assist in identifying potential breakout opportunities. When ATR values increase significantly, it suggests an expansion in volatility, which may indicate an upcoming breakout from a trading range. Look for breakouts above resistance or below support levels with higher than usual ATR values.
Scalping Strategies: For scalping strategies, where traders aim to profit from small price movements within a single trading session, knowing the typical DTR can help set reasonable profit targets and stop-loss levels.
Confirming Trend Strength: In day trading, you may encounter short-term trends. Use ATR to assess the strength of these trends. If the ATR is rising, it suggests a strong trend, while a declining ATR may indicate a weakening trend or potential reversal.
Risk Management: Both ATR and DTR can aid in risk management. Determine your position size based on the current ATR value to align it with your risk tolerance. Additionally, understanding the DTR can help you avoid overtrading during periods of low volatility.
Combine with Other Indicators: ATR and DTR work well when used in conjunction with other technical indicators like moving averages, Bollinger Bands, or RSI. Combining multiple indicators can provide a mor

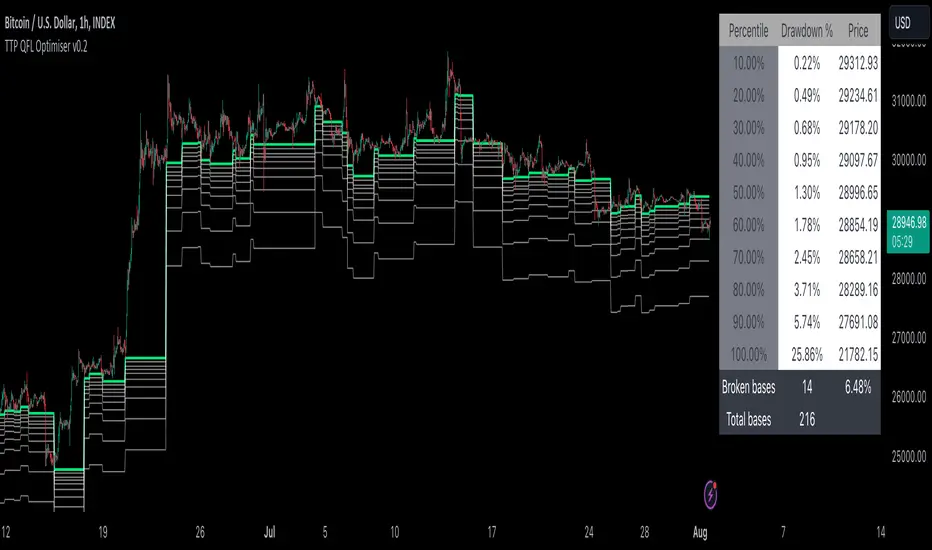
TTP QFL OptimiserThis tool is designed to help finding the best take profit and stop loss levels when trading with QFL bases (Quick Fingers Luc).
You can use it to see the average drawdown among all historic bases broken for an asset and then find the drawdowns that are more frequent using the percentile parameters provided.
For example, by knowing that 98% of the bases got broken with a drawdown of up to 5% can become extremely useful for deciding where to place your take profit or stop loss levels.
It supports QFL 1H, 2H and 4H but make sure to set the chart timeframe to a lower timeframe than QFL to obtain valid results.
Two percentiles are provided to be able to evaluate potential TP and SL at the same time.
Steps:
- Load an asset in the 15min TF
- Select the QFL version: 1H more deals / lower quality vs 4H less deals/ better quality
- Find a percentile that triggers enough deals (example: 70) and then another percentile that doesn't get hit too much (example: 98)
- Confirm the values p1 and p2 provided in the table and the white and grey lines for the results of which drawdown percentages correspond to such selection of percentiles
Once having p1 and p2 use your backtesting and forward testing tools to confirm and adjust accordingly.
Historic Volume/Market ProfilesHistoric Volume/Market Profile is a Periodic Volume Profile with all of the improvements known in the original Volume/Market Profile.
VMP is a 2 in 1 Volume and Market Profile Indicator.
HVMP uses the base of VMP to offer a quick and simple view at multiple historic profiles at the same time.
This includes:
Cluster Identification for High Volume and Low Volume Areas.
Maximizing granularity by utilizing boxes and lines to get up to 1000 rows.
New Inclusions in HVMP vs VMP:
HVMP granularity is determined by the # of profiles on display. By doing this, each profile will get an even amount of allocated rows to use and granularity is scaled per-profile, to fit within the row allowance.
For Example: 1000/(# of profiles) = Maximum # of rows per profile.
HVMP introduces the "Auto-Scale" Option (on by Default), this automatically fits each profile within the defined timeframe period to provide a consistent display when switching timeframes.
Even with "Auto-Scale" enabled, "Display Size" dictates which direction the profile is displayed.
Below is a Negative Display Size (Displays from right to left, starting at the end of the period)
Below is a Positive Display Size (Displays from left to right, starting at the beginning of the period)
HVMP is only for historical data, you can get a live profile with the same Node Identification using VMP (Volume Market/Profile). The indicator that this one is based on.
Find it Here: Volume/Market Profile
Enjoy!

Retest Support Resistance Signals [ChartPrime]The Retest Support Resistance Signals Indicator is a powerful tool designed to assist traders in identifying key support and resistance levels within the market. Most importantly and uniquely it identifies retests of these structures and displays them on the trader's chart. By utilizing a combination of pivot points and price action analysis, this indicator offers valuable insights for both signal-based and support/resistance trading strategies.
Key Features & settings:
Retest Confirmation: The indicator waits for a break above a support or resistance level and observes subsequent price action. If price retraces and forms a wick below the level, followed by a bounce, the indicator identifies it as a retest and labels it as "R" to indicate potential support or resistance confirmation.
This indicator combines the benefits of signal-based trading and support/resistance analysis, providing users with a versatile trading tool suitable for various strategies.
Retest Weaker Toggle: Users have the option to enable or disable the retest weaker feature. When enabled, the indicator considers a support or resistance level weaker if it experiences a test. When disabled, the indicator assumes that a bounce may occur from the level.
Pivot Detection Customization: Users can adjust the pivot detection method based on either wicks or bodies. This flexibility allows traders to adapt the indicator to different market conditions and preferences. The trader can also customize the number of bars used for pivot detection on both the left and right sides. This feature enables traders to fine-tune the indicator's sensitivity and responsiveness.
Users also have control over how support or resistance levels are managed on the chart. They can choose to either stop updating the levels (freeze) or completely remove them (delete) from the chart.
Breakout Threshold Setting: Traders can adjust the breakout threshold until deletion setting. This setting determines the number of successful breakouts through a support or resistance level required to remove it from the chart. This feature helps filter out weaker levels and focus on more significant ones.
Shown above we see the retest labels in action denoted with an R label
This indicator can be a useful addition to an SR trader's toolkit. Identifying when a level in the market is retested can reveal interesting information about the underlying strength of a trend. This indicator has been designed with the two major schools of thought; a level gets weaker the more it's tested vs stronger the more it's tested. We have designed this therefore to be versatile and adapt to both thought procceses. The R labels should be taken and considered as a larger part of an analysis process and not followed blindly.

Earnings Yield & Dividend Yield (vs SP500, treasury, IG)# What's this script?
I created this because I wanted to compare the Earnings/Dividend yield of SP500 and the symbol with the time period of the chart.
Plot the following yields.
Earnings Yield of S&P500.
Calculated using S&P 500 Earnings by Month provided by Nasdaq date link.
(data.nasdaq.com)
Dividend Yield of S&P500.
Calculated using S&P 500 Dividend by Month provided by Nasdaq date link.
(data.nasdaq.com)
Earnings Yield of the displayed symbol.
Dividend Yield of the displayed symbol.
Treasury constant maturity rate. default is 10Y(FRED:DGS10).
Investment grade corporate bond yields by Moody's.
Grades from Aaa to Baa are represented by color bands.
Investment grade bond yields by BofA.
Grades from AAA to BBB are represented by color bands.
-----------
◇これなに?
request.quandl()を用いてSP500の益回りと配当利回りが得られますが
月間データなのでチャートの時間間隔でみたかったのと、
SP500とシンボルの益回りや配当利回りを比較したかったのでつくりました。
下記を表示します
- SP500の益回りと配当利回り
- 表示シンボルの益回りや配当利回り
- 設定画面で指定した財務省債券(デフォルトは10年)
- 投資適格社債(MoodysとBofAでかなり違ったので両方)をカラーバンドで表示
かんたんなものですけど、おやくにたてればさいわいです

SMA mechanical swing tradeIndicator that compares the closing price of an asset vs a simple moving average as a mechanical swing trading strategy. It allows the user to set any asset and timeframe for the strategy, which can be different from those the user is currently viewing. The strategy also allows the user to set an upside and downside tolerance so that retests within a few % of the SMA get some space to breathe before flipping directional bias.
If the selected asset in the strategy is different from the one currently viewed, the indicator plots the MA for the currently viewed asset but keeps applying the directional bias colors from the strategy asset.
Some examples of recommended usage of this indicator: BTCUSD 120D, BTCUSD 120D applied on ETHUSD, AAVEUSD 365D.

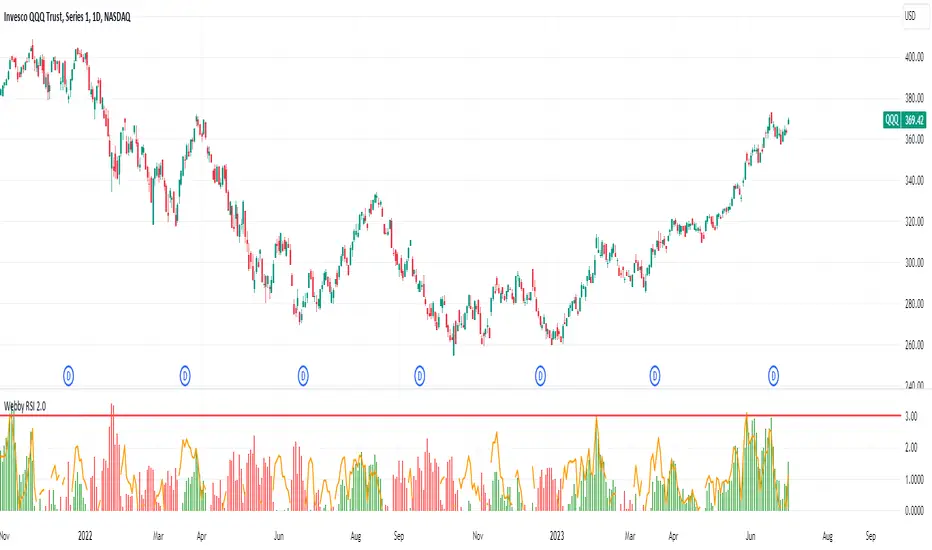
Webby's RSI 2.0Webby's RSI (Really Simple Indicator) 2.0 or version 5.150 as Mike himself calls it, builds upon the original Webby RSI by changing the way we measure extension from the 21-day exponential moving average.
Instead using the percentage of the low versus the 21-day exponential moving average, version 2 uses a multiple of the securities 50 day ATR (average true range) to determine the extension.
Version 2.0 also comes with some new additions, such as measuring the high vs 21-day exponential moving average when a security is below it, as well as an ATR extension from the 10-day simple moving average that Mike looks to as a guide to take partials.
Trend Correlation HeatmapHello everyone!
I am excited to release my trend correlation heatmap, or trend heatmap for short.
Per usual, I think its important to explain the theory before we get into the use of the indicator, so let's get into the theory!
The theory:
So what is a correlation?
Correlation is the relationship one variable has to another. Correlations are the basis of everything I do as a quantitative trader. From the correlation between the same variables (i.e. autocorrelation), the correlation between other variables (i.e. VIX and SPY, SPY High and SPY Low, DXY and ES1! close, etc.) and, as well, the correlation between price and time (time series correlation).
This may sound very familiar to you, especially if you are a user, observer or follower of my ideas and/or indicators. Ninety-five percent of my indicators are a function of one of those three things. Whether it be a time series based indicator (i.e.my time series indicator), whether it be autocorrelation (my autoregressive cloud indicator or my autocorrelation oscillator) or whether it be regressive in nature (i.e. my SPY Volume weighted close, or even my expected move which uses averages in lieu of regressive approaches but is foundational in regression principles. Or even my VIX oscillator which relies on the premise of correlations between tickers.) So correlation is extremely important to me and while its true I am more of a regression trader than anything, I would argue that I am more of a correlation trader, because correlations are the backbone of how I develop math models of stocks.
What I am trying to stress here is the importance of correlations. They really truly are foundational to any type of quantitative analysis for stocks. And as such, understanding the current relationship a stock has to time is pivotal for any meaningful analysis to be conducted.
So what is correlation to time and what does it tell us?
Correlation to time, otherwise known and commonly referred to as "Time Series", is the relationship a ticker's price has to the passing of time. It is displayed in the traditional Pearson Correlation Coefficient or R value and can be any value from -1 (strong negative relationship, i.e. a strong downtrend) to + 1 (i.e. a strong positive relationship, i.e. a strong uptrend). The higher or lower the value the stronger the up or downtrend is.
As such, correlation to time tells us two very important things. These are:
a) The direction of the stock; and
b) The strength of the trend.
Let's take a look at an example:
Above we have a chart of QQQ. We can see a trendline that seems to fit well. The questions we ask as traders are:
1. What is the likelihood QQQ breaks down from this trendline?
2. What is the likelihood QQQ continues up?
3. What is the likelihood QQQ does a false breakdown?
There are numerous mathematical approaches we can take to answer these questions. For example, 1 and 2 can be answered by use of a Cumulative Distribution Density analysis (CDDA) or even a linear or loglinear regression analysis and 3 can be answered, more or less, with a linear regression analysis and standard error ascertainment, or even just a general comparison using a data science approach (such as cosine similarity or Manhattan distance).
But, the reality is, all 3 of these questions can be visualized, at least in some way, by simply looking at the correlation to time. Let's look at this chart again, this time with the correlation heatmap applied:
If we look at the indicator we can see some pivotal things. These are:
1. We have 4, very strong uptrends that span both higher AND lower timeframes. We have a strong uptrend of 0.96 on the 5 minute, 50 candle period. We have a strong uptrend at the 300 candle lookback period on the 1 minute, we have a strong uptrend on the 100 day lookback on the daily timeframe period and we have a strong uptrend on the 5 minute on the 500 candle lookback period.
2. By comparison, we have 3 downtrends, all of which have correlations less than the 4 uptrends. All of the downtrends have a correlation above -0.8 (which we would want lower than -0.8 to be very strong), and all of the uptrends are greater than + 0.80.
3. We can also see that the uptrends are not confined to the smaller timeframes. We have multiple uptrends on multiple timeframes and both short term (50 to 100 candles) and long term (up to 500 candles).
4. The overall trend is strengthening to the upside manifested by a positive Max Change and a Positive Min change (to be discussed later more in-depth).
With this, we can see that QQQ is actually very strong and likely will continue at least some upside. If we let this play out:
We continued up, had one test and then bounced.
Now, I want to specify, this indicator is not a panacea for all trading. And in relation to the 3 questions posed, they are best answered, at least quantitatively, not only by correlation but also by the aforementioned methods (CDDA, etc.) but correlation will help you get a feel for the strength or weakness present with a stock.
What are some tangible applications of the indicator?
For me, this indicator is used in many ways. Let me outline some ways I generally apply this indicator in my day and swing trading:
1. Gauging the strength of the stock: The indictor tells you the most prevalent behavior of the stock. Are there more downtrends than uptrends present? Are the downtrends present on the larger timeframes vs uptrends on the shorter indicating a possible bullish reversal? or vice versa? Are the trends strengthening or weakening? All of these things can be visualized with the indicator.
2. Setting parameters for other indicators: If you trade EMAs or SMAs, you may have a "one size fits all" approach. However, its actually better to adjust your EMA or SMA length to the actual trend itself. Take a look at this:
This is QQQ on the 1 hour with the 200 EMA with 200 standard deviation bands added. If we look at the heatmap, we can see, yes indeed 200 has a fairly strong uptrend correlation of 0.70. But the strongest hourly uptrend is actually at 400 candles, with a correlation of 0.91. So what happens if we change the EMA length and standard deviation to 400? This:
The exact areas are circled and colour coded. You can see, the 400 offers more of a better reference point of supports and resistances as well as a better overall trend fit. And this is why I never advocate for getting married to a specific EMA. If you are an EMA 200 lover or 21 or 51, know that these are not always the best depending on the trend and situation.
Components of the indicator:
Ah okay, now for the boring stuff. Let's go over the functionality of the indicator. I tried to keep it simple, so it is pretty straight forward. If we open the menu here are our options:
We have the ability to toggle whichever timeframes we want. We also have the ability to toggle on or off the legend that displays the colour codes and the Max and Min highest change.
Max and Min highest change: The max and min highest change simply display the change in correlation over the previous 14 candles. An increasing Max change means that the Max trend is strengthening. If we see an increasing Max change and an increasing Min change (the Min correlation is moving up), this means the stock is bullish. Why? Because the min (i.e. ideally a big negative number) is going up closer to the positives. Therefore, the downtrend is weakening.
If we see both the Max and Min declining (red), that means the uptrend is weakening and downtrend is strengthening. Here are some examples:
Final Thoughts:
And that is the indicator and the theory behind the indicator.
In a nutshell, to summarize, the indicator simply tracks the correlation of a ticker to time on multiple timeframes. This will allow you to make judgements about strength, sentiment and also help you adjust which tools and timeframes you are using to perform your analyses.
As well, to make the indicator more user friendly, I tried to make the colours distinctively different. I was going to do different shades but it was a little difficult to visualize. As such, I have included a toggle-able legend with a breakdown of the colour codes!
That's it my friends, I hope you find it useful!
Safe trades and leave your questions, comments and feedback below!

Regression Candle Conversion IndicatorHey everyone!
I got a pseudo-request a while ago for something like this, essentially the ability to track where another ticker would fall based on an alternative ticker.
I did create my ticker correlation reference indicator which directly looks at the correlation between 2 tickers. However, this is an indicator that operates on the same principle but is more pragmatic for trading.
What does it do?
Well, in keeping with the theme of what I call my indicators, this has a title that explains exactly what it does, "Regression Candle Conversion Indicator" or "RCCI" for short. It uses simple regression to convert one ticker to another. So while you are tracking one indicator, you can see where the expected value should fall on the other.
Applications?
The big application of this for me is being able to track where SPY/QQQ or IWM is falling during overnight trading sessions. Extended trading hours close at 8 pm NYSE time. After that, you have to guess where futures prices will put the ETF version of it. This indicator will allow you to track where, theoretically, the underlying ETF ticker will fall based on the current trading behaviour.
Some other applications are just the ability to track how similar or dissimilar one stock is to the other. For example, if we wanted to trade, say, Boeing using shares of DFEN or ITA (a defence specific ETF), here is what we get:
In the chart above we can see BA as the primary chart and ITA as the RCCI converted chart. We will see 2 major things that should cause us concern.
First, there is a really poor correlation between the two tickers. This indicates that ITA may not produce the best exposure if I am directly looking for Boeing exposure.
Second, there is a wide standard error. this means that the results that the RCCI is providing may be skewed up to +/- 2 points (as indicated by the standard error chart).
Let's take a look at BA and DFEN:
In the above, we can see that the correlation is not great, but the standard error is quite low.
This means that, while this may not be the best ticker for Boeing exposure, the RCCI is able to confidently calculate the ticker within +/- 0.50 cents based on BA's underlying data.
However, its important to note that it is not advisable to really rely on these results if the correlation is less than + 0.5 or greater than -0.5.
Let's take a look at a few more examples:
Above we have BA (NYSE) vs BA (NEO TSX CAD Hedged). We can see the strong relationship and high confidence calculations.
And some others:
SPX (primary) and ES1! (secondary):
RTY and IWM:
ES1! and SPY:
Customizations:
As you can see above, it is pretty straight forward. There are 3 options:
Lookback Length: Determines the length of assessment for correlation and the regression assessment.
Manual Ticker Input: The indicator will pull the data from your current chart and compare it against a manually selected indicator. You must tell the indicator which ticker you are comparing against.
Data Table: This will show you the data table which contains the standard error assessment and the correlation assessment. These are determined by your lookback length. The lookback length is defaulted to 500.
And that's the indicator! It's pretty straight forward. Hopefully you find it helpful, especially if you track futures during overnight sessions.
Leave your comments/questions and feedback below.
Thanks for checking it out!

Z-Score Candles with ReversalsIn the process of releasing some of my Z-Score based indicators. This is the Z-Score Candle indicator.
What it does:
This converts the current candles into a z-score based candle over a 14 period lookback (adjustable but recommended to leave at 14).
It plots out the overbought/oversold areas using colours and will lookback over a user defined period of time to identify previous areas of bullish and bearish reversals.
Why Z-Score Candles?
Before we get into how to use it, I think its important to discuss why converting candles to a Z-Score is advantageous.
When we convert candlesticks to Z-Score, we have the ability to view areas of natural mathematical support and resistance (I want to clarify, when I saw mathematical support and resistance, it is kind of a misnomer, it is not the same as technical support and resistance. Its a measure of the natural tendency of things to revert to their mean and not deviate to extreme poles of their mean for prolonged period of time, I use the term mathematical support and resistance as it is something most traders are familiar with and operates similarly).
This is particularly helpful during trends. For example, if we take a look at the following BA chart:
In the chart above, you can see that despite BA not being on technical support (that red line), the indicator identified math support (the support was identified by the indicator looking at BA's natural deviations from its mean and seeing that, at that particular point in time, BA had deviated to an area that traditionally leads to reversals to the upside).
If we look at another example:
We can see in the chart above that, despite BA making a new high on the day and "breaking out" of previous resistance, BA was at math resistance being 3.0 Standard Deviations from its trading mean at the time. Thus, necessitating the pullback you see in the chart.
How to use it:
The indicator can be used similar to RSI and Stochastics or any other oscillator based indicator. The difference is, you can actually see the price action in terms of its relationship to its mean. What the means, is the indicator displays the current price action in terms of the ticker's relationship to its current mean and average. This permits us to see areas of rejection and support in relation to its current distance from neutrality. We can also see the various positions of each of the ticker's values from the mean. For example, we can see where the open is in relation to the average, the high and the low vs simply looking at a single variable (usually the close price).
The indicator will also highlight areas where the ticker has deviated to extreme ends of its mean (defined at a Z-Score of +/- 3.0). The picture below is an example of a bearish extreme:
And a bullish extreme:
You can see in both cases a reversal resulted almost immediately.
Inputs:
In the chart above, you can see the 3 main input sections.
Z-Score Lookback: This determines the lookback length for the Z-Score. The recommendation is to leave at 14, especially if you are a day trader.
SMA Inputs: The SMA (The white line) can be toggled off and on. You can also change the source to the High, Low, Close and Open Z-Score. You can adjust the lookback length of the SMA to your liking to assess trends. It does not need to be the same input as the Z-Score.
Reversal Inputs: The reversal inputs determines the length of lookback for the indicator to determine the most extreme bearish and bullish deviation from its mean. It is defaulted at 75 but can be adjusted based on preference. For more frequent signals, you can reduce the lookback length but be prepared for false signals in that case. You can also toggle off the reversal labels if you do not want them.
Concluding remarks:
And that is the Z-Score Candle indicator in a nutshell. Pretty self explanatory otherwise. It is more tailored to day traders. It is not a tool I would necessarily use for longer-term outlooks. I would use a simple Z-Score based indicator for that. But for active day trading, this is very helpful. That said, it can be used to look at longer term outlooks as well, but there are more powerful Z-Score based indicators for that (you can check out my own Z-Score indicator or my recently released Z-Score Probability Indicator which is more tailored for bigger picture outlooks).
Hope you enjoy, as always leave your comments, suggestions and questions below!
Safe trades to all!

Period Candle CounterThis is a very simple utility indicator.
Shockingly nothing similar was available and I really needed something to quickly count period lengths by candles (to make adjustments to indicators based on a desired lookback timeframe), so I created this.
I thought I would share it because chances are if I needed something like this, other people may need it, too.
What it does:
Its really simple and this really truly is just a utility indicator that gives you raw information to make adjustments to other indicators. It just counts the number of candles in a user defined period of time.
It will count the number of red candles, green candles and then display the total candle count.
It will also display in percent (i.e. 52% green candles vs 48% red candles, etc.).
Its point and click, so once launched you just click the area you want to start the count and click the area you want to end the count.
Purpose:
Personally, I use it to make adjustments to timeframe lengths on indicators that look at averages and also on my time series indicator. If I want the price average or range for a specific period in time (say, the past 1.5 days of an uptrend), I will use this to count the candles in that period so that I can manually adjust whichever indicator to the correct lookback length, as most indicators are adjusted by candle length (i.e. 1 candle, 2 candles, 3 candles, etc.)
And that's it, pretty straight forward. Honestly pretty boring but its actually really pivotal for me to make adjustments to certain indicators.
Hope you find it helpful, too!
Safe trades!

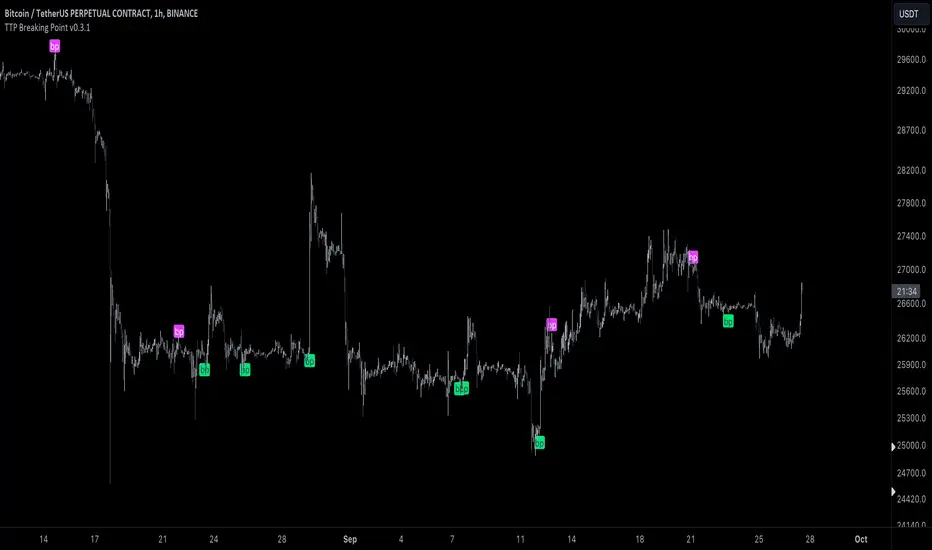
TTP Breaking PointThis signal uses information from BITFINEX:BTCUSDLONGS and BITFINEX:BTCUSDSHORTS to forecast tops and bottoms.
The idea behind is very simple.
We calculate the RSI of the ratio of longs vs shorts and find areas where both the SMA of this RSI and the RSI itself are overextended.
You might notice that the win rate is not high but most of the wins provide a decent move that, if combined with proper risk management, can be used to build profitable strategies.
The signal offers a backtesting stream: 1 for buy and 2 for sell.
Shortly I'll be adding new features including: alerts, support for other symbols, filters, etc.