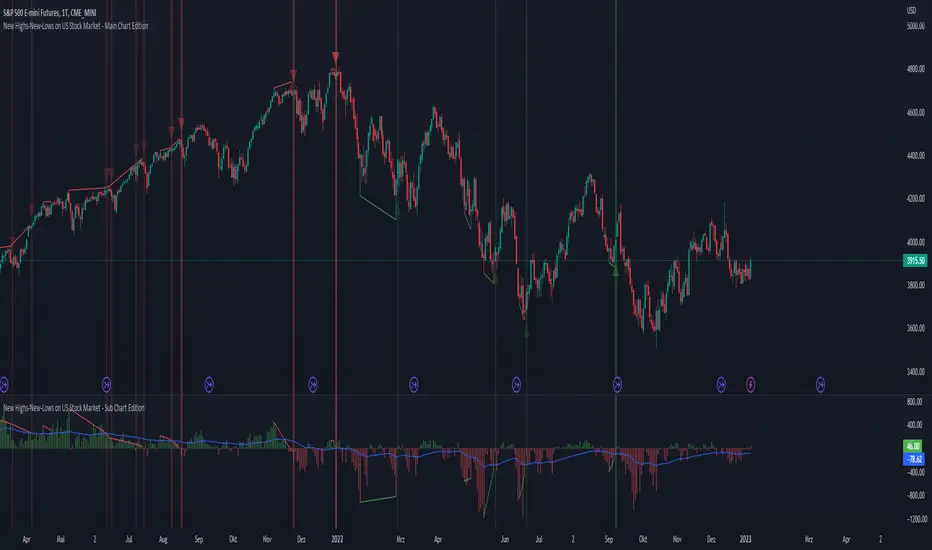
New Highs-New-Lows on US Stock Market - Main Chart Edition#### ENGLISH ####
This script visualizes divergences between the price and new highs and new lows in the US stock market. The indicator should be used exclusively on the US stock indices (timeframe >= D).
This is the indicator for the main chart. It should be used together with the subchart indicator of the same name. In order to get the same results between the main and subchart editions, the indicator settings must be manually adjusted equally in both charts.
The approach:
Let's take a bull market as an example. A bull market is characterized by rising highs and rising lows. We can therefore assume that with the rising prices, the number of stocks that form new highs also rises or at least remains constant. This confirms the upward trend and thus expresses that it is supported by the broad stock market. If the market forms new highs and the number of stocks forming new highs decreases at the same moment, these new index highs are no longer supported by the broad stock market but exclusively by a few highly capitalized stocks. This creates a bearish divergence between the index and the NHNL indicator. This means that the uptrend tends to be overheated and a correction becomes more likely. Stops should be drawn closer.
The approach applies conversely, of course, to downtrends as well.
The indicator itself:
The number of new highs and lows (NHNL) are determined using the data sources included in Tradingview, such as "INDEX:HIGN" for NYSE highs. This data is provided on a daily basis. For higher time units (week, month) the daily numbers are shown summed up and not only the Friday value like most other NHNL indicators.
The signal strength is determined on the basis of two factors. The stronger the signal, the clearer (less transparent) the line/arrow. The two factors are on the one hand the strength of the divergence in and of itself, and on the other hand the strength of the overriding trend. The trend strength is determined using a 50 EMA on the NHNL indicator.
To avoid displaying every small divergence and to reduce false signals, the threshold for the signal strength can be set in the indicator settings.
#### GERMAN #####
Dieses script visualisiert Divergenzen zwischen dem Preis und neuer Hochs sowie neuer Tiefs im US Aktienmarkt. Der Indikator sollte ausschließlich auf den US Aktienindizes verwendet werden (Timeframe >= D).
Dies ist der Indikator für den Hauptchart. Er sollte zusammen mit dem gleichnamigen Subchart Indikator verwendet werden. Um gleiche Ergebnisse zwischen Haupt- und Subchart Edition zu erhalten, müssen die Indikatoreistellung manuell in beiden Charts gleichermaßen eigestellt werden.
Der Ansatz:
Nehmen wir uns als Beispiel einen Bullenmarkt. Ein Bullenmarkt zeichnet sich durch steigende Hochs und steigende Tiefs aus. Man kann also annehmen, dass mit den steigenden Preisen auch die Anzahl der Aktien die neuen Hochs ausbilden steigt oder zumindest konstant bleibt. Dies bestätigt den Aufwärtstrend und drückt somit aus, dass dieser vom breiten Aktienmarkt mitgetragen wird. Wenn der Markt neue Hochs bildet und die Anzahl der Aktien, die neue Hochs bilden im selben Moment sinkt, so werden diese neuen Indexhochs vom breiten Aktienmarkt nicht mehr getragen sonder ausschließlich von wenigen hochkapitalisierten Aktien. Es entsteht eine bärische Divergenz zwischen Index und dem NHNL Indikator. Das bedeutet, dass der Aufwärtstrend tendenziell überhitzt ist und ein Korrektur wahrscheinlicher wird. Die Stops sollten näher herangezogen werden.
Der Ansatz gilt umgekehrt natürlich auch bei Abwärtstrends.
Der Indikator an sich:
Die Anzahl der neuen Hochs und Tiefs (NHNL) werden anhand der in Tradingview enthaltenen Datenquellen wie z.B. "INDEX:HIGN" für die NYSE Hochs ermittelt. Diese Daten werden auf Tagesbasis bereitgestellt. Für höher Zeiteinheiten (Woche, Monat) werden die Tageszahlen aufsummiert dargestellt und nicht wie bei den meisten anderen NHNL Indikatoren nur der Freitagswert.
Die Signalstärke wird Anhand zweier Faktoren ermittelt. Je stärker das Signal um so deutlicher (weniger transparent) die Linie/der Pfeil. Die zwei Faktoren sind zum einen die stärke der Divergenz an und für sich, sowie zum anderen die Stärke des übergeordneten Trends. Die Trendstärke wird anhand eines 50er-EMA auf den NHNL-Indikator ermittelt.
Um nicht jede kleine Divergenz anzuzeigen und um Fehlsignale zu reduzieren, kann die Schwelle für die Signalstärke in den Indikatoreinstellungen festgelegt werden.
"主板非ST非次新股中,竞价排名前5的股票列表" için komut dosyalarını ara
New Highs-New-Lows on US Stock Market - Sub Chart Edition#### ENGLISH ####
This script visualizes divergences between the price and new highs and new lows in the US stock market. The indicator should be used exclusively on the US stock indices (timeframe >= D).
This is the indicator for the sub chart. It should be used together with the main chart indicator of the same name. In order to get the same results between the main and subchart editions, the indicator settings must be manually adjusted equally in both charts.
The approach:
Let's take a bull market as an example. A bull market is characterized by rising highs and rising lows. We can therefore assume that with the rising prices, the number of stocks that form new highs also rises or at least remains constant. This confirms the upward trend and thus expresses that it is supported by the broad stock market. If the market forms new highs and the number of stocks forming new highs decreases at the same moment, these new index highs are no longer supported by the broad stock market but exclusively by a few highly capitalized stocks. This creates a bearish divergence between the index and the NHNL indicator. This means that the uptrend tends to be overheated and a correction becomes more likely. Stops should be drawn closer.
The approach applies conversely, of course, to downtrends as well.
The indicator itself:
The number of new highs and lows (NHNL) are determined using the data sources included in Tradingview, such as "INDEX:HIGN" for NYSE highs. This data is provided on a daily basis. For higher time units (week, month) the daily numbers are shown summed up and not only the Friday value like most other NHNL indicators.
The signal strength is determined on the basis of two factors. The stronger the signal, the clearer (less transparent) the line/arrow. The two factors are on the one hand the strength of the divergence in and of itself, and on the other hand the strength of the overriding trend. The trend strength is determined using a 50 EMA on the NHNL indicator.
To avoid displaying every small divergence and to reduce false signals, the threshold for the signal strength can be set in the indicator settings.
#### GERMAN #####
Dieses script visualisiert Divergenzen zwischen dem Preis und neuer Hochs sowie neuer Tiefs im US Aktienmarkt. Der Indikator sollte ausschließlich auf den US Aktienindizes verwendet werden (Timeframe >= D).
Dies ist der Indikator für den Subchart. Er sollte zusammen mit dem gleichnamigen Hauptchart Indikator verwendet werden. Um gleiche Ergebnisse zwischen Haupt- und Subchart Edition zu erhalten, müssen die Indikatoreistellung manuell in beiden Charts gleichermaßen eigestellt werden.
Der Ansatz:
Nehmen wir uns als Beispiel einen Bullenmarkt. Ein Bullenmarkt zeichnet sich durch steigende Hochs und steigende Tiefs aus. Man kann also annehmen, dass mit den steigenden Preisen auch die Anzahl der Aktien die neuen Hochs ausbilden steigt oder zumindest konstant bleibt. Dies bestätigt den Aufwärtstrend und drückt somit aus, dass dieser vom breiten Aktienmarkt mitgetragen wird. Wenn der Markt neue Hochs bildet und die Anzahl der Aktien, die neue Hochs bilden im selben Moment sinkt, so werden diese neuen Indexhochs vom breiten Aktienmarkt nicht mehr getragen sonder ausschließlich von wenigen hochkapitalisierten Aktien. Es entsteht eine bärische Divergenz zwischen Index und dem NHNL Indikator. Das bedeutet, dass der Aufwärtstrend tendenziell überhitzt ist und ein Korrektur wahrscheinlicher wird. Die Stops sollten näher herangezogen werden.
Der Ansatz gilt umgekehrt natürlich auch bei Abwärtstrends.
Der Indikator an sich:
Die Anzahl der neuen Hochs und Tiefs (NHNL) werden anhand der in Tradingview enthaltenen Datenquellen wie z.B. "INDEX:HIGN" für die NYSE Hochs ermittelt. Diese Daten werden auf Tagesbasis bereitgestellt. Für höher Zeiteinheiten (Woche, Monat) werden die Tageszahlen aufsummiert dargestellt und nicht wie bei den meisten anderen NHNL Indikatoren nur der Freitagswert.
Die Signalstärke wird Anhand zweier Faktoren ermittelt. Je stärker das Signal um so deutlicher (weniger transparent) die Linie/der Pfeil. Die zwei Faktoren sind zum einen die stärke der Divergenz an und für sich, sowie zum anderen die Stärke des übergeordneten Trends. Die Trendstärke wird anhand eines 50er-EMA auf den NHNL-Indikator ermittelt.
Um nicht jede kleine Divergenz anzuzeigen und um Fehlsignale zu reduzieren, kann die Schwelle für die Signalstärke in den Indikatoreinstellungen festgelegt werden.

Multi-Timeframe (MTF) Dashboard by RiTzMulti-Timeframe Dashboard
Shows values of different Indiactors on Multiple-Timeframes for the selected script/symbol
VWAP : if LTP is trading above VWAP then Bullish else if LTP is trading below VWAP then Bearish.
ST(21,1) : if LTP is trading above Supertrend (21,1) then Bullish , else if LTP is trading below Supertrend (21,1) then Bearish.
ST(14,2) : if LTP is trading above Supertrend (14,2) then Bullish , else if LTP is trading below Supertrend (14,2) then Bearish.
ST(10,3) : if LTP is trading above Supertrend (10,3) then Bullish , else if LTP is trading below Supertrend (10,3) then Bearish.
RSI(14) : Shows value of RSI (14) for the current timeframe.
ADX : if ADX is > 75 and DI+ > DI- then "Bullish ++".
if ADX is < 75 but >50 and DI+ > DI- then "Bullish +".
if ADX is < 50 but > 25 and DI+ > DI- then "Bullish".
if ADX is above 75 and DI- > DI+ then "Bearish ++".
if ADX is < 75 but > 50 and DI- > DI+ then "Bearish+".
if ADX is < 50 but > 25 and DI- > DI+ then "Bearish".
if ADX is < 25 then "Neutral".
MACD : if MACD line is above Signal Line then "Bullish", else if MACD line is below Signal Line then "Bearish".
PH-PL : "< PH > PL" means LTP is trading between Previous Timeframes High(PH) & Previous Timeframes Low(PL) which indicates Rangebound-ness.
"> PH" means LTP is trading above Previous Timeframes High(PH) which indicates Bullish-ness.
"< PL" means LTP is trading below Previous Timeframes Low(PL) which indicates Bearish-ness.
Alligator : If Lips > Teeth > Jaw then Bullish.
If Lips < Teeth < Jaw then Bearish.
If Lips > Teeth and Teeth < Jaw then Neutral/Sleeping.
If Lips < Teeth and Teeth > Jaw then Neutral/Sleeping.
Settings :
Style settings :-
Dashboard Location: Location of the dashboard on the chart
Dashboard Size: Size of the dashboard on the chart
Bullish Cell Color: Select the color of cell whose value is showing Bullish-ness.
Bearish Cell Color: Select the color of cell whose value is showing Bearish-ness.
Neutral Cell Color: Select the color of cell whose value is showing Rangebound-ness.
Cell Transparency: Select Transparency of cell.
Column Settings :-
You can select which Indicators values should be displayed/hidden.
Timeframe Settings :-
You can select which timeframes values should be displayed/hidden.
Note :- I'm not a pro Developer/Coder , so if there are any mistakes or any suggestions for improvements in the code then do let me know!
Note :- Use in Live market , might show wrong values for timeframes other than current timeframe in closed market!!

Nifty / Banknifty Dashboard by RiTzNifty / Banknifty Dashboard :
Shows Values of different Indicators on current Timeframe for the selected Index & it's main constituents according to weightage in index.
customized for Nifty & Banknifty (You can customize it according to your needs for the markets/indexes you trade in)
Interpretation :-
VWAP : if LTP is trading above VWAP then Bullish else if LTP is trading below VWAP then Bearish.
ST(21,1) : if LTP is trading above Supertrend (21,1) then Bullish , else if LTP is trading below Supertrend (21,1) then Bearish.
ST(14,2) : if LTP is trading above Supertrend (14,2) then Bullish , else if LTP is trading below Supertrend (14,2) then Bearish.
ST(10,3) : if LTP is trading above Supertrend (10,3) then Bullish , else if LTP is trading below Supertrend (10,3) then Bearish.
RSI(14) : Shows value of RSI (14) for the current timeframe.
ADX : if ADX is > 75 and DI+ > DI- then "Bullish ++".
if ADX is < 75 but >50 and DI+ > DI- then "Bullish +".
if ADX is < 50 but > 25 and DI+ > DI- then "Bullish".
if ADX is above 75 and DI- > DI+ then "Bearish ++".
if ADX is < 75 but > 50 and DI- > DI+ then "Bearish+".
if ADX is < 50 but > 25 and DI- > DI+ then "Bearish".
if ADX is < 25 then "Neutral".
MACD : if MACD line is above Signal Line then "Bullish", else if MACD line is below Signal Line then "Bearish".
PDH-PDL : "< PDH > PDL" means LTP is trading between Previous Days High(PDH) & Previous Days Low(PDL) which indicates Rangebound-ness.
"> PDH" means LTP is trading above Previous Days High(PDH) which indicates Bullish-ness.
"< PDL" means LTP is trading below Previous Days Low(PDL) which indicates Bearish-ness.
Alligator : If Lips > Teeth > Jaw then Bullish.
If Lips < Teeth < Jaw then Bearish.
If Lips > Teeth and Teeth < Jaw then Neutral/Sleeping.
If Lips < Teeth and Teeth > Jaw then Neutral/Sleeping.
Settings :
Style settings :-
Dashboard Location: Location of the dashboard on the chart
Dashboard Size: Size of the dashboard on the chart
Bullish Cell Color: Select the color of cell whose value is showing Bullish-ness.
Bearish Cell Color: Select the color of cell whose value is showing Bearish-ness.
Neutral Cell Color: Select the color of cell whose value is showing Rangebound-ness.
Cell Transparency: Select Transparency of cell.
Columns Settings :-
You can select which Indicators values should be displayed/hidden.
Rows Settings :-
You can select which Stocks/Symbols values should be displayed/hidden.
Symbol Settings :-
Here you can select the Index & Stocks/Symbols
Dashboard for Index : select Nifty/Banknifty
if you select Nifty then Nifty spot, Nifty current Futures and the stocks with most weightage in Nifty index will be displayed on the Dashboard/Table.
if you select Banknifty then Banknifty spot, Banknifty current Futures and the stocks with most weightage in Banknifty index will be displayed on the Dashboard/Table.
You can Customise it according to your needs, you can choose any Symbols you want to use.
Note :- This is inspired from "RankDelta" by AsitPati and "Nifty and Bank Nifty Dashboard v2" by cvsk123 (Both these scripts are closed source!)
I'm not a pro Developer/Coder , so if there are any mistakes or any suggestions for improvements in the code then do let me know!

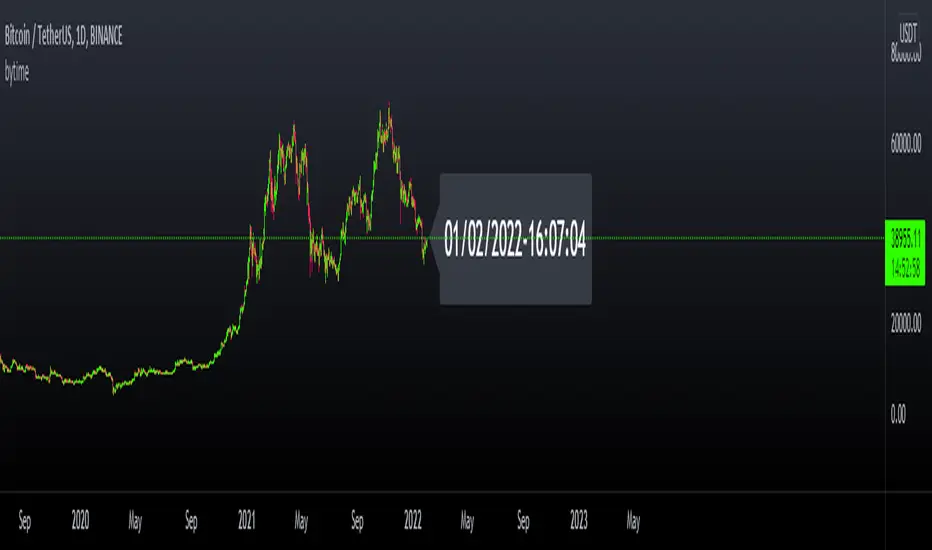
bytimeLibrary "bytime"
TODO: to do something at the specified time.
////Return =>> ht = hour , mt = minute , st = second ,Dt = Day, Mt = month, Yt = year , dateTime = full time format./////////////
Note : Remember to always add import when you call our library and change Gtime() to Timeset.Gtime() is used to access internal data.
import hapharmonic/bytime/1 as Timeset
=Timeset.Gtime()
/////////////Set a time to trigger an alert./////////////
ck = false
///hour : minute : second
if ht == TH and mt == TM and st == TS
//some action
//...
//.
ck := true
Gtime()
VPA ANALYSIS VPA Analysis provide the indications for various conditions as per the Volume Spread Analysis concept. The various legends are provided below
LEGEND DETAILS
UT1 - Upthrust Bar: This will be widespread Bar on high Volume closing on the low. This normally happens after an up move. Here the smart money move the price to the High and then quickly brings to the Low trapping many retail trader who rushed into in order not to miss the bullish move. This is a bearish Signal
UT2 -Upthrust Bar Confirmation: A widespread Down Bar following a Upthrust Bar. This confirms the weakness of the Upthrust Bar. Expect the stock to move down
Confirms . This is a Bearish Signal
PUT - Pseudo Upthrust: An Upthrust Bar in bar action but the volume remains average. This still indicates weakness. Indicate Possible Bearishness
PUC -Pseudo Upthrust Confirmation: widespread Bar after a pseudo–Upthrust Bar confirms the weakness of the Pseudo Upthrust Bar
Confirms Bearishness
BC - Buying Climax: A very wide Spread bar on ultra-High Volume closing at the top. Such a Bar indicates the climatic move in an uptrend. This Bar traps many retailers as the uptrend ends and reverses quickly. Confirms Bearishness
TC - Trend Change: This Indicates a possible Trend Change in an uptrend. Indicates Weakness
SEC- Sell Condition: This bar indicates confluence of some bearish signals. Possible end of Uptrend and start of Downtrend soon. Bearish Signal
UT - Upthrust Condition: When multiple bearish signals occur, the legend is printed in two lines. The Legend “UT” indicates that an upthrust condition is present. Bearish Signal
ND - No demand in uptrend: This bar indicates that there is no demand. In an uptrend this indicates weakness. Bearish Signal
ND - No Demand: This bar indicates that there is no demand. This can occur in any part of the Trend. In all place other than in an uptrend this just indicates just weakness
ED - Effort to Move Down: Widespread Bar closing down on High volume or above average volume . The smart money is pushing the prices down. Bearish Signal
EDF - Effort to Move Down Failed: Widespread / above average spread Bar closing up on High volume or above average volume appearing after ‘Effort to move down” bar.
This indicates that the Effort to move the pries down has failed. Bullish signal
SV - Stopping Volume: A high volume medium to widespread Bar closing in the upper middle part in a down trend indicates that smart money is buying. This is an indication that the down trend is likely to end soon. Indicates strength
ST1 - Strength Returning 1: Strength seen returning after a down trend. High volume adds to strength. Indicates Strength
ST2 - Strength Returning 2: Strength seen returning after a down trend. High volume adds to strength.
BYC - Buy Condition: This bar indicates confluence of some bullish signals Possible end of downtrend and start of uptrend soon. Indicates Strength
EU - Effort to Move Up: Widespread Bar closing up on High volume or above average volume . The smart money is pushing the prices up. Bullish Signal
EUF - Effort to Move Up Failed: Widespread / above average spread Bar closing down on High volume or above average volume appearing after ‘Effort to move up” bar.
This indicates that the Effort to move the pries up has failed. Bearish Signal
LVT- Low Volume Test: A low volume bar dipping into previous supply area and closing in the upper part of the Bar. A successful test is a positive sign. Indicates Strength
ST(after a LVT ) - Strength after Successful Low Volume Test: An up Bar closing near High after a Test confirms strength. Bullish Signal
RUT - Reverse Upthrust Bar: This will be a widespread Bar on high Volume closing on the high is a Down Trend. Here the buyers have become active and move the prices from the low to High. The down Move is likely to end and up trend likely to start soon. indicates Strength
NS - No supply Bar: This bar indicates that there is no supply. This is a sign of strength especially in a down trend. Indicates strength
ST - Strength Returns: When multiple bullish signals occur, the legend is printed in two lines. The Legend “ST” indicates that an condition of strength other than the condition mentioned in the second line is present. Bullish Signals
BAR COLORS
Green- Bullish / Strength
Red - Bearish / weakness
Blue / White - Sentiment Changing from bullish to Bearish and Vice Versa

SuperTrendRange by DGTSuperTrendRange study attempts to determine the state of the market
• whether a well-established bull/bear trend is present
• whether the market is trading in a range
SuperTrendRange (STR) takes into account the volatility of the market - further details regarding volatility can be found in the description of “Volatility Bands by DGT” study
Due to its similarities to SupertTrend (ST) and Parabolic SAR (SAR), I will try to explain by stating differences between them
SuperTrendRange uses both the ATR (Average True Range) and STDEV (Standard Deviation) as part of its calculations - unlike ST and SAR where they use only ATR
Sensitivity of the indicator is adjusted using the multiplier setting of both ATR and STDEV
Additionally, unlike ST, the source of the basis of SuperTrendRange can be selected among the assets price value or its moving average
Source and Length are adjustable too
The SuperTrendRange, like Parabolic SAR indicator, appears on a chart as a series of dots, either above, below or unlike Parabolic SAR both above and below of the asset's price
A dot placed
- below the price when the market is trending upward
- above the price when it is trending downward
- both above and below when the price starts moving sideways – this is a feature that both SuperTrend and Parabolic SAR misses, where they are known to produce false signals and losing trades, whereas SuperTrendRange emphasis the zones of the ranges occurring and in most cases are considered no trade recommended zones. Please note that the range width may vary depending on how the market is volatile. It is up to the users to trade if it fits their trading strategies
Dots plotted above and below can be assumed as Support and Resistance levels
Example usages – with trading opportunities
Gold Monthly Chart
Bitcoin Daily Chart
Disclaimer:
Trading success is all about following your trading strategy and the indicators should fit within your trading strategy, and not to be traded upon solely
The script is for informational and educational purposes only. Use of the script does not constitute professional and/or financial advice. You alone have the sole responsibility of evaluating the script output and risks associated with the use of the script. In exchange for using the script, you agree not to hold dgtrd TradingView user liable for any possible claim for damages arising from any decision you make based on use of the script

phx_liq_tlLibrary "phx_liq_tl"
new_state()
update(st, len, cup, cdn, space, proximity_pct, shs)
Parameters:
st (LTState)
len (int)
cup (color)
cdn (color)
space (float)
proximity_pct (float)
shs (bool)
LTState
Fields:
upln (array)
dnln (array)
upBroken (series bool)
dnBroken (series bool)

Supertrend DashboardOverview
This dashboard is a multi-timeframe technical indicator dashboard based on Supertrend. It combines:
Trend detection via Supertrend
Momentum via RSI and OBV (volume)
Volatility via a basic candle-based metric (bs)
Trend strength via ADX
Multi-timeframe analysis to see whether the trend is bullish across different timeframes
It then displays this info in a table on the chart with colors for quick visual interpretation.
2️⃣ Inputs
Dashboard settings:
enableDashboard: Toggle the dashboard on/off
locationDashboard: Where the table appears (Top right, Bottom left, etc.)
sizeDashboard: Text size in the table
strategyName: Custom name for the strategy
Indicator settings:
factor (Supertrend factor): Controls how far the Supertrend lines are from price
atrLength: ATR period for Supertrend calculation
rsiLength: Period for RSI calculation
Visual settings:
colorBackground, colorFrame, colorBorder: Control dashboard style
3️⃣ Core Calculations
a) Supertrend
Supertrend is a trend-following indicator that generates bullish or bearish signals.
Logic:
Compute ATR (atr = ta.atr(atrLength))
Compute preliminary bands:
upperBand = src + factor * atr
lowerBand = src - factor * atr
Smooth bands to avoid false flips:
lowerBand := lowerBand > prevLower or close < prevLower ? lowerBand : prevLower
upperBand := upperBand < prevUpper or close > prevUpper ? upperBand : prevUpper
Determine direction (bullish / bearish):
dir = 1 → bullish
dir = -1 → bearish
Supertrend line = lowerBand if bullish, upperBand if bearish
Output:
st → line to plot
bull → boolean (true = bullish)
b) Buy / Sell Trigger
Logic:
bull = ta.crossover(close, supertrend) → close crosses above Supertrend → buy signal
bear = ta.crossunder(close, supertrend) → close crosses below Supertrend → sell signal
trigger → checks which signal was most recent:
trigger = ta.barssince(bull) < ta.barssince(bear) ? 1 : 0
1 → Buy
0 → Sell
c) RSI (Momentum)
rsi = ta.rsi(close, rsiLength)
Logic:
RSI > 50 → bullish
RSI < 50 → bearish
d) OBV / Volume Trend (vosc)
OBV tracks whether volume is pushing price up or down.
Manual calculation (safe for all Pine versions):
obv = ta.cum( math.sign( nz(ta.change(close), 0) ) * volume )
vosc = obv - ta.ema(obv, 20)
Logic:
vosc > 0 → bullish
vosc < 0 → bearish
e) Volatility (bs)
Measures how “volatile” the current candle is:
bs = ta.ema(math.abs((open - close) / math.max(high - low, syminfo.mintick) * 100), 3)
Higher % → stronger candle moves
Displayed on dashboard as a number
f) ADX (Trend Strength)
= ta.dmi(14, 14)
Logic:
adx > 20 → Trending
adx < 20 → Ranging
g) Multi-Timeframe Supertrend
Timeframes: 1m, 3m, 5m, 10m, 15m, 30m, 1H, 2H, 4H, 12H, 1D
Logic:
for tf in timeframes
= request.security(syminfo.tickerid, tf, f_supertrend(ohlc4, factor, atrLength))
array.push(tf_bulls, bull_tf ? 1.0 : 0.0)
bull_tf ? 1.0 : 0.0 → converts boolean to number
Then we calculate user rating:
userRating = (sum of bullish timeframes / total timeframes) * 10
0 → Strong Sell, 10 → Strong Buy
4️⃣ Dashboard Table Layout
Row Column 0 (Label) Column 1 (Value)
0 Strategy strategyName
1 Technical Rating textFromRating(userRating) (color-coded)
2 Current Signal Buy / Sell (based on last Supertrend crossover)
3 Current Trend Bullish / Bearish (based on Supertrend)
4 Trend Strength bs %
5 Volume vosc → Bullish/Bearish
6 Volatility adx → Trending/Ranging
7 Momentum RSI → Bullish/Bearish
8 Timeframe Trends 📶 Merged cell
9-19 1m → Daily Bullish/Bearish for each timeframe (green/red)
5️⃣ Color Logic
Green shades → bullish / trending / buy
Red / orange → bearish / weak / sell
Yellow → neutral / ranging
Example:
dashboard_cell_bg(1, 1, colorFromRating(userRating))
dashboard_cell_bg(1, 2, trigger ? color.green : color.red)
dashboard_cell_bg(1, 3, superBull ? color.green : color.red)
Makes the dashboard visually intuitive
6️⃣ Key Logic Flow
Calculate Supertrend on current timeframe
Detect buy/sell triggers based on crossover
Calculate RSI, OBV, Volatility, ADX
Request Supertrend on multiple timeframes → convert to 1/0
Compute user rating (percentage of bullish timeframes)
Populate dashboard table with colors and values
✅ The result: You get a compact, fast, multi-timeframe trend dashboard that shows:
Current signal (Buy/Sell)
Current trend (Bullish/Bearish)
Momentum, volatility, and volume cues
Trend across multiple timeframes
Overall technical rating
It’s essentially a full trend-strength scanner directly on your chart.

Deadband Hysteresis Supertrend [BackQuant]Deadband Hysteresis Supertrend
A two-stage trend tool that first filters price with a deadband baseline, then runs a Supertrend around that baseline with optional flip hysteresis and ATR-based adverse exits.
What this is
A hybrid of two ideas:
Deadband Hysteresis Baseline that only advances when price pulls far enough from the baseline to matter. This suppresses micro noise and gives you a stable centerline.
Supertrend bands wrapped around that baseline instead of raw price. Flips are further gated by an extra margin so side changes are more deliberate.
The goal is fewer whipsaws in chop and clearer regime identification during trends.
How it works (high level)
Deadband step — compute a per-bar “deadband” size from one of four modes: ATR, Percent of price, Ticks, or Points. If price deviates from the baseline by more than this amount, move the baseline forward by a fraction of the excess. If not, hold the line.
Centered Supertrend — build upper and lower bands around the baseline using ATR and a user factor. Track the usual trailing logic that tightens a band while price moves in its favor.
Flip hysteresis — require price to exceed the active band by an extra flip offset × ATR before switching sides. This adds stickiness at the boundary.
Adverse exit — once a side is taken, trigger an exit if price moves against the entry by K × ATR .
If you would like to check out the filter by itself:
What it plots
DBHF baseline (optional) as a smooth centerline.
DBHF Supertrend as the active trailing band.
Candle coloring by trend side for quick read.
Signal markers 𝕃 and 𝕊 at flips plus ✖ on adverse exits.
Inputs that matter
Price Source — series being filtered. Close is typical. HL2 or HLC3 can be steadier.
Deadband mode — ATR, Percent, Ticks, or Points. This defines the “it’s big enough to matter” zone.
ATR Length / Mult (DBHF) — only used when mode = ATR. Larger values widen the do-nothing zone.
Percent / Ticks / Points — alternatives to ATR; pick what fits your market’s convention.
Enter Mult — scales the deadband you must clear before the baseline moves. Increase to filter more noise.
Response — fraction of the excess applied to baseline movement. Higher responds faster; lower is smoother.
Supertrend ATR Period & Factor — traditional band size controls; higher factor widens and flips less often.
Flip Offset ATR — extra ATR buffer required to flip. Useful in choppy regimes.
Adverse Stop K·ATR — per-trade danger brake that forces an exit if price moves K×ATR against entry.
UI — toggle baseline, supertrend, signals, and bar painting; choose long and short colors.
How to read it
Green regime — candles painted long and the Supertrend running below price. Pullbacks toward the baseline that fail to breach the opposite band often resume higher.
Red regime — candles painted short and the Supertrend running above price. Rallies that cannot reclaim the band may roll over.
Frequent side swaps — reduce sensitivity by increasing Enter Mult, using ATR mode, raising the Supertrend factor, or adding Flip Offset ATR.
Use cases
Bias filter — allow entries only in the direction of the current side. Use your preferred triggers inside that bias.
Trailing logic — treat the active band as a dynamic stop. If the side flips or an adverse K·ATR exit prints, reduce or close exposure.
Regime map — on higher timeframes, the combination baseline + band produces a clean up vs down template for allocation decisions.
Tuning guidance
Fast markets — ATR deadband, modest Enter Mult (0.8–1.2), response 0.2–0.35, Supertrend factor 1.7–2.2, small Flip Offset (0.2–0.5 ATR).
Choppy ranges — widen deadband or raise Enter Mult, lower response, and add more Flip Offset so flips require stronger evidence.
Slow trends — longer ATR periods and higher Supertrend factor to keep you on side longer; use a conservative adverse K.
Included alerts
DBHF ST Long — side flips to long.
DBHF ST Short — side flips to short.
Adverse Exit Long / Short — K·ATR stop triggers against the current side.
Strengths
Deadbanded baseline reduces micro whipsaws before Supertrend logic even begins.
Flip hysteresis adds a second layer of confirmation at the boundary.
Optional adverse ATR stop provides a uniform risk cut across assets and regimes.
Clear visuals and minimal parameters to adjust for symbol behavior.
Putting it together
Think of this tool as two decisions layered into one view. The deadband baseline answers “does this move even count,” then the Supertrend wrapped around that baseline answers “if it counts, which side should I be on and where do I flip.” When both parts agree you tend to stay on the correct side of a trend for longer, and when they disagree you get an early warning that conditions are changing.
When the baseline bends and price cannot reclaim the opposite band , momentum is usually continuing. Pullbacks into the baseline that stall before the far band often resolve in trend.
When the baseline flattens and the bands compress , expect indecision. Use the Flip Offset ATR to avoid reacting to the first feint. Wait for a clean band breach with follow through.
When an adverse K·ATR exit prints while the side has not flipped , treat it as a risk event rather than a full regime change. Many users cut size, re-enter only if the side reasserts, and let the next flip confirm a new trend.
Final thoughts
Deadband Hysteresis Supertrend is best read as a regime lens. The baseline defines your tolerance for noise, the bands define your trailing structure, and the flip offset plus adverse ATR stop define how forgiving or strict you want to be at the boundary. On strong trends it helps you hold through shallow shakeouts. In choppy conditions it encourages patience until price does something meaningful. Start with settings that reflect the cadence of your market, observe how often flips occur, then nudge the deadband and flip offset until the tool spends most of its time describing the move you care about rather than the noise in between.

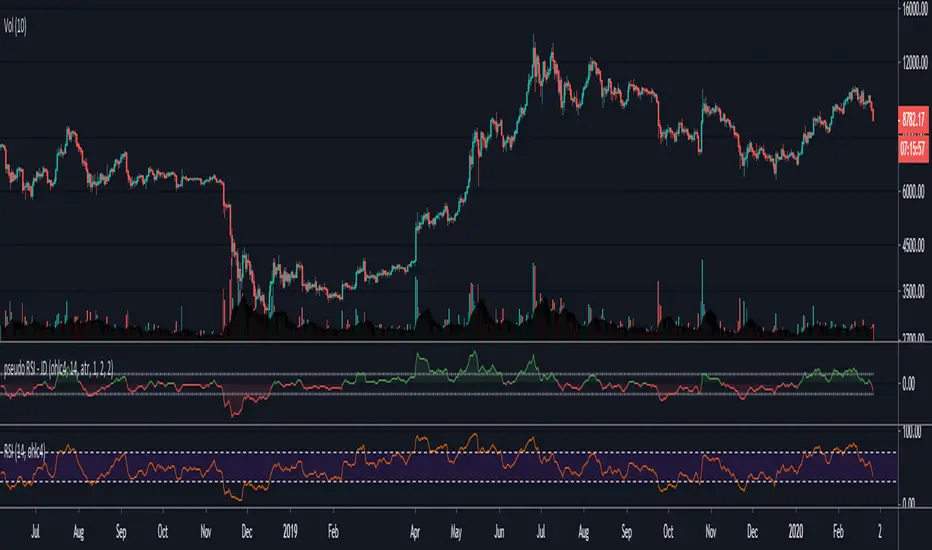
Twiggs Money FlowTwiggs Money Flow (TMF)
This indicator is an implementation of the Twiggs Money Flow (TMF), a volume-based tool designed to measure buying and selling pressure over a specified period. TMF is an enhancement of Chaikin Money Flow (CMF), utilizing more sophisticated smoothing techniques for improved accuracy and reduced noise. This version is highly customizable and includes advanced features for both new and experienced traders.
What is Twiggs Money Flow?
Twiggs Money Flow was developed by Colin Twiggs to provide a clearer picture of market momentum and the balance between buyers and sellers. It uses a combination of price action, trading volume, and range calculations to assess whether a market is under buying or selling pressure.
Unlike traditional volume indicators, TMF incorporates Weighted Moving Averages (WMA) by default but allows for other moving average types (SMA, EMA, VWMA) for added flexibility. This makes it adaptable to various trading styles and market conditions.
Features of This Script:
Customizable Moving Average Types:
Select from SMA , EMA , WMA , or VWMA to smooth volume and price-based calculations.
Tailor the indicator to align with your trading strategy or the asset's behavior.
Optional HMA Smoothing:
Apply Hull Moving Average (HMA) smoothing for a cleaner, faster-reacting TMF line.
Perfect for traders who want to reduce lag and capture trends earlier.
Dynamic Thresholds for Signal Filtering:
Set user-defined thresholds for Long (LT) and Short (ST) signals to highlight significant momentum.
Focus on actionable trends by ignoring noise around neutral levels.
Bar Coloring for Visual Clarity:
Automatically colors your chart bars based on TMF values:
Aqua for strong bullish signals (above the long threshold).
Fuchsia for strong bearish signals (below the short threshold).
Gray for neutral or undecided market conditions.
Ensures that trend direction and strength are visually intuitive.
Configurable Lookback Period:
Adjust the sensitivity of TMF by customizing the length of the lookback period to suit different timeframes and market conditions.
How It Works:
True Range Calculation: The script determines the high, low, and close range to calculate buying and selling pressure.
Adjusted Volume: Incorporates the relationship between price and volume to gauge whether trading activity is favoring buyers or sellers.
Weighted Moving Averages (WMAs): Smooths both volume and adjusted volume values to eliminate erratic fluctuations.
TMF Line: Computes the ratio of adjusted volume to total volume, representing the net buying/selling pressure as a percentage.
HMA Option (if enabled): Smooths the TMF line further to reduce lag and enhance trend identification.
Bar Coloring Logic:
Bars are colored dynamically based on TMF values, thresholds, and smoothing preferences.
Provides an at-a-glance understanding of market conditions.
Input Parameters:
Lookback Period: Defines the number of bars used to calculate TMF (default: 21).
Use HMA Smoothing: Toggle Hull Moving Average smoothing (default: true).
HMA Smoothing Length: Length of the HMA smoothing period (default: 14).
Moving Average Type: Select SMA, EMA, WMA, or VWMA (default: WMA).
Long Threshold (LT): Threshold value above which a long signal is considered (default: 0).
Short Threshold (ST): Threshold value below which a short signal is considered (default: 0).
How to Use It:
Confirm Trends: TMF can validate trends by identifying periods of sustained buying or selling pressure.
Divergence Signals: Watch for divergences between price and TMF to anticipate potential reversals.
Filter Trades: Use the thresholds to ignore weak signals and focus on strong trends.
Combine with Other Indicators: Pair TMF with trend-following or momentum indicators (e.g., RSI, Bollinger Bands) for a comprehensive trading strategy.
Example Use Cases:
Spotting breakouts when TMF crosses above the long threshold.
Identifying sell-offs when TMF dips below the short threshold.
Avoiding sideways markets by ignoring neutral (gray) bars.
Notes:
This indicator is highly customizable, making it versatile across different assets (e.g., stocks, crypto, forex).
While the default settings are robust, tweaking the lookback period, moving average type, and thresholds is recommended for different trading instruments or strategies.
Always backtest thoroughly before applying the indicator to live trading.
This version of Twiggs Money Flow goes beyond standard implementations by offering advanced smoothing, custom thresholds, and enhanced visual feedback to give traders a competitive edge.
Add it to your charts and experience the power of volume-driven analysis!

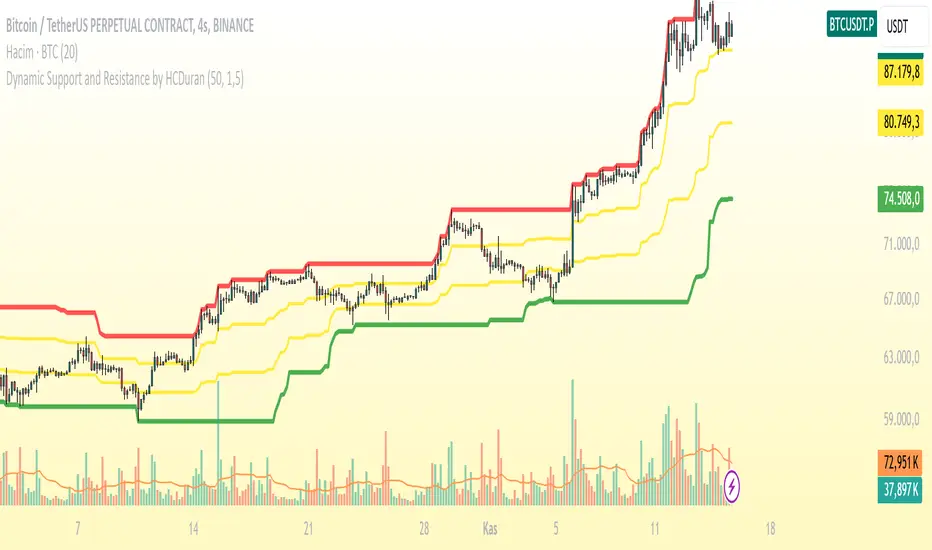
Dynamic Support and Resistance by HCDuranThis indicator dynamically plots support and resistance levels based on price action. It calculates the strongest support and resistance levels using the highest and lowest prices over a specified period, and visualizes these levels with different colors. Strong support and resistance are marked in **green** and **red** respectively, while **mid-range** support and resistance levels are displayed in **yellow**.
### Features:
- **Strong Support (Green):** The lowest price level over the last 50 bars.
- **Strong Resistance (Red):** The highest price level over the last 50 bars.
- **Mid Support (Yellow):** A support level above the strong support but below the resistance range.
- **Mid Resistance (Yellow):** A resistance level below the strong resistance but above the support range.
### Usage:
1. **Support and Resistance:** The indicator calculates dynamic support and resistance levels based on the most recent price action over a specified lookback period (e.g., 50 bars). These levels are then plotted on the chart for easy visualization.
2. **Alerts:** Alerts are triggered when the price crosses below the strong support or above the strong resistance. This can be useful for identifying potential breakouts or reversals.
### Help for Users:
This indicator helps to identify potential price reversal points by plotting dynamic support and resistance levels. Strong support or resistance levels can indicate areas where the price is likely to reverse, while mid-range levels can provide additional insights into price trends and ranges.
**Note:** The performance of this indicator may vary depending on the selected lookback period and time frame. It is recommended to experiment with different timeframes to see how the indicator performs under various market conditions.
-------------------------------------------------------------------------------------------------------------------
Bu indikatör, fiyat hareketlerine dayalı olarak dinamik destek ve direnç seviyelerini çizer. En yüksek ve en düşük seviyeler arasındaki farkı göz önünde bulundurarak, güçlü direnç ve destek seviyelerini kırmızı ve yeşil renklerle, orta seviyeleri ise sarı renk ile gösterir.
### Özellikler:
- **Güçlü Destek (Yeşil):** En düşük fiyat seviyesinin 50 barlık bir zaman dilimi boyunca belirlenen seviyesi.
- **Güçlü Direnç (Kırmızı):** En yüksek fiyat seviyesinin 50 barlık bir zaman dilimi boyunca belirlenen seviyesi.
- **Orta Destek (Sarı):** Destek seviyesinin üstünde, ancak güçlü destek seviyesinden daha yüksek bir seviyedir.
- **Orta Direnç (Sarı):** Direnç seviyesinin altında, ancak güçlü direnç seviyesinden daha düşük bir seviyedir.
### Kullanım:
1. **Destek ve Direnç:** Bu indikatör, belirli bir süre dilimindeki fiyat hareketlerine dayalı olarak destek ve direnç seviyelerini belirler ve çizer. Fiyat bu seviyelere yaklaşırken, seviyelerin ne kadar güçlü olduğunu görsel olarak değerlendirebilirsiniz.
2. **Uyarılar:** İndikatör, fiyatın güçlü destek seviyesinin altına düşmesi veya güçlü direnç seviyesinin üstüne çıkması durumunda uyarılar tetikler. Bu, trade kararları alırken önemli sinyaller sağlayabilir.
### Kullanıcıya Yardım:
Bu indikatör, dinamik destek ve direnç seviyeleri belirleyerek, potansiyel geri dönüş noktalarını ve fiyat hareketinin yönünü anlamaya yardımcı olur. Fiyatın güçlü seviyeleri kırması, önemli trade fırsatları gösterebilir.
**Not:** İndikatörün performansı, bakılan zaman dilimine ve seçilen lookback periyoduna göre değişebilir. Farklı zaman dilimlerinde kullanarak daha doğru sinyaller elde edebilirsiniz.
Simple Fibonacci Retracement Strategy This strategy uses Fibonacci retracement to identify key levels in the market and helps traders find good entry and exit points. By understanding and using this strategy, traders can improve their trading decisions and increase their chances of success in the market.
This strategy, called the "Simple Fibonacci Retracement Strategy," is designed to help traders identify potential entry and exit points in the market based on Fibonacci retracement levels. The code is written in Pine Script and runs on the TradingView platform.
Overall Function
The strategy uses Fibonacci retracement levels to identify potential support and resistance levels in the market. This helps traders find good entry and exit points for trades, as well as set stop-loss and take-profit levels to minimize risk and maximize gains.
Main Components of the Code
1. Input Parameters
Lookback Period: The number of bars used to identify the highest high and lowest low.
Fibonacci Direction: The choice of whether Fibonacci levels are calculated from top to bottom or bottom to top.
Fibonacci Levels: Specific Fibonacci levels (23.6%, 38.2%, 50%, 61.8%) used to identify important price levels.
Take Profit and Stop Loss: The number of pips used to set take profit and stop loss levels.
2. Identification of Highest and Lowest Points
The code uses the lookback period to find the highest high (highestHigh) and the lowest low (lowestLow). These levels form the basis for calculating the Fibonacci levels.
3. Calculation of Fibonacci Levels
Based on the direction chosen by the user, the code calculates the various Fibonacci levels (0%, 23.6%, 38.2%, 50%, 61.8%, 100%).
4. Trading Logic
Long Signal: Generated when the price crosses above the 61.8% Fibonacci level from bottom to top.
Short Signal: Generated when the price crosses below the 38.2% Fibonacci level from top to bottom.
When a long or short signal is generated, the strategy opens a position and sets take profit and stop loss levels based on the input parameters.
5. Visualization
The strategy plots the Fibonacci levels on the chart to provide a visual representation of the calculated levels. This helps traders see where the levels are in relation to the current price.
6. Alerts
The code also has functionality to create alerts (commented out), which can notify traders of buy or sell signals.
How to Use the Strategy
Configure Parameters: Adjust the lookback period, Fibonacci direction, and levels for take profit and stop loss to your preferences.
View the Chart: The Fibonacci levels will be plotted on the chart, providing a visual overview of potential support and resistance levels.
Trade Signals: Follow the generated buy and sell signals. Set your parameters in settings and adjust according to the generated buy and sell signals in the strategy tester. The strategy will automatically set your take profit and stop loss levels.
Evaluation and Adjustment: Monitor the performance of the strategy and make adjustments as needed to optimize the results.
Norwegian
Denne strategien, kalt "Simple Fibonacci Retracement Strategy", er designet for å hjelpe tradere med å identifisere mulige inngangs- og utgangspunkter i markedet basert på Fibonacci-retracementnivåer. Koden er skrevet i Pine Script og kjøres på TradingView-plattformen.
Overordnet Funksjon
Strategien bruker Fibonacci-retracementnivåer for å identifisere potensielle støtte- og motstandsnivåer i markedet. Dette hjelper tradere med å finne gode inngangs- og utgangspunkter for handler, samt å sette stop-loss og take-profit nivåer for å minimere risiko og maksimere gevinster.
Hovedkomponenter i Koden
1. Input Parametere
Lookback Period: Antall barer som brukes til å identifisere høyeste høydepunkt og laveste lavpunkt.
Fibonacci Direction: Valg om Fibonacci-nivåene skal beregnes fra topp til bunn eller bunn til topp.
Fibonacci Levels: Spesifikke Fibonacci-nivåer (23.6%, 38.2%, 50%, 61.8%) som brukes til å identifisere viktige prisnivåer.
Take Profit og Stop Loss: Antall pips som brukes til å sette take profit og stop loss nivåer.
2. Identifikasjon av Høyeste og Laveste Punkt
Koden bruker lookback perioden for å finne det høyeste høydepunktet (highestHigh) og det laveste lavpunktet (lowestLow). Disse nivåene er grunnlaget for å beregne Fibonacci-nivåene.
3. Beregning av Fibonacci-nivåer
Basert på retningen valgt av brukeren, beregner koden de forskjellige Fibonacci-nivåene (0%, 23.6%, 38.2%, 50%, 61.8%, 100%).
4. Handelslogikk
Long Signal: Genereres når prisen krysser over 61.8% Fibonacci-nivået fra bunn til topp.
Short Signal: Genereres når prisen krysser under 38.2% Fibonacci-nivået fra topp til bunn.
Når et long eller short signal genereres, åpner strategien en posisjon og setter take profit og stop loss nivåer basert på inputparametrene.
5. Visualisering
Strategien plottet Fibonacci-nivåene på chartet for å gi en visuell representasjon av de beregnede nivåene. Dette hjelper tradere med å se hvor nivåene er i forhold til den nåværende prisen.
6. Varsler
Koden har også funksjonalitet for å lage varsler (kommentert ut), som kan varsle tradere om kjøps- eller salgssignaler.
Slik Bruker Du Strategien
Konfigurer Parametere: Juster lookback perioden, Fibonacci-retningen, og nivåene for take profit og stop loss til dine preferanser.
Se på Chartet: Fibonacci-nivåene vil bli plottet på chartet, noe som gir deg en visuell oversikt over potensielle støtte- og motstandsnivåer.
Handle Signaler: Sett dine parametere i innstillinger og juster etter genererte kjøps- og salgssignalene i strategy testeren. Strategien vil automatisk sette dine take profit og stop loss nivåer.
Evaluering og Justering: Overvåk ytelsen til strategien og gjør justeringer etter behov for å optimalisere resultatene.

Vector3Library "Vector3"
Representation of 3D vectors and points.
This structure is used to pass 3D positions and directions around. It also contains functions for doing common vector operations.
Besides the functions listed below, other classes can be used to manipulate vectors and points as well.
For example the Quaternion and the Matrix4x4 classes are useful for rotating or transforming vectors and points.
___
**Reference:**
- github.com
- github.com
- github.com
- www.movable-type.co.uk
- docs.unity3d.com
- referencesource.microsoft.com
- github.com
\
new(x, y, z)
Create a new `Vector3`.
Parameters:
x (float) : `float` Property `x` value, (optional, default=na).
y (float) : `float` Property `y` value, (optional, default=na).
z (float) : `float` Property `z` value, (optional, default=na).
Returns: `Vector3` Generated new vector.
___
**Usage:**
```
.new(1.1, 1, 1)
```
from(value)
Create a new `Vector3` from a single value.
Parameters:
value (float) : `float` Properties positional value, (optional, default=na).
Returns: `Vector3` Generated new vector.
___
**Usage:**
```
.from(1.1)
```
from_Array(values, fill_na)
Create a new `Vector3` from a list of values, only reads up to the third item.
Parameters:
values (float ) : `array` Vector property values.
fill_na (float) : `float` Parameter value to replace missing indexes, (optional, defualt=na).
Returns: `Vector3` Generated new vector.
___
**Notes:**
- Supports any size of array, fills non available fields with `na`.
___
**Usage:**
```
.from_Array(array.from(1.1, fill_na=33))
.from_Array(array.from(1.1, 2, 3))
```
from_Vector2(values)
Create a new `Vector3` from a `Vector2`.
Parameters:
values (Vector2 type from RicardoSantos/CommonTypesMath/1) : `Vector2` Vector property values.
Returns: `Vector3` Generated new vector.
___
**Usage:**
```
.from:Vector2(.Vector2.new(1, 2.0))
```
___
**Notes:**
- Type `Vector2` from CommonTypesMath library.
from_Quaternion(values)
Create a new `Vector3` from a `Quaternion`'s `x, y, z` properties.
Parameters:
values (Quaternion type from RicardoSantos/CommonTypesMath/1) : `Quaternion` Vector property values.
Returns: `Vector3` Generated new vector.
___
**Usage:**
```
.from_Quaternion(.Quaternion.new(1, 2, 3, 4))
```
___
**Notes:**
- Type `Quaternion` from CommonTypesMath library.
from_String(expression, separator, fill_na)
Create a new `Vector3` from a list of values in a formated string.
Parameters:
expression (string) : `array` String with the list of vector properties.
separator (string) : `string` Separator between entries, (optional, default=`","`).
fill_na (float) : `float` Parameter value to replace missing indexes, (optional, defualt=na).
Returns: `Vector3` Generated new vector.
___
**Notes:**
- Supports any size of array, fills non available fields with `na`.
- `",,"` Empty fields will be ignored.
___
**Usage:**
```
.from_String("1.1", fill_na=33))
.from_String("(1.1,, 3)") // 1.1 , 3.0, NaN // empty field will be ignored!!
```
back()
Create a new `Vector3` object in the form `(0, 0, -1)`.
Returns: `Vector3` Generated new vector.
___
**Usage:**
```
.back()
```
front()
Create a new `Vector3` object in the form `(0, 0, 1)`.
Returns: `Vector3` Generated new vector.
___
**Usage:**
```
.front()
```
up()
Create a new `Vector3` object in the form `(0, 1, 0)`.
Returns: `Vector3` Generated new vector.
___
**Usage:**
```
.up()
```
down()
Create a new `Vector3` object in the form `(0, -1, 0)`.
Returns: `Vector3` Generated new vector.
___
**Usage:**
```
.down()
```
left()
Create a new `Vector3` object in the form `(-1, 0, 0)`.
Returns: `Vector3` Generated new vector.
___
**Usage:**
```
.left()
```
right()
Create a new `Vector3` object in the form `(1, 0, 0)`.
Returns: `Vector3` Generated new vector.
___
**Usage:**
```
.right()
```
zero()
Create a new `Vector3` object in the form `(0, 0, 0)`.
Returns: `Vector3` Generated new vector.
___
**Usage:**
```
.zero()
```
one()
Create a new `Vector3` object in the form `(1, 1, 1)`.
Returns: `Vector3` Generated new vector.
___
**Usage:**
```
.one()
```
minus_one()
Create a new `Vector3` object in the form `(-1, -1, -1)`.
Returns: `Vector3` Generated new vector.
___
**Usage:**
```
.minus_one()
```
unit_x()
Create a new `Vector3` object in the form `(1, 0, 0)`.
Returns: `Vector3` Generated new vector.
___
**Usage:**
```
.unit_x()
```
unit_y()
Create a new `Vector3` object in the form `(0, 1, 0)`.
Returns: `Vector3` Generated new vector.
___
**Usage:**
```
.unit_y()
```
unit_z()
Create a new `Vector3` object in the form `(0, 0, 1)`.
Returns: `Vector3` Generated new vector.
___
**Usage:**
```
.unit_z()
```
nan()
Create a new `Vector3` object in the form `(na, na, na)`.
Returns: `Vector3` Generated new vector.
___
**Usage:**
```
.nan()
```
random(max, min)
Generate a vector with random properties.
Parameters:
max (Vector3 type from RicardoSantos/CommonTypesMath/1) : `Vector3` Maximum defined range of the vector properties.
min (Vector3 type from RicardoSantos/CommonTypesMath/1) : `Vector3` Minimum defined range of the vector properties.
Returns: `Vector3` Generated new vector.
___
**Usage:**
```
.random(.from(math.pi), .from(-math.pi))
```
random(max)
Generate a vector with random properties (min set to 0.0).
Parameters:
max (Vector3 type from RicardoSantos/CommonTypesMath/1) : `Vector3` Maximum defined range of the vector properties.
Returns: `Vector3` Generated new vector.
___
**Usage:**
```
.random(.from(math.pi))
```
method copy(this)
Copy a existing `Vector3`
Namespace types: TMath.Vector3
Parameters:
this (Vector3 type from RicardoSantos/CommonTypesMath/1) : `Vector3` Source vector.
Returns: `Vector3` Generated new vector.
___
**Usage:**
```
a = .one().copy()
```
method i_add(this, other)
Modify a instance of a vector by adding a vector to it.
Namespace types: TMath.Vector3
Parameters:
this (Vector3 type from RicardoSantos/CommonTypesMath/1) : `Vector3` Source vector.
other (Vector3 type from RicardoSantos/CommonTypesMath/1) : `Vector3` Other Vector.
Returns: `Vector3` Updated source vector.
___
**Usage:**
```
a = .from(1) , a.i_add(.up())
```
method i_add(this, value)
Modify a instance of a vector by adding a vector to it.
Namespace types: TMath.Vector3
Parameters:
this (Vector3 type from RicardoSantos/CommonTypesMath/1) : `Vector3` Source vector.
value (float) : `float` Value.
Returns: `Vector3` Updated source vector.
___
**Usage:**
```
a = .from(1) , a.i_add(3.2)
```
method i_subtract(this, other)
Modify a instance of a vector by subtracting a vector to it.
Namespace types: TMath.Vector3
Parameters:
this (Vector3 type from RicardoSantos/CommonTypesMath/1) : `Vector3` Source vector.
other (Vector3 type from RicardoSantos/CommonTypesMath/1) : `Vector3` Other Vector.
Returns: `Vector3` Updated source vector.
___
**Usage:**
```
a = .from(1) , a.i_subtract(.down())
```
method i_subtract(this, value)
Modify a instance of a vector by subtracting a vector to it.
Namespace types: TMath.Vector3
Parameters:
this (Vector3 type from RicardoSantos/CommonTypesMath/1) : `Vector3` Source vector.
value (float) : `float` Value.
Returns: `Vector3` Updated source vector.
___
**Usage:**
```
a = .from(1) , a.i_subtract(3)
```
method i_multiply(this, other)
Modify a instance of a vector by multiplying a vector with it.
Namespace types: TMath.Vector3
Parameters:
this (Vector3 type from RicardoSantos/CommonTypesMath/1) : `Vector3` Source vector.
other (Vector3 type from RicardoSantos/CommonTypesMath/1) : `Vector3` Other Vector.
Returns: `Vector3` Updated source vector.
___
**Usage:**
```
a = .from(1) , a.i_multiply(.left())
```
method i_multiply(this, value)
Modify a instance of a vector by multiplying a vector with it.
Namespace types: TMath.Vector3
Parameters:
this (Vector3 type from RicardoSantos/CommonTypesMath/1) : `Vector3` Source vector.
value (float) : `float` value.
Returns: `Vector3` Updated source vector.
___
**Usage:**
```
a = .from(1) , a.i_multiply(3)
```
method i_divide(this, other)
Modify a instance of a vector by dividing it by another vector.
Namespace types: TMath.Vector3
Parameters:
this (Vector3 type from RicardoSantos/CommonTypesMath/1) : `Vector3` Source vector.
other (Vector3 type from RicardoSantos/CommonTypesMath/1) : `Vector3` Other Vector.
Returns: `Vector3` Updated source vector.
___
**Usage:**
```
a = .from(1) , a.i_divide(.forward())
```
method i_divide(this, value)
Modify a instance of a vector by dividing it by another vector.
Namespace types: TMath.Vector3
Parameters:
this (Vector3 type from RicardoSantos/CommonTypesMath/1) : `Vector3` Source vector.
value (float) : `float` Value.
Returns: `Vector3` Updated source vector.
___
**Usage:**
```
a = .from(1) , a.i_divide(3)
```
method i_mod(this, other)
Modify a instance of a vector by modulo assignment with another vector.
Namespace types: TMath.Vector3
Parameters:
this (Vector3 type from RicardoSantos/CommonTypesMath/1) : `Vector3` Source vector.
other (Vector3 type from RicardoSantos/CommonTypesMath/1) : `Vector3` Other Vector.
Returns: `Vector3` Updated source vector.
___
**Usage:**
```
a = .from(1) , a.i_mod(.back())
```
method i_mod(this, value)
Modify a instance of a vector by modulo assignment with another vector.
Namespace types: TMath.Vector3
Parameters:
this (Vector3 type from RicardoSantos/CommonTypesMath/1) : `Vector3` Source vector.
value (float) : `float` Value.
Returns: `Vector3` Updated source vector.
___
**Usage:**
```
a = .from(1) , a.i_mod(3)
```
method i_pow(this, exponent)
Modify a instance of a vector by modulo assignment with another vector.
Namespace types: TMath.Vector3
Parameters:
this (Vector3 type from RicardoSantos/CommonTypesMath/1) : `Vector3` Source vector.
exponent (Vector3 type from RicardoSantos/CommonTypesMath/1) : `Vector3` Exponent Vector.
Returns: `Vector3` Updated source vector.
___
**Usage:**
```
a = .from(1) , a.i_pow(.up())
```
method i_pow(this, exponent)
Modify a instance of a vector by modulo assignment with another vector.
Namespace types: TMath.Vector3
Parameters:
this (Vector3 type from RicardoSantos/CommonTypesMath/1) : `Vector3` Source vector.
exponent (float) : `float` Exponent Value.
Returns: `Vector3` Updated source vector.
___
**Usage:**
```
a = .from(1) , a.i_pow(2)
```
method length_squared(this)
Squared length of the vector.
Namespace types: TMath.Vector3
Parameters:
this (Vector3 type from RicardoSantos/CommonTypesMath/1)
Returns: `float` The squared length of this vector.
___
**Usage:**
```
a = .one().length_squared()
```
method magnitude_squared(this)
Squared magnitude of the vector.
Namespace types: TMath.Vector3
Parameters:
this (Vector3 type from RicardoSantos/CommonTypesMath/1) : `Vector3` Source vector.
Returns: `float` The length squared of this vector.
___
**Usage:**
```
a = .one().magnitude_squared()
```
method length(this)
Length of the vector.
Namespace types: TMath.Vector3
Parameters:
this (Vector3 type from RicardoSantos/CommonTypesMath/1) : `Vector3` Source vector.
Returns: `float` The length of this vector.
___
**Usage:**
```
a = .one().length()
```
method magnitude(this)
Magnitude of the vector.
Namespace types: TMath.Vector3
Parameters:
this (Vector3 type from RicardoSantos/CommonTypesMath/1) : `Vector3` Source vector.
Returns: `float` The Length of this vector.
___
**Usage:**
```
a = .one().magnitude()
```
method normalize(this, magnitude, eps)
Normalize a vector with a magnitude of 1(optional).
Namespace types: TMath.Vector3
Parameters:
this (Vector3 type from RicardoSantos/CommonTypesMath/1) : `Vector3` Source vector.
magnitude (float) : `float` Value to manipulate the magnitude of normalization, (optional, default=1.0).
eps (float)
Returns: `Vector3` Generated new vector.
___
**Usage:**
```
a = .new(33, 50, 100).normalize() // (x=0.283, y=0.429, z=0.858)
a = .new(33, 50, 100).normalize(2) // (x=0.142, y=0.214, z=0.429)
```
method to_String(this, precision)
Converts source vector to a string format, in the form `"(x, y, z)"`.
Namespace types: TMath.Vector3
Parameters:
this (Vector3 type from RicardoSantos/CommonTypesMath/1) : `Vector3` Source vector.
precision (string) : `string` Precision format to apply to values (optional, default='').
Returns: `string` Formated string in a `"(x, y, z)"` format.
___
**Usage:**
```
a = .one().to_String("#.###")
```
method to_Array(this)
Converts source vector to a array format.
Namespace types: TMath.Vector3
Parameters:
this (Vector3 type from RicardoSantos/CommonTypesMath/1) : `Vector3` Source vector.
Returns: `array` List of the vector properties.
___
**Usage:**
```
a = .new(1, 2, 3).to_Array()
```
method to_Vector2(this)
Converts source vector to a Vector2 in the form `x, y`.
Namespace types: TMath.Vector3
Parameters:
this (Vector3 type from RicardoSantos/CommonTypesMath/1) : `Vector3` Source vector.
Returns: `Vector2` Generated new vector.
___
**Usage:**
```
a = .from(1).to_Vector2()
```
method to_Quaternion(this, w)
Converts source vector to a Quaternion in the form `x, y, z, w`.
Namespace types: TMath.Vector3
Parameters:
this (Vector3 type from RicardoSantos/CommonTypesMath/1) : `Vector3` Sorce vector.
w (float) : `float` Property of `w` new value.
Returns: `Quaternion` Generated new vector.
___
**Usage:**
```
a = .from(1).to_Quaternion(w=1)
```
method add(this, other)
Add a vector to source vector.
Namespace types: TMath.Vector3
Parameters:
this (Vector3 type from RicardoSantos/CommonTypesMath/1) : `Vector3` Source vector.
other (Vector3 type from RicardoSantos/CommonTypesMath/1) : `Vector3` Other vector.
Returns: `Vector3` Generated new vector.
___
**Usage:**
```
a = .from(1).add(.unit_z())
```
method add(this, value)
Add a value to each property of the vector.
Namespace types: TMath.Vector3
Parameters:
this (Vector3 type from RicardoSantos/CommonTypesMath/1) : `Vector3` Source vector.
value (float) : `float` Value.
Returns: `Vector3` Generated new vector.
___
**Usage:**
```
a = .from(1).add(2.0)
```
add(value, other)
Add each property of a vector to a base value as a new vector.
Parameters:
value (float) : `float` Value.
other (Vector3 type from RicardoSantos/CommonTypesMath/1) : `Vector3` Vector.
Returns: `Vector3` Generated new vector.
___
**Usage:**
```
a = .from(2) , b = .add(1.0, a)
```
method subtract(this, other)
Subtract vector from source vector.
Namespace types: TMath.Vector3
Parameters:
this (Vector3 type from RicardoSantos/CommonTypesMath/1) : `Vector3` Source vector.
other (Vector3 type from RicardoSantos/CommonTypesMath/1) : `Vector3` Other vector.
Returns: `Vector3` Generated new vector.
___
**Usage:**
```
a = .from(1).subtract(.left())
```
method subtract(this, value)
Subtract a value from each property in source vector.
Namespace types: TMath.Vector3
Parameters:
this (Vector3 type from RicardoSantos/CommonTypesMath/1) : `Vector3` Source vector.
value (float) : `float` Value.
Returns: `Vector3` Generated new vector.
___
**Usage:**
```
a = .from(1).subtract(2.0)
```
subtract(value, other)
Subtract each property in a vector from a base value and create a new vector.
Parameters:
value (float) : `float` Value.
other (Vector3 type from RicardoSantos/CommonTypesMath/1) : `Vector3` Vector.
Returns: `Vector3` Generated new vector.
___
**Usage:**
```
a = .subtract(1.0, .right())
```
method multiply(this, other)
Multiply a vector by another.
Namespace types: TMath.Vector3
Parameters:
this (Vector3 type from RicardoSantos/CommonTypesMath/1) : `Vector3` Source vector.
other (Vector3 type from RicardoSantos/CommonTypesMath/1) : `Vector3` Other vector.
Returns: `Vector3` Generated new vector.
___
**Usage:**
```
a = .from(1).multiply(.up())
```
method multiply(this, value)
Multiply each element in source vector with a value.
Namespace types: TMath.Vector3
Parameters:
this (Vector3 type from RicardoSantos/CommonTypesMath/1) : `Vector3` Source vector.
value (float) : `float` Value.
Returns: `Vector3` Generated new vector.
___
**Usage:**
```
a = .from(1).multiply(2.0)
```
multiply(value, other)
Multiply a value with each property in a vector and create a new vector.
Parameters:
value (float) : `float` Value.
other (Vector3 type from RicardoSantos/CommonTypesMath/1) : `Vector3` Vector.
Returns: `Vector3` Generated new vector.
___
**Usage:**
```
a = .multiply(1.0, .new(1, 2, 1))
```
method divide(this, other)
Divide a vector by another.
Namespace types: TMath.Vector3
Parameters:
this (Vector3 type from RicardoSantos/CommonTypesMath/1) : `Vector3` Source vector.
other (Vector3 type from RicardoSantos/CommonTypesMath/1) : `Vector3` Other vector.
Returns: `Vector3` Generated new vector.
___
**Usage:**
```
a = .from(1).divide(.from(2))
```
method divide(this, value)
Divide each property in a vector by a value.
Namespace types: TMath.Vector3
Parameters:
this (Vector3 type from RicardoSantos/CommonTypesMath/1) : `Vector3` Source vector.
value (float) : `float` Value.
Returns: `Vector3` Generated new vector.
___
**Usage:**
```
a = .from(1).divide(2.0)
```
divide(value, other)
Divide a base value by each property in a vector and create a new vector.
Parameters:
value (float) : `float` Value.
other (Vector3 type from RicardoSantos/CommonTypesMath/1) : `Vector3` Vector.
Returns: `Vector3` Generated new vector.
___
**Usage:**
```
a = .divide(1.0, .from(2))
```
method mod(this, other)
Modulo a vector by another.
Namespace types: TMath.Vector3
Parameters:
this (Vector3 type from RicardoSantos/CommonTypesMath/1) : `Vector3` Source vector.
other (Vector3 type from RicardoSantos/CommonTypesMath/1) : `Vector3` Other vector.
Returns: `Vector3` Generated new vector.
___
**Usage:**
```
a = .from(1).mod(.from(2))
```
method mod(this, value)
Modulo each property in a vector by a value.
Namespace types: TMath.Vector3
Parameters:
this (Vector3 type from RicardoSantos/CommonTypesMath/1) : `Vector3` Source vector.
value (float) : `float` Value.
Returns: `Vector3` Generated new vector.
___
**Usage:**
```
a = .from(1).mod(2.0)
```
mod(value, other)
Modulo a base value by each property in a vector and create a new vector.
Parameters:
value (float) : `float` Value.
other (Vector3 type from RicardoSantos/CommonTypesMath/1) : `Vector3` Vector.
Returns: `Vector3` Generated new vector.
___
**Usage:**
```
a = .mod(1.0, .from(2))
```
method negate(this)
Negate a vector in the form `(zero - this)`.
Namespace types: TMath.Vector3
Parameters:
this (Vector3 type from RicardoSantos/CommonTypesMath/1) : `Vector3` Source vector.
Returns: `Vector3` Generated new vector.
___
**Usage:**
```
a = .one().negate()
```
method pow(this, other)
Modulo a vector by another.
Namespace types: TMath.Vector3
Parameters:
this (Vector3 type from RicardoSantos/CommonTypesMath/1) : `Vector3` Source vector.
other (Vector3 type from RicardoSantos/CommonTypesMath/1) : `Vector3` Other vector.
Returns: `Vector3` Generated new vector.
___
**Usage:**
```
a = .from(2).pow(.from(3))
```
method pow(this, exponent)
Raise the vector elements by a exponent.
Namespace types: TMath.Vector3
Parameters:
this (Vector3 type from RicardoSantos/CommonTypesMath/1) : `Vector3` Source vector.
exponent (float) : `float` The exponent to raise the vector by.
Returns: `Vector3` Generated new vector.
___
**Usage:**
```
a = .from(1).pow(2.0)
```
pow(value, exponent)
Raise value into a vector raised by the elements in exponent vector.
Parameters:
value (float) : `float` Base value.
exponent (Vector3 type from RicardoSantos/CommonTypesMath/1) : `Vector3` The exponent to raise the vector of base value by.
Returns: `Vector3` Generated new vector.
___
**Usage:**
```
a = .pow(1.0, .from(2))
```
method sqrt(this)
Square root of the elements in a vector.
Namespace types: TMath.Vector3
Parameters:
this (Vector3 type from RicardoSantos/CommonTypesMath/1) : `Vector3` Source vector.
Returns: `Vector3` Generated new vector.
___
**Usage:**
```
a = .from(1).sqrt()
```
method abs(this)
Absolute properties of the vector.
Namespace types: TMath.Vector3
Parameters:
this (Vector3 type from RicardoSantos/CommonTypesMath/1) : `Vector3` Source vector.
Returns: `Vector3` Generated new vector.
___
**Usage:**
```
a = .from(1).abs()
```
method max(this)
Highest property of the vector.
Namespace types: TMath.Vector3
Parameters:
this (Vector3 type from RicardoSantos/CommonTypesMath/1) : `Vector3` Source vector.
Returns: `float` Highest value amongst the vector properties.
___
**Usage:**
```
a = .new(1, 2, 3).max()
```
method min(this)
Lowest element of the vector.
Namespace types: TMath.Vector3
Parameters:
this (Vector3 type from RicardoSantos/CommonTypesMath/1) : `Vector3` Source vector.
Returns: `float` Lowest values amongst the vector properties.
___
**Usage:**
```
a = .new(1, 2, 3).min()
```
method floor(this)
Floor of vector a.
Namespace types: TMath.Vector3
Parameters:
this (Vector3 type from RicardoSantos/CommonTypesMath/1) : `Vector3` Source vector.
Returns: `Vector3` Generated new vector.
___
**Usage:**
```
a = .new(1.33, 1.66, 1.99).floor()
```
method ceil(this)
Ceil of vector a.
Namespace types: TMath.Vector3
Parameters:
this (Vector3 type from RicardoSantos/CommonTypesMath/1) : `Vector3` Source vector.
Returns: `Vector3` Generated new vector.
___
**Usage:**
```
a = .new(1.33, 1.66, 1.99).ceil()
```
method round(this)
Round of vector elements.
Namespace types: TMath.Vector3
Parameters:
this (Vector3 type from RicardoSantos/CommonTypesMath/1) : `Vector3` Source vector.
Returns: `Vector3` Generated new vector.
___
**Usage:**
```
a = .new(1.33, 1.66, 1.99).round()
```
method round(this, precision)
Round of vector elements to n digits.
Namespace types: TMath.Vector3
Parameters:
this (Vector3 type from RicardoSantos/CommonTypesMath/1) : `Vector3` Source vector.
precision (int) : `int` Number of digits to round the vector elements.
Returns: `Vector3` Generated new vector.
___
**Usage:**
```
a = .new(1.33, 1.66, 1.99).round(1) // 1.3, 1.7, 2
```
method fractional(this)
Fractional parts of vector.
Namespace types: TMath.Vector3
Parameters:
this (Vector3 type from RicardoSantos/CommonTypesMath/1) : `Vector3` Source vector.
Returns: `Vector3` Generated new vector.
___
**Usage:**
```
a = .from(1.337).fractional() // 0.337
```
method dot_product(this, other)
Dot product of two vectors.
Namespace types: TMath.Vector3
Parameters:
this (Vector3 type from RicardoSantos/CommonTypesMath/1) : `Vector3` Source vector.
other (Vector3 type from RicardoSantos/CommonTypesMath/1) : `Vector3` Other vector.
Returns: `float` Dot product.
___
**Usage:**
```
a = .from(2).dot_product(.left())
```
method cross_product(this, other)
Cross product of two vectors.
Namespace types: TMath.Vector3
Parameters:
this (Vector3 type from RicardoSantos/CommonTypesMath/1) : `Vector3` Source vector.
other (Vector3 type from RicardoSantos/CommonTypesMath/1) : `Vector3` Other vector.
Returns: `Vector3` Generated new vector.
___
**Usage:**
```
a = .from(1).cross_produc(.right())
```
method scale(this, scalar)
Scale vector by a scalar value.
Namespace types: TMath.Vector3
Parameters:
this (Vector3 type from RicardoSantos/CommonTypesMath/1) : `Vector3` Source vector.
scalar (float) : `float` Value to scale the the vector by.
Returns: `Vector3` Generated new vector.
___
**Usage:**
```
a = .from(1).scale(2)
```
method rescale(this, magnitude)
Rescale a vector to a new magnitude.
Namespace types: TMath.Vector3
Parameters:
this (Vector3 type from RicardoSantos/CommonTypesMath/1) : `Vector3` Source vector.
magnitude (float) : `float` Value to manipulate the magnitude of normalization.
Returns: `Vector3` Generated new vector.
___
**Usage:**
```
a = .from(20).rescale(1)
```
method equals(this, other)
Compares two vectors.
Namespace types: TMath.Vector3
Parameters:
this (Vector3 type from RicardoSantos/CommonTypesMath/1) : `Vector3` Source vector.
other (Vector3 type from RicardoSantos/CommonTypesMath/1) : `Vector3` Other vector.
Returns: `Vector3` Generated new vector.
___
**Usage:**
```
a = .from(1).equals(.one())
```
method sin(this)
Sine of vector.
Namespace types: TMath.Vector3
Parameters:
this (Vector3 type from RicardoSantos/CommonTypesMath/1) : `Vector3` Source vector.
Returns: `Vector3` Generated new vector.
___
**Usage:**
```
a = .from(1).sin()
```
method cos(this)
Cosine of vector.
Namespace types: TMath.Vector3
Parameters:
this (Vector3 type from RicardoSantos/CommonTypesMath/1) : `Vector3` Source vector.
Returns: `Vector3` Generated new vector.
___
**Usage:**
```
a = .from(1).cos()
```
method tan(this)
Tangent of vector.
Namespace types: TMath.Vector3
Parameters:
this (Vector3 type from RicardoSantos/CommonTypesMath/1) : `Vector3` Source vector.
Returns: `Vector3` Generated new vector.
___
**Usage:**
```
a = .from(1).tan()
```
vmax(a, b)
Highest elements of the properties from two vectors.
Parameters:
a (Vector3 type from RicardoSantos/CommonTypesMath/1) : `Vector3` Vector.
b (Vector3 type from RicardoSantos/CommonTypesMath/1) : `Vector3` Vector.
Returns: `Vector3` Generated new vector.
___
**Usage:**
```
a = .vmax(.one(), .from(2))
```
vmax(a, b, c)
Highest elements of the properties from three vectors.
Parameters:
a (Vector3 type from RicardoSantos/CommonTypesMath/1) : `Vector3` Vector.
b (Vector3 type from RicardoSantos/CommonTypesMath/1) : `Vector3` Vector.
c (Vector3 type from RicardoSantos/CommonTypesMath/1) : `Vector3` Vector.
Returns: `Vector3` Generated new vector.
___
**Usage:**
```
a = .vmax(.new(0.1, 2.5, 3.4), .from(2), .from(3))
```
vmin(a, b)
Lowest elements of the properties from two vectors.
Parameters:
a (Vector3 type from RicardoSantos/CommonTypesMath/1) : `Vector3` Vector.
b (Vector3 type from RicardoSantos/CommonTypesMath/1) : `Vector3` Vector.
Returns: `Vector3` Generated new vector.
___
**Usage:**
```
a = .vmin(.one(), .from(2))
```
vmin(a, b, c)
Lowest elements of the properties from three vectors.
Parameters:
a (Vector3 type from RicardoSantos/CommonTypesMath/1) : `Vector3` Vector.
b (Vector3 type from RicardoSantos/CommonTypesMath/1) : `Vector3` Vector.
c (Vector3 type from RicardoSantos/CommonTypesMath/1) : `Vector3` Vector.
Returns: `Vector3` Generated new vector.
___
**Usage:**
```
a = .vmin(.one(), .from(2), .new(3.3, 2.2, 0.5))
```
distance(a, b)
Distance between vector `a` and `b`.
Parameters:
a (Vector3 type from RicardoSantos/CommonTypesMath/1) : `Vector3` Source vector.
b (Vector3 type from RicardoSantos/CommonTypesMath/1) : `Vector3` Target vector.
Returns: `Vector3` Generated new vector.
___
**Usage:**
```
a = distance(.from(3), .unit_z())
```
clamp(a, min, max)
Restrict a vector between a min and max vector.
Parameters:
a (Vector3 type from RicardoSantos/CommonTypesMath/1) : `Vector3` Source vector.
min (Vector3 type from RicardoSantos/CommonTypesMath/1) : `Vector3` Minimum boundary vector.
max (Vector3 type from RicardoSantos/CommonTypesMath/1) : `Vector3` Maximum boundary vector.
Returns: `Vector3` Generated new vector.
___
**Usage:**
```
a = .clamp(a=.new(2.9, 1.5, 3.9), min=.from(2), max=.new(2.5, 3.0, 3.5))
```
clamp_magnitude(a, radius)
Vector with its magnitude clamped to a radius.
Parameters:
a (Vector3 type from RicardoSantos/CommonTypesMath/1) : `Vector3` Source vector.object, vector with properties that should be restricted to a radius.
radius (float) : `float` Maximum radius to restrict magnitude of vector.
Returns: `Vector3` Generated new vector.
___
**Usage:**
```
a = .clamp_magnitude(.from(21), 7)
```
lerp_unclamped(a, b, rate)
`Unclamped` linearly interpolates between provided vectors by a rate.
Parameters:
a (Vector3 type from RicardoSantos/CommonTypesMath/1) : `Vector3` Source vector.
b (Vector3 type from RicardoSantos/CommonTypesMath/1) : `Vector3` Target vector.
rate (float) : `float` Rate of interpolation, range(0 > 1) where 0 == source vector and 1 == target vector.
Returns: `Vector3` Generated new vector.
___
**Usage:**
```
a = .lerp_unclamped(.from(1), .from(2), 1.2)
```
lerp(a, b, rate)
Linearly interpolates between provided vectors by a rate.
Parameters:
a (Vector3 type from RicardoSantos/CommonTypesMath/1) : `Vector3` Source vector.
b (Vector3 type from RicardoSantos/CommonTypesMath/1) : `Vector3` Target vector.
rate (float) : `float` Rate of interpolation, range(0 > 1) where 0 == source vector and 1 == target vector.
Returns: `Vector3` Generated new vector.
___
**Usage:**
```
a = lerp(.one(), .from(2), 0.2)
```
herp(start, start_tangent, end, end_tangent, rate)
Hermite curve interpolation between provided vectors.
Parameters:
start (Vector3 type from RicardoSantos/CommonTypesMath/1) : `Vector3` Start vector.
start_tangent (Vector3 type from RicardoSantos/CommonTypesMath/1) : `Vector3` Start vector tangent.
end (Vector3 type from RicardoSantos/CommonTypesMath/1) : `Vector3` End vector.
end_tangent (Vector3 type from RicardoSantos/CommonTypesMath/1) : `Vector3` End vector tangent.
rate (int) : `float` Rate of the movement from `start` to `end` to get position, should be range(0 > 1).
Returns: `Vector3` Generated new vector.
___
**Usage:**
```
s = .new(0, 0, 0) , st = .new(0, 1, 1)
e = .new(1, 2, 2) , et = .new(-1, -1, 3)
h = .herp(s, st, e, et, 0.3)
```
___
**Reference:** en.m.wikibooks.org
herp_2(a, b, rate)
Hermite curve interpolation between provided vectors.
Parameters:
a (Vector3 type from RicardoSantos/CommonTypesMath/1) : `Vector3` Source vector.
b (Vector3 type from RicardoSantos/CommonTypesMath/1) : `Vector3` Target vector.
rate (Vector3 type from RicardoSantos/CommonTypesMath/1) : `Vector3` Rate of the movement per component from `start` to `end` to get position, should be range(0 > 1).
Returns: `Vector3` Generated new vector.
___
**Usage:**
```
h = .herp_2(.one(), .new(0.1, 3, 2), 0.6)
```
noise(a)
3D Noise based on Morgan McGuire @morgan3d
Parameters:
a (Vector3 type from RicardoSantos/CommonTypesMath/1) : `Vector3` Source vector.
Returns: `Vector3` Generated new vector.
___
**Usage:**
```
a = noise(.one())
```
___
**Reference:**
- thebookofshaders.com
- www.shadertoy.com
rotate(a, axis, angle)
Rotate a vector around a axis.
Parameters:
a (Vector3 type from RicardoSantos/CommonTypesMath/1) : `Vector3` Source vector.
axis (string) : `string` The plane to rotate around, `option="x", "y", "z"`.
angle (float) : `float` Angle in radians.
Returns: `Vector3` Generated new vector.
___
**Usage:**
```
a = .rotate(.from(3), 'y', math.toradians(45.0))
```
rotate_x(a, angle)
Rotate a vector on a fixed `x`.
Parameters:
a (Vector3 type from RicardoSantos/CommonTypesMath/1) : `Vector3` Source vector.
angle (float) : `float` Angle in radians.
Returns: `Vector3` Generated new vector.
___
**Usage:**
```
a = .rotate_x(.from(3), math.toradians(90.0))
```
rotate_y(a, angle)
Rotate a vector on a fixed `y`.
Parameters:
a (Vector3 type from RicardoSantos/CommonTypesMath/1) : `Vector3` Source vector.
angle (float) : `float` Angle in radians.
Returns: `Vector3` Generated new vector.
___
**Usage:**
```
a = .rotate_y(.from(3), math.toradians(90.0))
```
rotate_yaw_pitch(a, yaw, pitch)
Rotate a vector by yaw and pitch values.
Parameters:
a (Vector3 type from RicardoSantos/CommonTypesMath/1) : `Vector3` Source vector.
yaw (float) : `float` Angle in radians.
pitch (float) : `float` Angle in radians.
Returns: `Vector3` Generated new vector.
___
**Usage:**
```
a = .rotate_yaw_pitch(.from(3), math.toradians(90.0), math.toradians(45.0))
```
project(a, normal, eps)
Project a vector off a plane defined by a normal.
Parameters:
a (Vector3 type from RicardoSantos/CommonTypesMath/1) : `Vector3` Source vector.
normal (Vector3 type from RicardoSantos/CommonTypesMath/1) : `Vector3` The normal of the surface being reflected off.
eps (float) : `float` Minimum resolution to void division by zero (default=0.000001).
Returns: `Vector3` Generated new vector.
___
**Usage:**
```
a = .project(.one(), .down())
```
project_on_plane(a, normal, eps)
Projects a vector onto a plane defined by a normal orthogonal to the plane.
Parameters:
a (Vector3 type from RicardoSantos/CommonTypesMath/1) : `Vector3` Source vector.
normal (Vector3 type from RicardoSantos/CommonTypesMath/1) : `Vector3` The normal of the surface being reflected off.
eps (float) : `float` Minimum resolution to void division by zero (default=0.000001).
Returns: `Vector3` Generated new vector.
___
**Usage:**
```
a = .project_on_plane(.one(), .left())
```
project_to_2d(a, camera_position, camera_target)
Project a vector onto a two dimensions plane.
Parameters:
a (Vector3 type from RicardoSantos/CommonTypesMath/1) : `Vector3` Source vector.
camera_position (Vector3 type from RicardoSantos/CommonTypesMath/1) : `Vector3` Camera position.
camera_target (Vector3 type from RicardoSantos/CommonTypesMath/1) : `Vector3` Camera target plane position.
Returns: `Vector2` Generated new vector.
___
**Usage:**
```
a = .project_to_2d(.one(), .new(2, 2, 3), .zero())
```
reflect(a, normal)
Reflects a vector off a plane defined by a normal.
Parameters:
a (Vector3 type from RicardoSantos/CommonTypesMath/1) : `Vector3` Source vector.
normal (Vector3 type from RicardoSantos/CommonTypesMath/1) : `Vector3` The normal of the surface being reflected off.
Returns: `Vector3` Generated new vector.
___
**Usage:**
```
a = .reflect(.one(), .right())
```
angle(a, b, eps)
Angle in degrees between two vectors.
Parameters:
a (Vector3 type from RicardoSantos/CommonTypesMath/1) : `Vector3` Source vector.
b (Vector3 type from RicardoSantos/CommonTypesMath/1) : `Vector3` Target vector.
eps (float) : `float` Minimum resolution to void division by zero (default=1.0e-15).
Returns: `float` Angle value in degrees.
___
**Usage:**
```
a = .angle(.one(), .up())
```
angle_signed(a, b, axis)
Signed angle in degrees between two vectors.
Parameters:
a (Vector3 type from RicardoSantos/CommonTypesMath/1) : `Vector3` Source vector.
b (Vector3 type from RicardoSantos/CommonTypesMath/1) : `Vector3` Target vector.
axis (Vector3 type from RicardoSantos/CommonTypesMath/1) : `Vector3` Axis vector.
Returns: `float` Angle value in degrees.
___
**Usage:**
```
a = .angle_signed(.one(), .left(), .down())
```
___
**Notes:**
- The smaller of the two possible angles between the two vectors is returned, therefore the result will never
be greater than 180 degrees or smaller than -180 degrees.
- If you imagine the from and to vectors as lines on a piece of paper, both originating from the same point,
then the /axis/ vector would point up out of the paper.
- The measured angle between the two vectors would be positive in a clockwise direction and negative in an
anti-clockwise direction.
___
**Reference:**
- github.com
angle2d(a, b)
2D angle between two vectors.
Parameters:
a (Vector3 type from RicardoSantos/CommonTypesMath/1) : `Vector3` Source vector.
b (Vector3 type from RicardoSantos/CommonTypesMath/1) : `Vector3` Target vector.
Returns: `float` Angle value in degrees.
___
**Usage:**
```
a = .angle2d(.one(), .left())
```
transform_Matrix(a, M)
Transforms a vector by the given matrix.
Parameters:
a (Vector3 type from RicardoSantos/CommonTypesMath/1) : `Vector3` Source vector.
M (matrix) : `matrix` A 4x4 matrix. The transformation matrix.
Returns: `Vector3` Generated new vector.
___
**Usage:**
```
mat = matrix.new(4, 0)
mat.add_row(0, array.from(0.0, 0.0, 0.0, 1.0))
mat.add_row(1, array.from(0.0, 0.0, 1.0, 0.0))
mat.add_row(2, array.from(0.0, 1.0, 0.0, 0.0))
mat.add_row(3, array.from(1.0, 0.0, 0.0, 0.0))
b = .transform_Matrix(.one(), mat)
```
transform_M44(a, M)
Transforms a vector by the given matrix.
Parameters:
a (Vector3 type from RicardoSantos/CommonTypesMath/1) : `Vector3` Source vector.
M (M44 type from RicardoSantos/CommonTypesMath/1) : `M44` A 4x4 matrix. The transformation matrix.
Returns: `Vector3` Generated new vector.
___
**Usage:**
```
a = .transform_M44(.one(), .M44.new(0,0,0,1,0,0,1,0,0,1,0,0,1,0,0,0))
```
___
**Notes:**
- Type `M44` from `CommonTypesMath` library.
transform_normal_Matrix(a, M)
Transforms a vector by the given matrix.
Parameters:
a (Vector3 type from RicardoSantos/CommonTypesMath/1) : `Vector3` Source vector.
M (matrix) : `matrix` A 4x4 matrix. The transformation matrix.
Returns: `Vector3` Generated new vector.
___
**Usage:**
```
mat = matrix.new(4, 0)
mat.add_row(0, array.from(0.0, 0.0, 0.0, 1.0))
mat.add_row(1, array.from(0.0, 0.0, 1.0, 0.0))
mat.add_row(2, array.from(0.0, 1.0, 0.0, 0.0))
mat.add_row(3, array.from(1.0, 0.0, 0.0, 0.0))
b = .transform_normal_Matrix(.one(), mat)
```
transform_normal_M44(a, M)
Transforms a vector by the given matrix.
Parameters:
a (Vector3 type from RicardoSantos/CommonTypesMath/1) : `Vector3` Source vector.
M (M44 type from RicardoSantos/CommonTypesMath/1) : `M44` A 4x4 matrix. The transformation matrix.
Returns: `Vector3` Generated new vector.
___
**Usage:**
```
a = .transform_normal_M44(.one(), .M44.new(0,0,0,1,0,0,1,0,0,1,0,0,1,0,0,0))
```
___
**Notes:**
- Type `M44` from `CommonTypesMath` library.
transform_Array(a, rotation)
Transforms a vector by the given Quaternion rotation value.
Parameters:
a (Vector3 type from RicardoSantos/CommonTypesMath/1) : `Vector3` Source vector. The source vector to be rotated.
rotation (float ) : `array` A 4 element array. Quaternion. The rotation to apply.
Returns: `Vector3` Generated new vector.
___
**Usage:**
```
a = .transform_Array(.one(), array.from(0.2, 0.2, 0.2, 1.0))
```
___
**Reference:**
- referencesource.microsoft.com
transform_Quaternion(a, rotation)
Transforms a vector by the given Quaternion rotation value.
Parameters:
a (Vector3 type from RicardoSantos/CommonTypesMath/1) : `Vector3` Source vector. The source vector to be rotated.
rotation (Quaternion type from RicardoSantos/CommonTypesMath/1) : `array` A 4 element array. Quaternion. The rotation to apply.
Returns: `Vector3` Generated new vector.
___
**Usage:**
```
a = .transform_Quaternion(.one(), .Quaternion.new(0.2, 0.2, 0.2, 1.0))
```
___
**Notes:**
- Type `Quaternion` from `CommonTypesMath` library.
___
**Reference:**
- referencesource.microsoft.com

Index_and_Commodity_PricesThis indicator shows real-time current day-to-day performance of 18 different indices and commodities . Here is the list of different sector ETFs that this indicator tracks
/////INDEX//////
1. BİST-100 - XU0100 - TR- Index
2. BİST-30 - XU030 - TR - Index
3. VİOP-30 - XU030D1! - Index
4. DJI - Dow Jones - Index
5. DAX - DAX Index
6. VIX - Volatilite S&P Index
//////FOREX MARKET/////
7. DXY - U.S. Dollar Index
8. EURUSD -
9. BTCUSD -
10. XAUUSD -
11. XAGUSD -
//////COMMODITY///////
12. BR1! - Brent
13. NG1! - Natural Gas
14. HRC1! -
15. ZW1! -
16. HG1! -
17. DJUSCL -
///////OTHER///////
18. US10Y -
RSI adjusted SuperTrendThis script is a variation on the SuperTrend.
The original function is from Tradingview, the difference is that I added a calculation with RSI
First 50 is subtracted from the RSI.
The absolute value of this number is on its turn divided with 100 or 50 (settings: 'Divide RSI value by')
-> this gives the 'aRSI', which is similar to a percentage
Finally a last calculation is made:
- lower * 'aRSI' is subtracted from the lower band
- upper * 'aRSI' is added to the upper band
If you want to see the Regular ST -> Toggle 'Show Regular ST'
Settings:
- factor (for both SuperTrends)
- ATR length (for SuperTrends)
- RSI length (for 'RSI adjusted SuperTrend')
Cheers!

Variable Purchase Options [Loxx]Handley (2001) describes how to value variable purchase options (VPO). A VPO is basically a call option, but where the number of underlying shares is stochastic rather than fixed, or more precisely, a deterministic function of the asset price. The strike price of a VPO is typically a fixed discount to the underlying share price at maturity. The payoff at maturity is equal to max , where N is the number of shares. VPOs may be an interesting tool for firms that need to raise capital relatively far into the future at a given time. The number of underlying shares N is decided on at maturity and is equal to
N = X / St(1 -D)
where X is the strike price, ST is the asset price at maturity, and D is the fixed discount expressed as a proportion 0 > D < 1. The number of shares is in this way a deterministic function of the asset price. Further, the number of shares is often subjected to a minimum and maximum. In this case, we will limit the minimum number of shares to Nmin = X / U(1 -D) if, the asset price at maturity is above a predefined level U at maturity. Similarly, we will reach the maximum number of shares A T = x if the stock price at maturity is equal Nmax = X / L(1 -D) or lower than a predefined level L. Based on Handley (2001), we get the following closed-form solution: (via "The Complete Guide to Option Pricing Formulas")
c = XD / 1-D e^-rT + Nmin(Se^(b-r)T * N(d1) - Ue^-rT * N(d2))
- Nmax(Le^-rT * N(-d4) - Se^(b-r)T * N(-d3))
+ Nmax(L(1-D)e^-rT * N(-d6) - Se^(b-r)T * N(-d5))
where
d1 = (log(S/U) + (b+v^2/2)T) / vT^0.5 ... d2 = d1 - vT^0.5
d3 = (log(S/L) + (b+v^2/2)T) / vT^0.5 ... d4 = d3 - vT^0.5
d5 = (log(S/L(1-D)) + (b+v^2/2)T) / vT^0.5 ... d6 = d5 - vT^0.5
Inputs
Asset price (S)
Strike price (K)
Discount %
Lower bound
Upper bound
Time to maturity
Risk-free rate (r) %
Cost of carry (b) %
Volatility (v) %
Things to know
Only works on the daily timeframe and for the current source price.
You can adjust the text size to fit the screen
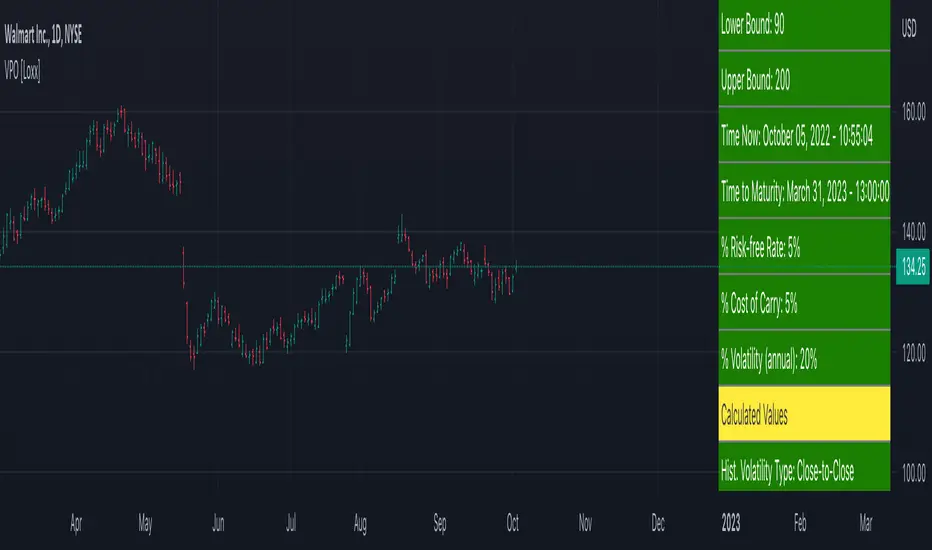
STP Fractal CorridorsFractal Corridors is a lagging channel connecting Fractal highs and lows each with added/substracted pre-set value.
It is inspired and designed for Vladimir Poltoratskiy's trading style with his ST patterns (book: Forex Strategy: ST Patterns Trading Manual).
This uses fractals with one candle lower/higher on each side as in the book.
You may choose to disable fractals and view the channel only.
Good luck trading!

Fractal CorridorsFractal Corridors is a lagging channel connecting Fractal highs and lows each with added/substracted pre-set value.
It is inspired and designed for Vladimir Poltoratskiy's trading style with his ST patterns (book: Forex Strategy: ST Patterns Trading Manual).
However, to keep the charts clearer, I used William's Fractals that require two previous and following candles to be higher/lower opposed to just one as described in the book.
You may choose to disable fractals and view the channel only.
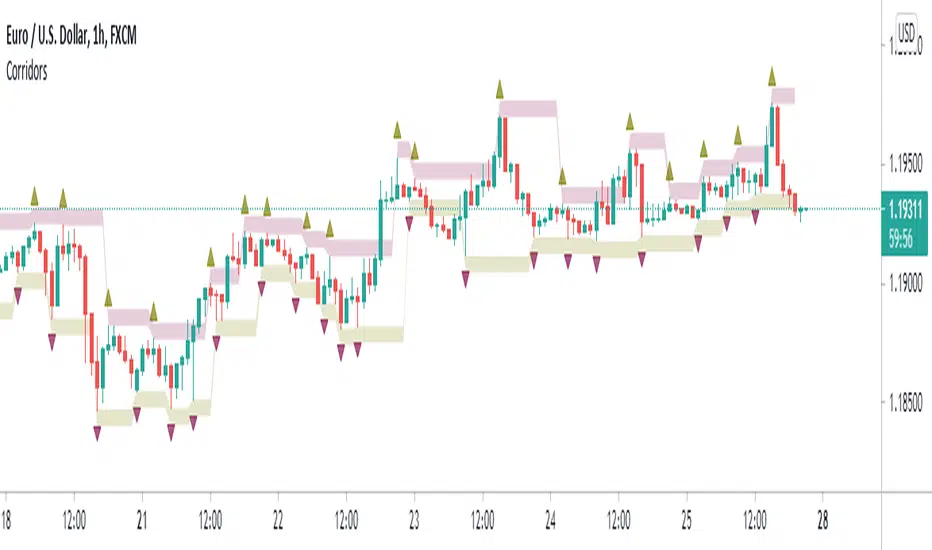
Divergence of Stocks Above MA50 v.s. US-Stock MarketEnglish:
This indicator has been developed as an early warning tool to estimate the probability of correction in the US stock market. It works best in the daily chart.
Function:
1.) "Index-line"
The underlying stock index is converted to a scale between 0% and 100% based on its 52-week highs and lows. Where 100% is closing price at 52-week high and 0% is closing price at 52-week low.
2nd) "Stocks Above MA50".
For each major stock index, there is an index that determines the percentage of stocks above its 50 moving average. For example, for the S&P 500, this is the S5FI.
3) "Divergence
In an efficient market, both lines (index and number of stocks above the 50 MA) would run more or less in sync. A new high in the index would also mean a new high in the stocks trading above the 50 moving average. Often, however, a correction in the index is announced when the number of stocks trading above their 50 MA do not make a new, or even a lower, high while the underlying index marks a new high. The divergence signal measures this divergence of the indices. The higher the bar, the more pronounced the divergence.
How to read the indicator?
If a divergence occurs, then the stops should be tightened. As with any indicator, false signals can occur because a divergence does not automatically lead to a correction. The higher the divergence is indicated, the higher the probability. The strength of a correction cannot be predicted with the indicator.
For which symbols does the indicator work?
The indicator works exclusively for the following symbols:
S&P500: SPX, SPY, ES1!, US500 Index above MA50: S5FI
Russel2000: IWM, US2000, RTY1!, RUT, IWO Index above MA50: R2FI
NASDAQ100: NDX, NAS100, NQ1!, US100, QQQ Index above MA50: NDFI
NASDAQ: IXIC, ONEQ, QCN1!, NDAQ Index above MA50: NCFI
NYSE: XAX, NYA Index above MA50: MMFI
DowJones100: DJX, DJI, DIA, MYM1!, YM1! Index above MA50: DIFI
DowJonesComp: DOW, IYY Index above MA50: DCFI
Deutsch:
Dieser Indikator ist als Frühwarninstrument zur Einschätzung der Korrekturwahrscheinlichkeit im US-Aktienmarkt entwickelt worden. Er funktioniert am besten im Tages-Chart.
Funktion:
1.) „Index-line“
Der zugrunde liegende Aktienindex wird bezogen auf seine 52Wochen Hochs und Tiefs in eine Skala zwischen 0% und 100% umgerechnet. Dabei sind 100% Schlusskurs auf 52-Wochen Hoch und 0% Schlusskurs auf 52-Wochen Tief.
2.) „Stocks Above MA50“
Zu jedem Hauptaktienindex gibt es einen Index, der den Prozentwert der Aktien über Ihrem 50 gleitenden Durchschnitt ermittelt. Beim S&P 500 ist das z.B. der S5FI.
3.) „Divergence“
In einem effizienten Markt würden beide Linien (Index und Anzahl Aktien über dem 50 MA) mehr oder weniger synchron laufen. Ein neues Hoch im Index würde auch ein neues Hoch bei den Aktien, die über dem 50 gleitenden Durchschnitt notieren, bedeuten. Oft jedoch kündigt sich eine Korrektur im Index an, wenn die Anzahl der Aktien, die über ihrem 50 MA notieren kein neues, oder sogar ein niedrigeres Hoch machen, während der zu Grunde liegende Index ein neues Hoch markiert. Das Divergenz-Signal misst diese auseinanderlaufen der Indices. Je höher der Balken, umso stärker ist die Divergenz ausgeprägt.
Wie ist der Indikator zu lesen?
Wenn eine Divergenz auftritt, dann sollten die Stopps enger herangezogen werden. Es kann wie bei jedem Indikator zu Fehlsignalen kommen, da eine Divergenz nicht automatisch zu einer Korrektur führen muss. Die Wahrscheinlichkeit ist um so höher, je höher die Divergenz angezeigt wird. Die Stärke einer Korrektur kann mit dem Indikator nicht prognostiziert werden.
Für welche Symbole funktioniert der Indikator?
Der Indikator funktioniert ausschließlich für folgende Symbole:
S&P500: SPX, SPY, ES1!, US500 Index über MA50: S5FI
Russel2000: IWM, US2000, RTY1!, RUT, IWO Index über MA50: R2FI
NASDAQ100: NDX, NAS100, NQ1!, US100, QQQ Index über MA50: NDFI
NASDAQ: IXIC, ONEQ, QCN1!, NDAQ Index über MA50: NCFI
NYSE: XAX, NYA Index über MA50: MMFI
DowJones100: DJX, DJI, DIA, MYM1!, YM1! Index über MA50: DIFI
DowJonesComp: DOW, IYY Index über MA50: DCFI

[SerDarK] SMA RSI Engulfing BarENG: This indicator includes the SMA line colored according to the price position, the RSI to identify the bearish or the bullish points, the Engulfing bars, the clock and the information panel showing the countdown to the candle closing.
SMA: default period is set to 50. It can change from the settings.
Definition of SMA line default colors: When the price is below the SMA line, its color is blue. It is green when the price is above the SMA line. It is yellow in RSI alerts and when the price hits the SMA line.
RSI: default period 14 is set. It can be changed in the settings.
🔨 Hammer Emoji: RSI is located at the overbought turnaround point. This sign does not mean that the trend will definitely return.
🚀Rocket Emoji: Tries to catch the "RSI oversold point turn".This sign does not mean that the trend will definitely return.
↗️↘️Up and Down arrows emojis. After the price crosses the SMA line, it indicates that it is closing a candle in that direction.
Engulfing candles: bullish engulfing candle is blue color. Bear engulfing candle is black in color.colors can be changed in settings.
Note that this indicator is only an indicator. It does not give advice on buying or selling.
Enjoy
TUR: Bu indikatör, fiyat konumuna göre renklendirilmiş SMA çizgisi, RSI ile düşüş veya yükseliş noktalarını belirleme, Engulfing (Yutan) barlar , saat ve mum kapanışı için geri sayım gösteren bilgi paneli içermektedir.
SMA: varsayılan periyodu 50 ayarlıdır. Ayarlardan değiştirebilir.
SMA çizgisi varsayılan renklerinin tanımı: Fiyat SMA çizgisi altında iken rengi mavidir. Fiyat SMA çizgisi üstünde iken yeşildir. RSI uyarılarında ve fiyat SMA çizgisine temas ettiğinde sarı renktedir.
RSI: varsayılan periyodu 14 ayarlanmıştır. Ayarlardan değiştirilebilir.
🔨 Çekiç Emojisi: RSI aşırı alım dönüş noktasında bulunur. Bu işaret trendin kesin döneceği anlamına gelmez.
🚀Roket Emojisi: "RSI aşırı satım noktası dönüşünü "yakalamaya çalışır. Bu işaret trendin kesin döneceği anlamına gelmez.
↗️↘️Yukarı ve Aşağı yönlü okl emojileri. Fiyat SMA çizgisini kestikten sonra, o yönde mum kapattığını gösterir.
Engulfing mumları: bullish engulfing (yutan boğa) mumu mavi renktir. Bear engulfing (yutan ayı) mumu siyah renktir. Renkler ayarlardan değiştirilebilir.
Not: Bu indikatörün yalnızca gösterge olduğunu unutmayın. Alma satma tavsiyesi vermez.
Kalan süre etiketi BIST gibi sınırlı süreli sembollerde, gün ve daha üstü periyotlarda doğru çalışmayabiliyor.
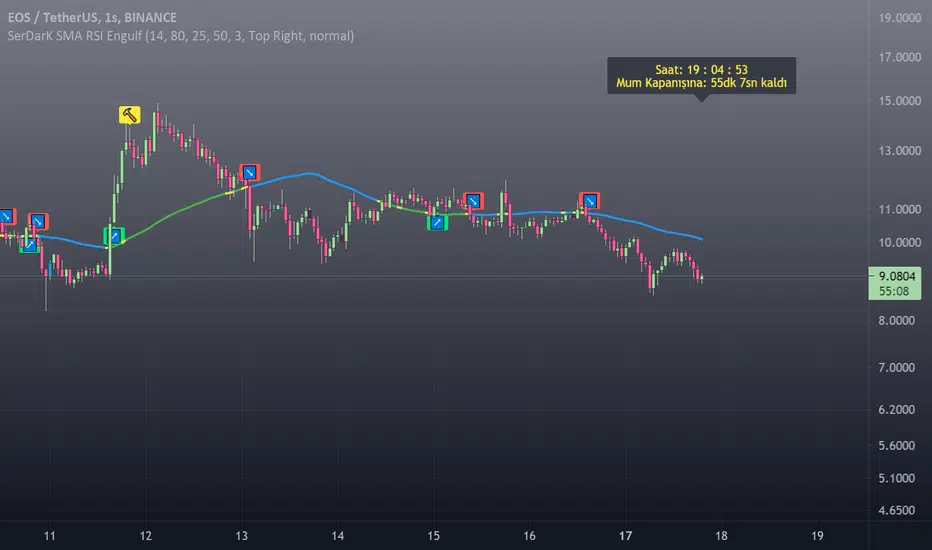
Standard deviation zones Support & Resistance [LM]Hi Guy,
I would like to introduce you Standard deviation zones Support & Resistance horizontals. It draws line horizontals on high and low st dev zone. The colors are dynamic depending whether price is below or above the line.
Credit is due to @Zeiierman for st dev zone calculation so shout out to him.
There are various sections in setting:
general setting where you can select source for zone calculation
tops setting
bottom setting
show and hide section of the first timeframe
show and hide section of the second timeframe
Be aware that when new zone starts and is not finished yet than the top will trail the high of unfinished zone that could be also at the high of current candle and next candle it can change
Any suggestions are welcomed

ema based pseudo RSI - JDIf you reverse engineer the "50-level" of the 14 period rsi, you end up with almost exactly the 27 period ema
So to calculate the rsi, you can 'reverse engineer' the 'reverse engineered rsi'.
This can be done by taking the distance between the current price and the "50-level ema"
you can then normalise this by dividing with the atr or the st dev to end up with a chart that's almost exactly like the rsi line
As OB/OS levele, a multiplier of the atr or st dev can be used
one application for this is to quickly refer to MTF rsi levels by multiplying th 27 ema value with the timeframe multiplier
as it turns out, I discovered that the ema's with multiples of 27 as a period align with the 50-level line of the rsi of all the corresponding timeframes.
Enjoy!
JD.
#NotTradingAdvice
#DYOR