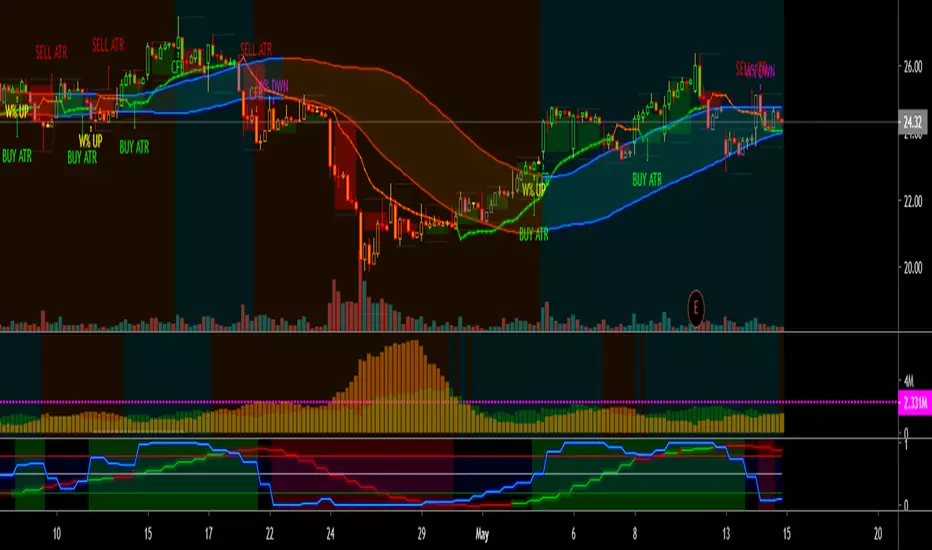
Palex SENSACIONALScript criado com base na visão do Mestre Palex, com alguns adicionais.
Esse modelo possui as médias exponenciais: 9, 21 Tabajara(Ogro), 72, 200, 400, 400W(Wilder), 9 e 21 do Diário e 9 do Semanal (Ótimo para prazos intra-days).
Inseri a Linha Dagua para não se afogar, VWAP para não ser mordido por tubarões e a mudança na cor do candle ao tentar encontrar alguma TSI e TSS .
Contém as estratégias 9.1.2.3.4 do Larry Williams e Ponto Contínuo do Stomer.
SENSACIONAL.
"williams" için komut dosyalarını ara

PpSignal twiggs_money_flowTwiggs Money Flow is my own derivation, based on the popular Chaikin Money Flow indicator, which is in turn derived from the Accumulation Distribution line. We are all indebted to Marc Chaikin and Larry Williams for the contribution they have made to the field of technical analysis and price-volume oscillators.
for more information visite: www.incrediblecharts.com

PpSignal CFB Tren Follow V 1.0 Stock and Indicesthis strategy is based in strong signal of analysis trend (CFB and 2), volatility (ATR & STD Band) and volume.
when we have the first CFB 1 alarm ( green buy signal) we must wait until the price breaks out the upper band of the ATR MA, you have atr alarm ma option signal in the setup of indicator.
we can enter in the 3rd time when the cfb 2 give you the 3 signal blue buy color alarm.
The indicator also has an exit alarm option when the price goes into the ATR band.
It also has a smoothed W% alarm.
enjoy it

PpSignal ATR MA Band V2.1this indicator is based on the idea of acceleration bands, only that the algorithmic calculation is totally different and more accurate
ATR or accelerator Bands Quick Summary
Breakout outside ATR bands suggest a beginning of a strong rally or a sell-off.
Closing inside the bands afterward signals about the end of a rally or a sell-off.
The idea behind Acceleration Bands indicator
Acceleration Bands principal use is in finding the acceleration in currency pair price and benefit as long as this acceleration preserves.
How to trade with AB indicator
2 consecutive closes outside Acceleration Bands suggest an entry point in the direction of the breakout. Then position is kept till the first close back inside the Bands.
this indicator also shows us the trend, using CFB as a signal.
It also uses W% smoothing, when the CFB trend, the W% and the escape of the bands going to the same side is a strong signal of purchase or sale.
You may find other alarms within the indicator such as: W% signal
escape from the price of the bands.
price entry to the bands
bollinger bans stop, can be used as SL.
and a mobile average based on ATR.
You can to combine this indicator with:
related pre indicators
Extreme IndicatorIdentifies price extreme points based on a highest/lowest price lookback. There are many other goodies hidden in this indicator including a built in ATR trailing stop that will flip up and down.
The inspiration of this indicator is based on this idea .
Willams %R with 13 EMA and 13 SMAThis is standard Williams %R originally written by another user that I modified. Credit to him whose name escapes me at the moment. The green line is 13EMA and red line is 13SMA (offset by 2 for timing trades). Great for very quick trades/day trades. Green over red = long. Red over Green = short.
Beware: this is still a choppy indicator. You'll need to use it with the Ichimoku lagging span, chop indiicator, adx, or some other method of avoiding getting chopped to death trying to take every signal.
TrendMaster PremiumTrendMaster
TrendMaster is a complete trend following system with strict entry, exit and trade management criteria. The indicator is optimised for weekly, daily and 4-hour candlesticks and can be used for all trending markets. It was developed primarily for less experienced traders that struggle to determine relevant information from irrelevant information when viewing a candlestick chart. The indicator was built to solve the problem that all new traders face.
Setting Up The Indicator
After purchase, open the TradingView indicator library. Under the Invite-Only Scripts section, you will see TrendMaster. Add it to your chart. Next, you must customise your theme settings to allow TrendMaster to take over control of your candle colours. You can find a complete set-up tutorial on our website.
The Cloud
The indicator includes a moving average cloud which serves as a visual guide to local support and resistance. For a signal candle to print, price must trade above the moving average cloud and above the medium-term trend. By requiring multiple criteria we drastically reduce false entries. When price exits the cloud to the upside it typically trends above and finds support at the cloud during retracements.
Candle Colours
By default, TrendMaster will colour your candles in black and white. White candles indicate an uptrend in an asset and the candles will not change colour until the trend has reversed and a counter-trend signal has been printed. Black candles indicate a downtrend, they will remain black until a counter-trend long signal candle has been printed.
Signal candles
A signal candle is printed when the price of an asset closes above or below the moving average cloud and the medium term trend moving average. By requiring two criteria for a single candle to print we will see a drastic reduction in the number of false signals.
The TrendMaster entry technique further reduces the likelihood of false entries. To enter a trade we do not buy the signal candle immediately. Instead, we treat the signal candle as an indication that a trend change is possible. We want to see confirmation of this trend before making an entry. To enter we place a pending order a few ticks above or below the high or low of the signal candle. By doing this we only enter a trade when the asset has shown a continuation in the direction of the suggested trend change.
Once a trade has been taken we remain in that trade until either we have been stopped out on the break of a Williams fractal or the trend has reversed by printing an opposite to trend signal candle. It is important that we remain with the trend to ensure that we capture the maximum opportunity available.
If you would like to use TrendMaster or any of our other Indicators, please visit my site. Here you can purchase one of our packages which include indicators, market scanner bots and a large Discord community. You will also find educational content and how to guides for our indicators.
Our Story
Founded in 2018 by IchimokuScholar and C00kie, TrendMaster is a team that produces technical analysis indicators with an emphasis on simplicity and noise reduction. We support a large community with educational content, automated market scanners and mentoring in our private chat rooms. We produce technical analysis indicators geared primarily towards the emerging Cryptocurrency asset class. We provide educational material to assist trader development and host a large online trend following community. All of our products are designed to help traders distinguish relevant information from background noise. Our indicators encourage disciplined trade management to maximise the opportunity captured while minimising losses.
IchimokuScholar
IchimokuScholar – In 2017 I retired from a career in higher education to focus on Trading. I like to trade long term trends, focusing primarily on continuation setups. I am dedicated to sharing my knowledge of trading and take great pleasure in simplifying technical analysis for newer traders.
C00kie
I started trading crypto in 2017 and immediately started coding a bunch of tools to improve my quality of life. Some definitely worked out better than others. Like to trade the higher timeframes and drawing horizontal lines on charts. I am also pretty much obligated to like cookies.

Combo Strategies 123 Reversal and Accelerator Oscillator (AC) This is combo strategies for get
a cumulative signal. Result signal will return 1 if two strategies
is long, -1 if all strategies is short and 0 if signals of strategies is not equal.
First strategy
This System was created from the Book "How I Tripled My Money In The
Futures Market" by Ulf Jensen, Page 183. This is reverse type of strategies.
The strategy buys at market, if close price is higher than the previous close
during 2 days and the meaning of 9-days Stochastic Slow Oscillator is lower than 50.
The strategy sells at market, if close price is lower than the previous close price
during 2 days and the meaning of 9-days Stochastic Fast Oscillator is higher than 50.
Second strategy
The Accelerator Oscillator has been developed by Bill Williams
as the development of the Awesome Oscillator. It represents the
difference between the Awesome Oscillator and the 5-period moving
average, and as such it shows the speed of change of the Awesome
Oscillator, which can be useful to find trend reversals before the
Awesome Oscillator does.
WARNING:
- This script to change bars colors.
Momentum & Williams %R This strategy join 2 power study indicators on the same plot: Willian %R and Momentum.
Willian %R can indicate the good time for you buy or sale. Less than -80 indicate good buying opportunity . Greater than -20 good sale opportunity.
Momentum can indicate the good price for buy or sale, in other words, can indicate the speed the price goes down or goes up.
By Baldasso, March 2019.

Trading ChaosДанный советник создан по мативам бессмертного произведения Билла Вильямса. Для определения наилучшей точки в хода в начале разворотного движения рекомендуется использовать с индикатором "MFI" "Williams Fractals" и "Volume".

PpSignal Inver Fisher WilliamsThe Inverse Fisher Transform (IFISH) was authored by John Ehlers. The IFISH applies some math functions and constants to a weighted moving average (wma) of the relative strength index (rsi) of the closing price to calculate its oscillator position. The user may change the input (close) and period lengths. This indicator’s definition is further expressed in the condensed code given in the calculation below.
www.motivewave.com

PpSignal ATR MA BandPpsignal Atr Move Average Band is my self development.
Trading:
- Buy when the price break out the upper band and W% is green.
- Sell when the price break out the lower band and W% is orange.

Traderset Uni Renko - Awesome OscillatorThis is simply Bill Williams AO oscillator, fabricated with predefined numbers to better fit the Uni Renko charts and my methodology. The reason for publishing this version is that the original numbers (you can see them on the top instance of the oscillator) does not behave that much satisfactory when it comes to renko charting in my methodology !
The AO is not a part of my methodology nor Alligator, but i know some people who would like to have these two tools in renko charts. Here you have it.

WillSpread IndexDescription Source: www.instaforex.com
The technical indicator Will-Spread was developed by Larry Williams and described in his book Long-Term Secrets to Short-Term Trading. Will-Spread is one of the strongest financial indicators, which measures the flow of price between the primary market and a secondary market. The purpose of this comparison is to highlight signals for opening/closing positions of a financial asset through market signals that have influence on this particular asset. Once the Will Spread turns positive, look for the next bar to be above bar when Will spread turned positive to get long.
Indicator Use
Trading use The main method of using Will-Spread is watching the way it crossing the zero line. If the indicator crosses the zero line upward, rising trend is likely to continue. When the indicator falls below the zero line, there is an obvious downtrend. The author offered to use the indicator in trading from the standpoint of a filter: when Will-Spread crosses the zero line, a trader should wait for the formation of the bar that follows after the signal. In case the new bar generates a high/low above/below the previous one, a trader should open position. It is not recommended to open position if the bar does not form a new high/low.
The spread (A/B *100) takes two underlyings, get the exponential average creating exponential period (5) and subtract from another exponential period (20). The example he gives is that bonds move stocks, so we take the S&P and bonds. Get a will spread of SPY & TLT.

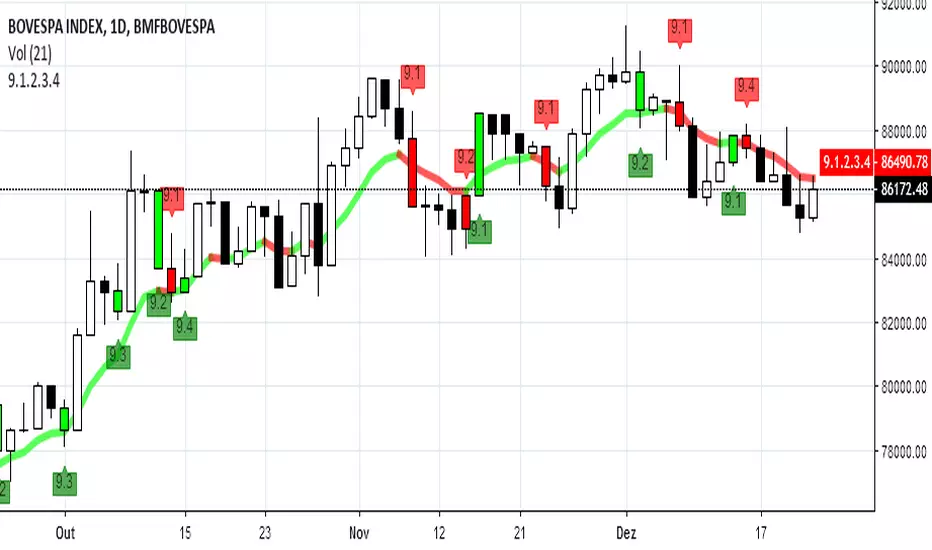
Setup 9.1.2.3.4---IN-US---
Hi traders, created by the professional Trader Larry Willians this trade system is based on 9 EMA, they are called 9.1, 9.2, 9.3 and 9.4.
Setup EMA 9.1
Allowed to buy when EMA 9 period turns to up after a Leg down, and to sell when turns to down after a Leg up.
Setup EMA 9.2
1) Find a stock with 9 EMA uptrend.
2) Wait for a close below the last candle low and mark the high of it candle.
3) If the price doesnt across the high, mark the next high.
4) Buy when the price cross the mark.
5) Stop-loss in the low of the marked candle.
Setup 9.3
1) Find a stock with the 9 period EMA uptrend.
2) Look for a close which is followed by two lower closes,
3) Mark the high of the last candle.
4) Buy when the price cross the mark.
5) Stop-loss in the low of the marked candle.
Setup EMA 9.4
1) Find a stock with 9 EMA uptrend and turns down, but the low of the candle which made turn go down can't be lose, 9 EMA can go down ONLY ONE candle.
2) Wait for 9 EMA go up in the next candle and mark the high.
3) If the price doesnt across the high, mark the next high.
4) Buy when the price cross the mark.
5) Stop-loss in the low of the marked candle.
--PT-BR---
Olá traders, setup universal, criado pelo famoso Trader Larry Williams , e divulgado pelo Trader Palex. Setup baseado na MME de 9 períodos. Temos aqui o conjunto de sinais 9.1, 9.2, 9.3, 9.4.
Setup MME 9.1
Setup MME 9.2
1) Achar ativo com a MME9 subindo;
2) Aguardar fechamento abaixo da mínima do candle anterior e marcar a máxima desse candle;
3) Se a máxima não for rompida, marcar a próxima máxima;
4) Compra no rompimento dessa máxima (qualquer negócio acima dessa máxima);
5) Stop na mínima do candle anterior ao que gerou a entrada;
Setup MME 9.3
1) Achar ativo com a MME9 esteja subindo;
2) Procurar 1 fechamento que seja seguido por dois fechamentos seguidos descendentes (abaixo do "candle referência") e marcar máxima do último candle;
3) Se a máxima não for rompida, marcar a próxima máxima;
4) Compra no rompimento dessa máxima (qualquer negócio acima dessa máxima);
5) Stop na mínima do candle anterior ao que gerou a entrada;
Setup MME 9.4
1) Achar ativo com a MME9 esteja subindo; A MME9 vem subindo e vira para baixo, mas o candle que fez essa virada ocorrer não tem a mínima perdida e a MME9 volta a virar para cima no candle seguinte. Só pode ficar virada pra baixo 1 candle e logo no candle seguinte a média vira pra cima.
2) Marcamos a máxima do candle que fez a MME9 virar para cima e no seu rompimento temos a entrada na
ponta compradora.
3) Se a máxima não for rompida, marcar a próxima máxima;
4) Compra no rompimento dessa máxima (qualquer negócio acima dessa máxima);
5)Stop-loss na mínima do candle que fez a MME9 virar para baixo.
Bons trades a todos.
BO Willians EMA'sBo Williams is a North America/Brazilian trader. He created a trading software called PHI CUBE.
This ema ratios are very used in Brazil. They a based in the Golden Number PHI.
"There is a special ratio that can be used to describe the proportions of everything from nature's smallest building blocks, such as atoms, to the most advanced patterns in the universe, such as unimaginably large celestial bodies. Nature relies on this innate proportion to maintain balance, but the financial markets also seem to conform to this "golden ratio." Here, we take a look at some technical analysis tools that have been developed to take advantage of it.
The Mathematics
Mathematicians, scientists and naturalists have known this ratio for centuries. It's derived from something known as the Fibonacci sequence, named after its Italian founder, Leonardo Fibonacci (whose birth is assumed to be around 1175 A.D. and death around 1250 A.D.). Each term in this sequence is simply the sum of the two preceding terms (1, 1, 2, 3, 5, 8, 13, etc.).
But this sequence is not all that important; rather, it is the quotient of the adjacent terms that possesses an amazing proportion, roughly 1.618, or its inverse 0.618. This proportion is known by many names: the golden ratio, the golden mean, PHI and the divine proportion, among others. So, why is this number so important? Well, almost everything has dimensional properties that adhere to the ratio of 1.618, so it seems to have a fundamental function for the building blocks of nature. "
More here www.goldennumber.net
