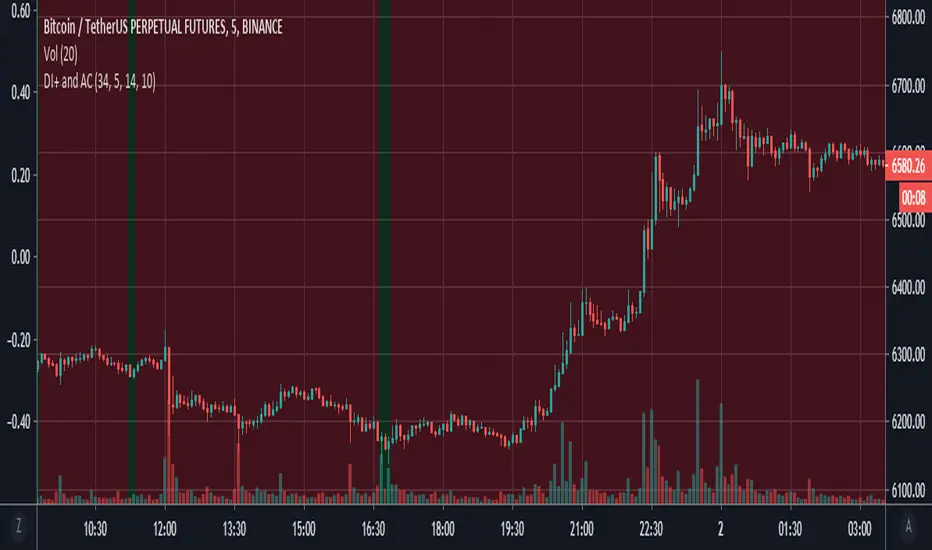
DI+ and ACThis script utilizes the Directional Movement Plus from the Directional Movement Index and Accelerator Oscillator (developed by Bill Williams to be based off of the Awesome Oscillator ) indicator to determine an entry signal. When the DI+ goes to a low value (<= 10), there is a high probability that a downtrend reversal may occur. The Accelerator Oscillator ( AC ) is used to compliment this theory by looking at the strength of the trend. As the AC shows weakening downtrend acceleration, we can confirm a potentional long entry.
"williams" için komut dosyalarını ara
CuandoCrypto's Swing Trade IndicatorThis indicator combines RSI, MACD, Williams %R and Z-Score to determine if there's a high probability of an imminent trend reversal. This indicator is best used on higher timeframes.

Haos Visual DivergencesThe Haos Visual is a trend indicator consisting of two WIlliams % indicators.
I have added divergences to spot trend reversals within assets, divergences have no repaint and require single candle confirmation.
www.prorealcode.com

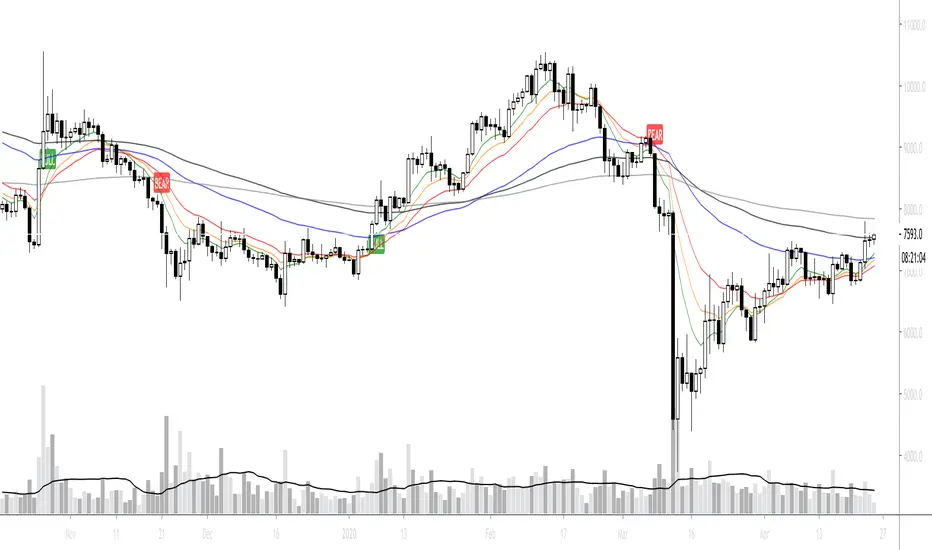
Trade System Crypto InvestidorTrade System created to facilitate the visualization of crossing and extensions of the movements with Bollinger bands.
Composed by:
Moving Averages of 21, 50, 100 and 200.
Exponential Moving Averages: 17,34,72,144, 200 and 610.
Bollinger bands with standard deviation 2 and 3.
How it works?
The indicators work together, however there are some important cross-averages that need to be identified.
- Crossing the MA21 with 50, 100 and 200 up or down will dictate an up or down trend.
- MA200 and EMA200 are excellent indicators of resistance and support zone, if the price is above these averages it will be a great support, if the price is below these averages it will indicate strong resistance.
- Another important crossover refers to exponential moving averages of 17 to 72 indicates a possible start of a trend
- The crossing of the exponential moving average of 34 with 144 will confirm the crossing mentioned above.
- In addition, the exponential moving average of 610 used by Bo Williams is an excellent reference for dictating an upward or downward trend, if the price is above it it will possibly confirm an upward trend and the downside.
- To conclude we have bollinger bands with standard deviation 2 and 3, they help to identify the maximum movements.

AO + AC with Buy/Sell SignalsThis is the Awesome / Accelerator Oscillator originally developed by Bill WIlliams, and includes shapes and alerts which correspond as Buy and Sell signals.

Momentum Sentiment Indicator by mattzabThis indicator uses 3 moving averages and includes volume to display sentiment and momentum.
By default, a 5, 8, and 13 SMA is displayed (black lines).
The colored bands are the corresponding volume weighted moving averages.
When the colored band is above the black line, sentiment is bullish.
Think of the color as being a show of volume, and the black lines as support and resistance.
When the lines are trending up, and colors are above the black lines, an uptrend is in progress.
When the colors are mixed above and below, and the lines are intertwined, it is a ranging market.
The lines operate similar to the Williams Alligator.

ORTI Bollinger Bands V3 (Static Timeframe Multi-Period)The "ORTI Bollinger Bands V3 (Static Timeframe Multi-Period MA)" is public scrypt, based in a previous study, but with some better functions (“ORTI Bollinger Bands V2 (Static Timeframe Multi-Period MA”).
This is a redesigned and recalculated set of the common plotted lines with the typical two "Standard Deviations" (positively and negatively) away from the original calculation of a "Simple Moving Average" of the security's price.
But now, with the option to convert the "Simple Moving Average" to adapt into 9 different kinds of "Moving Averages", to have a much more robust indicator which in turn would serve both as "Bollinger Bands" and by any of the most used "Moving Averages", a hybrid basically.
The following options to convert the "Simple Moving Average" ( SMA ) to:
• Exponential Moving Average ( EMA )
• Weighted Moving Average ( WMA )
• Arnaud Legoux Moving Average ( ALMA )
• Hull Moving Average ( HMA )
• Volume-weighted Moving Average ( VWMA )
• Least Square Moving Average ( LSMA )
• Smoothed Moving Average ( SMMA )
• Double Exponential Moving Average ( DEMA )
The cherry on the top , for this private version: is when you want to get a predetermined count in "natural temporalities" as minutes, hours or days, in any graph you could get a static average, and this count will be automatically respected. For example, a "Moving Average" could be configurated to know a trend per day, week or month... or whatever comes to mind, and at every single chart that you move through (5m, 15m, 1h, 4h, etc), you will see the same average to make your own "trend analysis" into a micro/macro market view.
As in traditional "Bollinger Bands", the "Standard Deviations" are still a measure of volatility , when markets become more volatile, bands widen, during the less volatile periods, the bands contract.
A common fact in trading is that, prices vary most of the time and there is a lot of truth in this assertion, since the markets consolidate mainly as bullish andbearish . Market trends are sometimes very rare, so trading them may not be as easy as you might think. If we look at prices in this way, we can define the trend as a deviation from the norm (rank).
Usually, most Traders use “Moving Averages” to identify commercial areas and analyze markets. A “Moving Average” helps the Trader isolate the trend a lot and can also indicate when a trend may be receding.
The importance of using any of the “Moving Averages” in the “Bollinger Bands”, becomes a reality and reveals the average price of a marketable instrument in a given period of time. However, there are different ways to calculate the averages, and that is why there are different types of “Moving Averages”. They are called "in motion" because, as the price moves, new data is added to the calculation, thus changing the average.
The base of the “Bollinger Bands” measures and represents the deviation or volatility of the price and this is the reason why they can be very useful to identify a trend. Even the use of two sets of “Bollinger Bands”, one generated with the parameter "one Standard Deviation" and the other with the typical configuration of "two Standard Deviations", can help us to see the price in a different way.
Another great advantage of “Bollinger Bands” is that, they adjust dynamically as volatility increases and decreases. As a result, the “Bollinger Bands” automatically expand and contract in synchronization with the price action, creating an envelope of precise trends.
Note: The previous calculation example is not the default, the parameters can be adjusted according to the criteria of the merchant.
As everyone knows, and as you can find on the internet, the "Moving Averages" are one of the most commonly used technical indicators in Stock, Futures , Forex and Crypto trading. Market analysts and traders, use "Moving Averages" to help identify trends in price fluctuations, smoothing out the noise and short-lived spikes (from news and earnings announcements, for example) for individual securities or indexes.
They are calculated by adding recent closing prices and then dividing that by the number of time periods in the calculation average. A simple, or arithmetic, a "Moving Average" that is calculated by adding the closing price of the security for several time periods and then dividing this total by that same number of periods. Short-term averages respond quickly to changes in the price of the underlying, while long-term averages are slow to react.
There are different types of "Moving Averages", calculated in different ways and over different time periods, which reveal different information for traders. The type of "Moving Average" and measurement period used determine the strategies a trader implements. So, many traders watch for short-term averages to cross above longer-term averages to signal the beginning of an uptrend. Short-term averages can act as levels of support when the price experiences a pullback.
As is usual, traders and market analysts commonly use several periods in creating "Moving Averages" to plot on their charts. For identifying significant, long-term support and resistance levels and overall trends, but they only consider the 50-day, 100-day and 200-day moving averages as the most common. Based on historical statistics, these longer-term moving averages are considered more reliable trend indicators and less susceptible to temporary fluctuations in price.
There is such popular trading patterns that use "Simple Moving Averages" include the “death cross” and a “golden cross”. A “death cross” occurs when the short period "Moving Average" crosses below the long period "Moving Average" and this is considered abearish signal that further losses are in store; the “golden cross” occurs when a short-term "Moving Average" breaks above a long-term moving average, this can signal further gains are in store, that is interpreted as bearish .
The 5-, 10-, 20-, and 50-day moving averages are often used to spot near-term trend changes. Changes in direction by any of these shorter-term "Moving Averages" are watched as possible early clues to longer-term trend changes. Crossovers of the 50-day moving average by either the 10-day or 20-day "Moving Averages" are regarded as significant. The 10-day "Moving Average", plotted on an hourly chart, is frequently used to guide traders in intraday trading.
For more technical information: Investopedia
But why we have to use in our TECHNICAL ANALYSISthe same Moving Averages (10, 20, 30, 50, 100 and 200) for all time frame OHLC charts (1m, 5m, 15m, 1h, 4h, 1d, 1w and 1m)? That does not make any sense.
This is when you must go back to (statistic) basics: reliability and validity are a very important aspects of selecting a survey instrument. Reliability refers to the extent that the instrument yields the same results over multiple trials. Validity refers to the extent that the instrument measures what it was designed to measure.
Content validity measures the extent to which the items that comprise the scale accurately represent or measure the information that is being assessed. Are the real traders answering this question, that are asked representative of the possible data that they are trying to read? Well, I think maybe not.
Such as correlations, to verify the relevance of the “timeframe” questions, we could start at… Operation hours, the first data that has you should find may be is correlated with questions from: Does your trend indicator has a straight relationship of time under your time-analisys examination to determine if validity is present? If the scores are highly correlated, it is called convergent validity, then if convergent validity exists and validity is supported.
Criterion-related validity has to do with how well works the counting from the instrument, as a known outcome they are expected in a real, natural and measurable lapse time. Such as correlations are used to determine if criterion-related validity your counting data, would must be at: minutes, days, weeks, months, etc.
That is when we start with the rhythm, as in music. If your trading day in operation at Forex is made up of 24-hours, during 5-days of the week, there you have your first clue. Now, what did you want and have to measure? Well, first of all you need a daily, weekly and monthly count to begin with all your indicators.
For some reason, there are a lot of questions about time and calendars which all are answered by reference to astrology, because the original purpose of astrology was to create a reliable method of measuring the passage of time, the clock by which we live our lives: 12 Hours. It is very interesting!
Even though there are really 24 hours in a day, but therefore you would think we should have 12-time units in our day, not 24, each of which is twice as long as our current hour. But the only reason we would think like this is because we have forgotten about the way ancient astrology divides the time lapses into smaller units.
And now, the next step is when you should refresh your elementary school classes, those mathematics that I'm pretty sure you so hated: relation of prime numbers, compound numbers, divisible numbers and multiples.
You may think about the relationship that exists between the time period and the operative session, as well as the chart that you are consulting; so then, you must find the ideal configuration of those numbers that are only divisible between themselves and 1, or the numbers that besides being divisible by themselves and the unit and are also divisible by other numbers.
For example: for an hourly chart, if a day is divided into 24-hours in base of the number 12, is because it has a larger number of integer factors: 12/6=2, 12/4=3, 12/3=4, 12/2=6. Son then, all of your other indicators should find this relation.
This is when you must start questioning yourself, if you are really working with an adequate configuration of Moving Averages and Oscillators?
Another example:
• Relative Strength Index (14)
• Stochastic %K (14, 3, 3)
• Commodity Channel Index (20)
• Average Directional Index (14)
• Momentum (10)
• MACD Level (12, 26, 9)
• Stochastic RSI Fast (3, 3, 14, 14)
• Williams Percent Range (14)
• Ultimate Oscillator (7, 14, 28)
FilthyIchiEMAXIchiEMAX has been backtested giving some great results, using Ichimoku and a mix of EMA'S/SMA .
I use this for both Cryptocurrency and Forex Trading.
Ema/SmaX system i have studied and have found it is giving me the results i want very similar to all the wave trend indicators being used currently. I have now adde buy/sell signals on crosses and williams fractal.

Normailzed CandleThis indicator normalizes Day's candle with Open. Idea is to see the daily movement in the context of the Open of the Day.
Larry Williams talks about Open being the most important price of the day. Hence, this indicator.
The Green line is average Open-to-High for occurrences of Red days. The Red line is average Open-to-Low for occurrences of Green days.
Average are not perfect calculations since occurrences(of Red or Green) will vary within the time-span used for averages.
These can used to gauge likelihood of the intra-day price reversal. If the price exceeds green/red line, there is higher likelihood of the price closing above/below open.
The blue lines are average Open-to-close for Green and Red occurrences.
Be careful on days where consecutive 3rd Highest High or Lowest Low day is made and also on the next day after such day. Prices may turn direction at least for a short while.
The precursor to this script of the Candle Infopanel script. That script was just numbers in panel and this is a graphical representation. I
Some of the calculations from original script are commented here because it would make visuals clutters (and probably the left-out calculation are not critical to making trade decisions!)

SNAC - AccelerationAcceleration / Deceleration Oscillator (AC) measures the acceleration and deceleration of the current momentum.
Bill Williams says that before the price behaviour changes, the momentum changes and, even before the momentum, we see the change in the acceleration.
A buy above the zero line signal is generated when there are two consecutive green histogram bars. Opposite is true for a sell signal.

Akushyn_AOZotikAkushyn_AOZotik is an complex indicator, that combines several of the most important indicators, tuned to various information coming from the price chart.
This is an indicator of trend and speed, an indicator of strength and cyclicity, an indicator of wave cycles and structures.
One Akushyn_AOZotik indicator can replace the entire Bill Williams indicator set: AO and AC indicators, Alligator , etc.
The indicator performs the following functions:
indicates the direction of the current trend and the moment it changes to the opposite
eliminates the "abnormal bursts" of price movement
limits the flat zone
allows you to identify pivot points
makes it possible to see the potential of movement even before it begins
clearly shows the "ABC algorithm" of wave marking
determines the wave level of corrective movement
synthesizing different time frames, reveals price movements hidden by the market
The fast line of the indicator is a Main Line (ML)
The slow line of the indicator is a Resistance/Support Line (RS).
Zero line of the indicator is a static Balance Line (BL)
When ML is above RS and BL it indicates a bullish state on the chart.
When ML is below RS and BL it indicates a bearish state on the chart.
When ML is in between RS and BL indicates a flat state

ProfitunityCandlesProfitunity Candles have 4 labels, based off Bill Williams' work, particularly in his "Trading Chaos" book....Candles will generally be a Green, Squat, Fade or Fake. This is determined by Volume and MFI....Basically alerting you to the efficiency of the market at any given moment. You can research the meaning of the 4 types on your own, Google is your Friend.

Total Trend Follow Study with Alerts, Pyramid and DCA
Introduction
This is the study version of my trend following strategy. It is designed to be a “drop in” replacement for its twin strategy. I have replicated the analysis logic and entry and exit procedures to produce a nearly identical result set to the strategy. Other than the properties tab, the inputs dialog is exactly the same. Backtest the strategy to determine the best inputs to trade. Then apply the same inputs to this study to forward test. Alerts are available for trade entry, take profit close, stop-loss exit and pyramid level. Please see the strategy version for a complete description of the trading behavior of this script.
In brief, this script is intended to benefit from long duration trending markets. The trading behavior is to buy on strength and sell on weakness. As such the trade orders maintain its directional bias according to price pressure. What you will see on the chart is long positions on the left side of the mountain and short on the right. Long and short positions are not intermingled as long as there exists a detectable trend. My trend following script uses the same pivot point calculations used by my range trader but this time rising pivots are long and falling pivots are short. I refer to pivots as a vertex in the inputs dialog box. The cone based measurement adds a peak, sides and a base to the calculation elements. This allows the inputs to focus on adjusting the location of trades and not just trend lines. The pivot points can be plotted on the backtest. You can use the vertex input values to move the pivots where you want trades to be. This script can be traded in four different modes: Long, Short, BiDir, and Flip Flop.
This script replicates the TradingView pyramid feature by adding a field to the inputs tab. Pyramiding works the same way in this script as its twin strategy. Each pyramid level increases the order size as a multiple of its level. This makes it easy to comply with NFA FIFO Rule 2-43(b) if the trades are executed here in America. The current pyramid level is reported in the summary label when reports are enabled. You can use this value to manually adjust the position size in your forward testing. I also expose an alert when the pyramid threshold is breached. Use the TradingView alert window to send yourself a message when the level increases.
In addition to pyramiding this script employs a DCA feature which can increase the order size in response to stopped out or winning streak trades. The number of losing trades is tracked through the “Debt Sequence” value displayed in the summary report. When the debt is recovered the sequence number resets to zero. You can use the “Debt Sequence” number to manually manage DCA on your forward test. The main difference between DCA and pyramids is that this implementation of DCA applies to new trades while pyramids affect open positions. If DCA is enabled be sure to set the limiter to prevent your account from depleting capital during runaway markets.
I also have a range trading version of this script for those not interested in trend following.
Design
This script is approximately 1800 lines of Pine 4 code and implements nine indicators on two time frames. The chart (primary) interval and one higher time frame which is based on the primary. The higher time frame identifies the trend for which the primary will trade. The original trading algorithms are a port from a much larger program on another trading platform. I've converted some of the statistical functions to use standard indicators available on TradingView. The setups make heavy use of the Hull Moving Average in conjunction with EMAs that form the Bill Williams Alligator as described in his book “New Trading Dimensions” Chapter 3. Lag between the Hull and the EMAs form the basis of the entry and exit points. The alligator itself is used to identify the trend main body.
Indicator Repainting
Indicator repainting is an industry wide problem which mainly occurs when you mix backtest data with real-time data. It doesn't matter which platform you use some form of this condition will manifest itself on your chart over time. The TradingView wiki has an in depth article on this subject in regard to the elements of the Pine language which contribute or are susceptible to this effect. In dealing with this problem from a prevention aspect in Pine, you have to accept some repaint to occur.
The goal of my repaint prevention in the study script is simply to ensure that my signal trading bias remains consistent between the strategy, study and broker. This actually turned out to be kind of a job since it interfered with another project goal to synchronize the entry and exits between the strategy and study scripts. The script execution engines are different between the Pine strategy and study. While the primary chart interval is quite manageable the higher time frame requires the security() function. TradingViewʼs higher time frame implementation, which interleaves the chart interval, combined with the critical “lookahead” parameter makes the solution necessarily complex. According the wiki regarding this issue, best practice comes down to the following two methods:
1. a = security(syminfo.tickerid, 'D', close , lookahead=barmerge.lookahead_on)
2. indexHighTF = barstate.isrealtime ? 1 : 0
indexCurrTF = barstate.isrealtime ? 0 : 1
a0 = security(syminfo.tickerid, 'D', close ,lookahead=barmerge.lookahead_off)
a = a0
This script employs method 2 with the only problem being the Pine sar() function which does not expose its internal bar series. The best work around would require hand coding the parabolic but the script is at the maximum local scopes and run-time duration so that option is not viable. So far, this hasn't proven to be much of a problem. I'm currently running several symbols, forex and crypto, the strategy and study remain highly correlated with no instances of completely opposite real-time signals. However, I have received some alerts with no corresponding plot on the chart but so far it only occurred on one symbol. I will continue to monitor this problem.
The Bottom Line. Does this script repaint. Yes, it will repaint about as much as every other multi-interval script which employs the best practice solutions available in the Pine Language.
Usage
Please be aware that the purpose of the study script is to perform forward testing of the configuration established in the backtest process. Therefore, the usage here in the study begins with the backtest configuration parameters. The following steps provide instructions to get this study script connected to the TradingView alert notification system. For a detailed description of how to create a trend following system using this script please see the strategy version.
Step 1. Create a chart with the trading instrument and interval used in the backtest.
Step 2. Find this script in the “Invite Only” section of the Indicators Dialog and apply it to the current chart.
Step 3. Copy the values from the backtest input dialog to the study.
Step 4. Open the TradingView Alert window.
Step 5. In the “Condition” drop down field find and select the name of the script.
Step 6. A new drop down field will appear with the alerts available in the script. This script exposes the following eight signals:
-- Long Entry Signal
-- Long Profit Signal
-- Long Stop-loss Signal
-- Long Pyramid
-- Short Entry Signal
-- Short Profit Signal
-- Short Stop-loss Signal
-- Short Pyramid
Select the signal for which you want notification.
Step 7. In the “Options” field select the frequency of the alert. Typically, "Once Per Bar" or "Once Per Bar Close" will be sufficient.
Step 8. Set the expiration date and time.
Step 9. Select the action of the alert. Currently TradingView offers six different actions:
-- Notify on App
-- Show Popup
-- Send Email
-- Webhook URL
-- Play Sound
-- Send Email to SMS
Step 10. Create a message to to transmitted with the alert. The script provides a default message which can be overridden with any custom description. The price, time and other reserved chart elements can be included in the message
Step 11. Click the “Create” button to generate this single alert.
Step 12. Repeat steps 1 through 11 for every signal you wish to receive.
This script is open for beta testing. After successful beta test it will become a commercial application available by subscription only. I’ve invested quite a lot of time and effort into making this the best possible signal generator for all of the instruments I intend to trade. I certainly welcome any suggestions for improvements. Thank you all in advance.

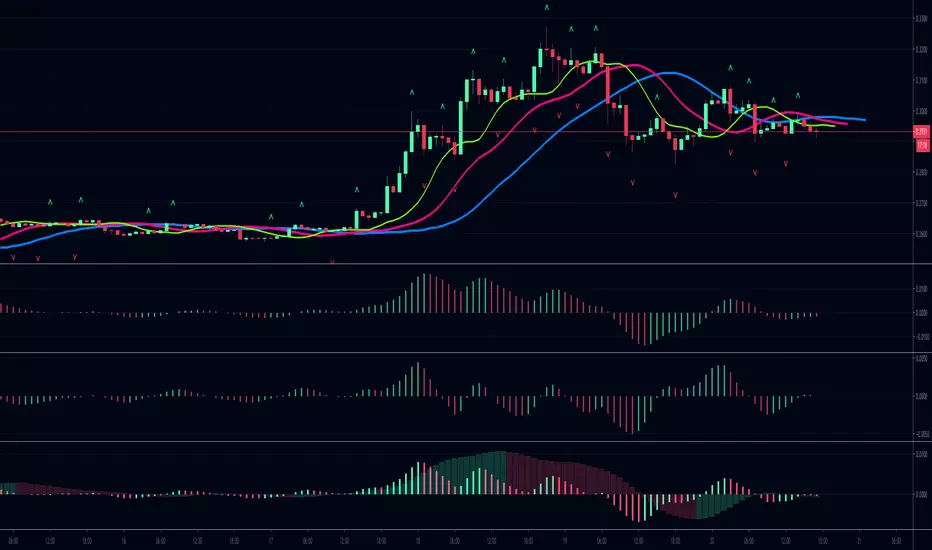
Experimental Entry Interface (Buy Arrows with TP & SL)This script provides high probability entry points and includes Take Profit and Stop Loss targets.
It attempts to predict when the market conditions are set to move up, and prints long positions.
In addition to Long Entry Arrows, it will print Take Profit / Stop Loss targets.
This indicator is highly adjustable. Hence the name 'Experimental' in the title. Experiment with it to find the results you want.
Designed for use on the 1H timeframe in Forex, but could possibly be useful elsewhere. Do your own testing.
This indicator can repaint. It is best used with alerts set for once per bar close, so that your alerts do not repaint and your trades are solid.
Not ever signal is a winner. Backtest thoroughly. Adjust accordingly.
Arrows
Four sets of colored arrows are included.
💵 💶 Green and Blue Entry Arrows are formed when the market is in an uptrend, and has a momentary pullback.
💴 💷 Yellow and Purple Entry Arrows are formed when the market is just starting to recover from being severely oversold.
Backtest Mode
Turn on Backtest Mode to easily see if an entry ended up as a winner or loser. A Take Profit and Stop Loss line will be drawn to show results.
Take Profit & Stop Loss Targets
You have two options for this.
Price will show you where your TP/SL exits should be placed. These values will show up under the arrow, based on your Risk/Reward ratio.
Pips are much more simple, and will only show you the market entry point and how many pips up/down to place your SL/TP. Warning: This is fixed at a 1:1 RRR .
Risk/Reward Adjustment
Each entry arrow color allows custom risk/reward ratio adjustment.
Dollar Amounts Displayed
Change your account value and leverage to see how much you would have won on each trade.
How to trade with it?
(Forex, 1H) Open the settings, and turn on all the arrow entries. Turn on Backtest mode to see how past trades would have played out. Turn on TakeProfit/StopLoss Targets to see where to set your targets, for each arrow. Set an alert to notify you once per candle close when there is an Entry. Trade happy!
Bill Williams Alligators are also included, if you want. Not necessary though. Some of the calculations depend on them for trend direction analysis.

Full Range Trading Study with Alerts and DCA
Introduction
This is the study version of my range trading strategy. It is designed to be a “drop in” replacement for its twin strategy. I have replicated the analysis logic and entry and exit procedures to produce a nearly identical result set to the strategy. Other than the properties tab, the inputs dialog is exactly the same. Backtest the strategy to determine the best inputs to trade. Then apply the same inputs to this study to forward test. Alerts are available for trade entry, take profit close and stop-loss exit. Please see the strategy version for a complete description of the trading behavior of this script.
In brief, this script is intended to benefit from a range bound market. The trading behavior is to buy on weakness and sell on strength. As such trade orders are placed in a counter direction to price pressure. What you will see on the chart is a short position on peaks and a long position on valleys. This is accomplished by calculating pivot points from the price stream. Rising pivots are shorts and falling pivots are longs. I refer to pivots as a vertex in the inputs dialog box. The cone based measurement adds a peak, sides and a base to the calculation elements. This allows the inputs to focus on adjusting the location of trades and not just trend lines. The pivot points can be plotted on the backtest. You can use the vertex input values to move the pivots where you want trades to be. This script can be traded in four different modes: Long, Short, BiDir, and Ping Pong. When trading in “Ping Pong” mode long and short positions are intermingled continuously as long as there exists a detectable vertex. I also have a trend following version of this script for those not interested in trading the range.
This script employs a DCA feature which enables users to experiment with loss recovery techniques in the backtest. Here in the study the summary report displays the “Debt Sequence” number which can be used to manually increase the order size on subsequent trades at the broker. The script keeps track of debt incurred from losing trades. When the debt is recovered the “Debt Sequence” resets to zero so orders can return to the base size. Be sure to set the limiter to prevent your account from depleting capital during runaway markets.
Consecutive loss limit can be set to report a breach of the threshold value. Every stop hit beyond this limit will be reported on a version 4 label above the bar where the stop is hit. Use the consecutive loss limit to manually halt live trading on the broker side.
Design
This script uses twelve indicators on a single time frame and is approximately 1800 lines of Pine 4 code. The original trading algorithms are a port from a much larger program on another trading platform. I’ve converted some of the statistical functions to use standard indicators available on TradingView. The setups make heavy use of the Hull Moving Average in conjunction with EMAs that form the Bill Williams Alligator as described in his book “New Trading Dimensions” Chapter 3. Lag between the Hull and the EMAs form the basis of the entry and exit points. The vertices are calculated using one of five featured indicators: Volume, Histogram, Fractal, Candle and Macro. The backtest is used to determine the best fit for your desired trading instrument. The incorporation of five distinct pivot point calculations broadens the scope of the markets where this tool can be beneficial.
Example configurations for various instruments along with a detailed PDF user manual is available.
Indicator Repainting
Please see the strategy script for a more detailed description of the repaint problem. The goal of my repaint prevention in the study script is simply to ensure that my signal trading bias remains consistent between the strategy, study and broker. This script employs the following conventions in effort to avoid indicator repainting:
1. This script uses only 1 time frame. The chart interval.
2. Every entry and exit condition is evaluated on closed bars only.
3. Entry and exit plots are not triggered off trend line crossovers.
4. No security functions are called to avoid a look-ahead possibility.
5. Every contributing factor specified in the TradingView wiki regarding this issue has been addressed. Except the use of the exponential moving average which is essential to my strategy.
6. I’ve run a 10 minute chart live for a week and compared it to the same chart periodically reloaded. The two charts were highly correlated with no instances of completely opposite real-time signals
This script does indeed bring up the TradingView warning dialog. The only reason for this is due to “peculiarities of the algorithm” regarding the EMA as stated in the wiki article.
The Bottom Line. Does this script repaint. Yes, it will repaint about as much as every other trading platform which combines backtest data with real time prices in a live trading scenario.
Usage
Please be aware that the purpose of the study script is to perform forward testing of the configuration established in the backtest process. Therefore, the usage here in the study begins with the backtest configuration parameters. The following steps provide instructions to get this study script connected to the TradingView alert notification system. For a detailed description of how to create a range trading system using this script please see the strategy version.
Step 1. Create a chart with the trading instrument and interval used in the backtest.
Step 2. Find this script in the “Invite Only” section of the Indicators Dialog and apply it to the current chart.
Step 3. Copy the values from the backtest input dialog to the study.
Step 4. Open the TradingView Alert window.
Step 5. In the “Condition” drop down field find and select the name of the script.
Step 6. A new drop down field will appear with the alerts available in the script. This script exposes the following six signals:
Long Entry Signal
Long Profit Signal
Long Stop-loss Signal
Short Entry Signal
Short Profit Signal
Short Stop-loss Signal
Select the signal for which you want notification.
Step 7. In the “Options” field select the frequency of the alert. Typically, "Once Per Bar" or "Once Per Bar Close" will be sufficient.
Step 8. Set the expiration date and time.
Step 9. Select the action of the alert. Currently TradingView offers six different actions:
Notify on App
Show Popup
Send Email
Webhook URL
Play Sound
Send Email to SMS
Step 10. Create a message to to transmitted with the alert. The script provides a default message which can be overridden with any custom description. The price, time and other reserved chart elements can be included in the message
Step 11. Click the “Create” button to generate this single alert.
Step 12. Repeat steps 1 through 11 for every signal you wish to receive.
This script is open for beta testing. After successful beta test it will become a commercial application available by subscription only. I’ve invested quite a lot of time and effort into making this the best possible signal generator for all of the instruments I intend to trade. I certainly welcome any suggestions for improvements. Thank you all in advance.

CJWrabbitsThis script is a companion to my rabbit strategies (Wildrabbit, Jackrabbit, Crankenrabbit).
The purpose of this study is to analyze and cross check the validity of my rabbit strategies. This script will work with any trading program that can use alerts.
Explaination of colors/arrows.
All arrows under the candlesticks, pointing up, are buy signals. All arrows above the candlesticks, pointing down, are sell signals.
The dark blue line is the EMA fast line, while dark purple is the EMA slow line.
Red is RSI
Blue is Stochastic
Green is Bollinger Bands
Purple/Magenta is Williams %R
Updated the study to add the number of overlapping indicators to the top and bottom of the chart.
1 = Wildrabbit,
2 = Jackrabbit,
3 = Crankenrabbit
Added verbal references for alerts for each of the desired rabbits.
Added a special sell alert to mirrors the rabbit's strategy behavior, CJW DEFAULT SELL

Double Gaussian Awesome Oscillator by KviateqThis is an experimental indicator based on Bill Williams' Awesome Oscillator, however this one is coded using Gaussian Smoothed MAs, and showing both short and long-term trend.
The bright line histogram shows short term trend, the columns show long term trend.
To be used the same way as Bill William's strategy for AO, with added confirmation of longer trend.
Gaussian Acceleration/Deceleration by KviateqBill Williams' AC (Acceleration/Deceleration), made using Gaussian-smoother Moving Averages and a 5-period EMA instead of the usual SMA.
Since Gaussian MA's are faster reacting than the typical SMAs values have been adjusted accordingly.
See also Gaussian Alligator and GaussianAO for a complete gaussian chaos trading system.
These scripts are made to honor Bill and his amazing work and my humble attempt at contributing to his work

Gaussian Awesome Oscillator by KviateqBill Williams' Awesome Oscillator, made using Gaussian-smoother Moving Averages.
Since Gaussian MA's are faster reacting than the typical SMAs values have been adjusted accordingly.
See also Gaussian Alligator and GaussianACDC for a complete gaussian chaos trading system.
These scripts are made to honor Bill and his amazing work and my humble attempt at contributing to his work

Gaussian Alligator by KviateqBill Williams' Alligator, made using Gaussian-smoother Moving Averages.
Since Gaussian MA's are faster reacting than the typical SMAs values have been adjusted accordingly.
See also GaussianAO and GaussianACDC for a complete gaussian chaos trading system.
These scripts are made to honor Bill and his amazing work and my humble attempt at contributing to his work

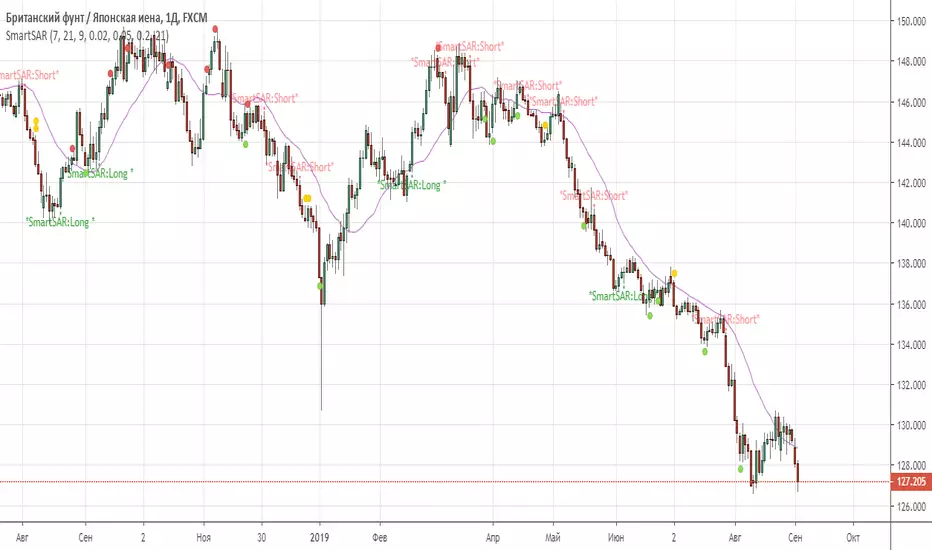
SmartSARSAR signal filtered by 3 indicators: MACD, AC, RVI.
This combination of trend indicator(SAR), 2 oscillators (MACD, RVI) , and 1 Bill Williams (AC) give us good Enter point.
Recommended timeframes: from 30 min and higher.
PhiBOIndicador de Bo Williams usando no PhiCube. Três canais de Donchian, pintados no gráfico somente quando podem indicar tendência. Apresentam níveis importantes de resistência e suporte em tendência.
