Levels Compound v.2Daily, weekly, monthly support and resistance levels. Also paints 2 different daily WMAs and the daily weekly monthly avg.
"weekly" için komut dosyalarını ara


Pivots (CPR) - Daily, Weekly & Monthly (only for Indraday) Hi all Dear users,
Here, I have shared my CPR script on Daily, Weekly & Monthly basis. which will only works on intraday time frames. Best time frames recommended are 3,5 &15.
This will be very useful for intraday trades. And also it has more customizing options.
The features are:-
================
- Have an option to use only Daily pivots.
- Have an option to check tomorrow pivot ( After day closing).
- You can customize each and every style and colors.
- It also contains Previous day High, Previous Week High & Previous Month High.
- You can Show or Hide daily weekly Monthly and highs too.
Please share this AMAZING INDICATORS others.

Daily Weekly Monthly Yearly OpensThis script plots the current daily, weekly and monthly opens (all enabled by default).
Here are some additional info about the drawing behavior:
Daily open is shown only on intraday timeframes
Weekly open is shown only on timeframes < weekly
Monthly open is shown only on timeframes < monthly
High/Low Weekly TimeframeI'm testing a simple but useful indicator that plots the high and low for the current week. The time-frame can be selected by the user.
It's useful when you're trading in a smaller time-frame (example: 1H or 4H) to know exactly the weekly low and high, and whether the price breaks above or below this price lines.
This indicator allows you:
- To select the desired time-frame to get the Low and High.
- To print an optional EMA for the same time-frame.
- To optionally change the bar-color when the close price crosses above the weekly high or crosses below the weekly low.
Hope this helps you to visually identify price movements.
If you like this script please give me a like and comment below.
Thanks,
Rodrigo
Iconik Trading Suite: Auto Support/Resistance - WeeklyAutogeneration of support and resistance lines. Posts a horizontal line of the open/close for the past 40 weekly candles.
DM for a PowerPoint describing this indicator and the rest of Iconik in detail.
Iconik Trading Suite Indicator List:
ITS-OSC: Oscillators (v2)
ITS-PAA: Price Action Alerts (v2)
ITS-ASR: Auto Support/Resistance
-> Daily (v2)
-> 3 Day (v2)
-> Weekly (v2)
ITS-4TFC: 4 Time Frame Confirmation (v1)
ITS-DIV: Divergence Seeker (v1)

CSA 5-Step Daily & Weekly ATR18-09-2019
The CSA 5-Step Daily & Weekly ATR will plot the Daily and Weekly ATR despite the time frame selected.
Daily = White
Weekly = Yellow

True Strength Indicator WeeklyThe True Strength Indicator Weekly is designed to help you identify trend and BIAS in the market based on the Weekly timeframe regardless of chart. Timeframe can be modified.
This indicator provides both long and short signals as well as color coding market direction bias.
There are 3 variables for this indicator are smoothed with some calculations EMAs with a signals.
Defaults are short length (21), long length (11), signal length (11) and represent the best middle of the road numbers I've found that work across all markets.
Upward triangle with L represents Long signal.
Downward triangle with S represents Short signal
Green background represents bull bias
Red background represents bear bias

Reset Every (Price)Someone requested a high/low price indicator that would reset the "remembered" prices daily. I started out doing just that, and then decided to make it much more configurable.
Choose the units (minutes, hours, days, weeks, months) and the number of those units, and this will reset the highest/lowest value remembered to the current values on your chosen time interval.
This should work with any time interval you desire, within reason...asking for resets every 4000 hours on a monthly chart will probably not work.
GE, monthly, every 7 months:
Ford, weekly, every 18 months:
Dow Jones Industrial Average, weekly, every 90 days:
LTCBTC, daily, every 10 days:
ETHUSD, 30 minutes, every 10 days:
BTCUSD, 1 minute, every 10 hours:
EURUSD, 1 minute, every 50 minutes:
Also, I am about to publish another version of this with just one source input that can be applied to any indicator...stay tuned!

Gleeson Trend Tracker (GTT) IndicatorComprehensive Trend Trading System Indicator made up of the four components to help you successfully trade market trends:
Entry Signals (Green & Red Arrows)
The entry arrows indicate entry conditions are present. Green for long entries and red for short entries. If you already in position in the direction of an entry signal, ignore it. Switch to position maintenance mode for that market once trading a market.
Current Trend Status Channels (Red/Green Overlay)
The channel overlay is intended to indicate whether the market has recently trended up/down. Green if moving higher, Red if moving Lower. Channels make it easier to visualise current & previous price trajectory.
On Close Stop Loss (OCSL) / Price Average (40 MA) Blue line
This acts both as the "line in the sand" in relation to trend direction but also importantly as your (OCSL) or sometimes also known as mental stop. If price closes beyond this line in the opposite direction to your position, exit the position. It's important to wait for price to close (this methodology works best on weekly charts so make entry & exit decisions when the market is closed). This method works best if you risk 1% per trade using the distance from entry price to the OCSL as your pre-defined risk, back-analysis confirms this.
Hard Stop Loss Red line
This line is your circuit breaker intended to protect your capital from sudden adverse moves. This line serves as the price for your fixed or hard stop loss point that should be entered with the order. The formula behind this line is risk * 2 (so 2% if you risk 1% between entry price and OCSL). HSL is your safety net, always use it.
Some other advice on how to trade this methodology:
Analysis Sunday, entries & exits Monday (so you can also have a life)
Do not pyramid with this system, it works best with individual entries spread across a range of markets including FX, Indices, Commodities and Interest Rates.
Risk only 1% per trade
This methodology works best over weekly/monthly charts. You want to capture moves that last weeks/months/years. I would not advise day trading this system.
If you have any feedback or need further help, email me at me@jackgleeson.co.uk
Good Luck!

Code Plots - High, Low, Open, Close—Daily, Weekly, & Monthly!!!Custom Code Plots High, Low, Open, Close
Plots Today And/Or Previous Day
Daily, Weekly, & Monthly TimeFrames
Default Settings:
Green = High
Silver = Open
Fuchsia = Close
Red = Low
Current D-W-M = Circles as Plots
Previous D-W-M = Cross as Plots
By Default The Current Days High, Low, Open, Close Plots. There are Check boxes On The Inputs Tab To Turn All Options On And Off.
***Tip - For Intra-Day Trades…I Find It Useful To Plot Previous Days High, Low, Open, Close For Support/Resistance, & Breakout Levels. Plotting the Current Weekly and Monthly Levels Is Also Very Useful.
***If You Trade Daily Charts The Previous Months Levels Are Very Useful as Support/Resistance, & Breakout Levels….
Code For High, Low, Open, Close
pastebin.com
Video On Importing Custom Indicators from PasteBin:
videos.tradingview.com

SMA 10/20/50 Weekly on all timeframeSMA 10/20/50 Weekly on all timeframe to keep a bias on all your chart

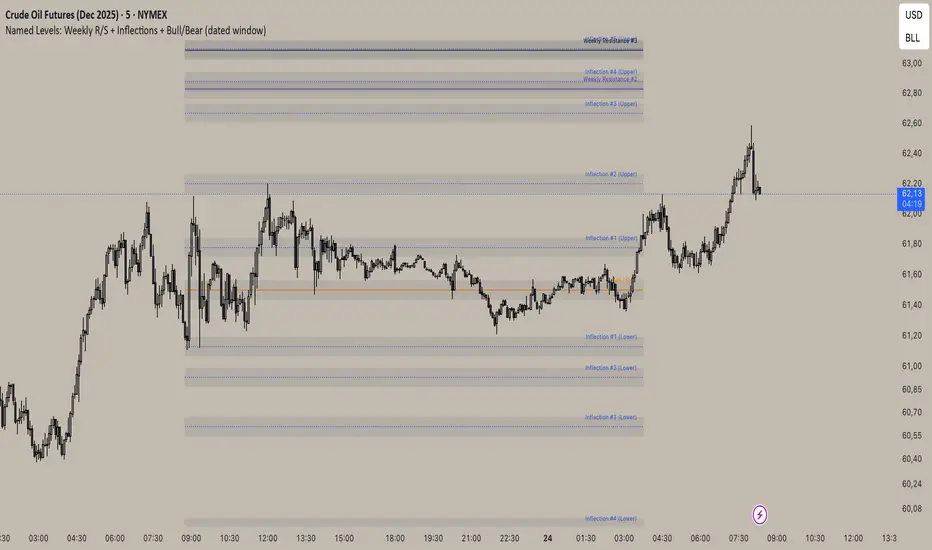
Inflection/ Bull Bear/ Weekly R&S VisualizerDisplay: Weekly Support/ Resistance, Inflection Levels, Bullbear
Adjust: Line Color, strength, style, opacity
Add: Zone around Inflection Level
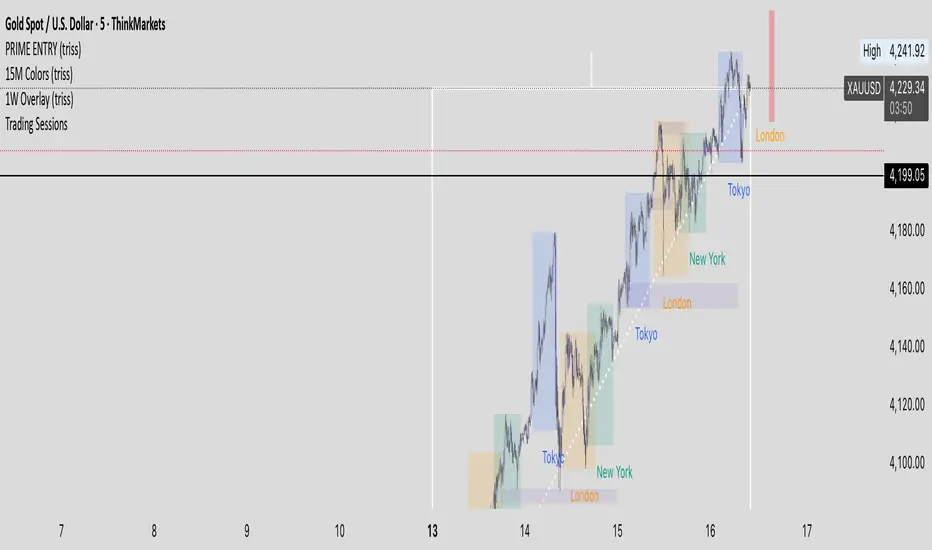
1W Overlay (triss)Overlay of the Weekly candle, simple one color with a line inside the candle to show direction.
Dynamic 21 SMA Zone S/R (Weekly and 2-Day)This custom indicator creates a dynamic support and resistance zone based on the 21-period Simple Moving Average (SMA) from the weekly timeframe and the 21-period SMA from the 2-day timeframe. The zone is visible and functional across all chart timeframes, adapting seamlessly to provide multi-timeframe insights.
Color Logic:
Green: When the current price is fully above the upper boundary of the zone, indicating potential bullish strength or a support level.
Gray: When the price is fully below the lower boundary, signaling potential bearish pressure or a resistance level.
Light Blue: When the price is within the zone (between the two SMAs), representing a neutral "no man's land" where the market is indecisive.
As the two SMAs converge or diverge, the zone naturally thins or widens, visually reflecting changes in market momentum—such as a thinning green zone during a potential reversal. Ideal for higher-timeframe swing trading to identify key levels, this indicator is also useful on lower timeframes for gauging the relative position of these SMAs, helping traders align short-term moves with broader trends.

Behdad v2 Daily Weekly Monthly HLC & SessionsThis indicator plots the highest and lowest as well as the closing price of the market for daily, weekly and monthly periods. It is also a great help for trading by identifying the range of sessions and fractals.
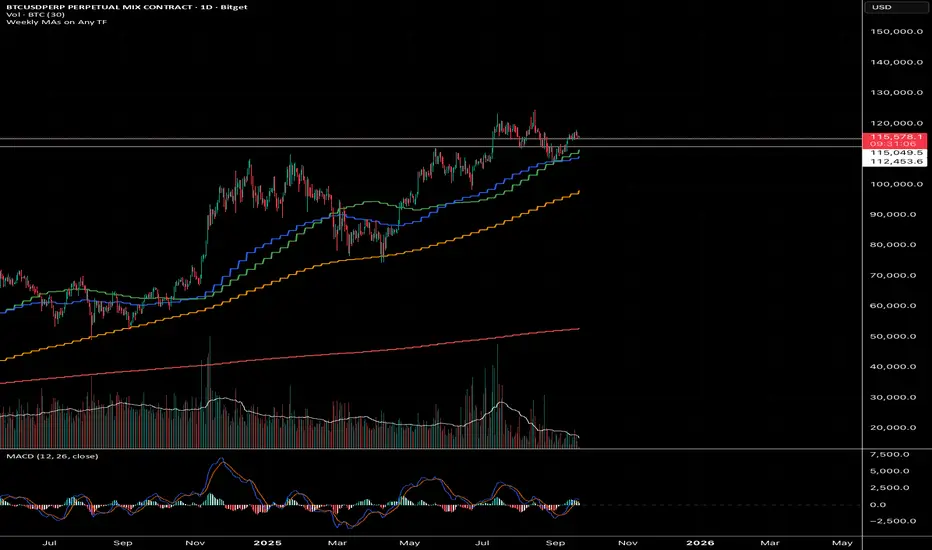
GQT - Weekly MAs on Any TFPlot the weekly 200SMA, 50SMA, 20SMA, and 21EMA on lower timeframes like 5m, 1h, 4h, etc.
Monthly & Weekly Vertical Lines Past and FutureMonthly & Weekly Vertical Lines Past and Future
Daily included

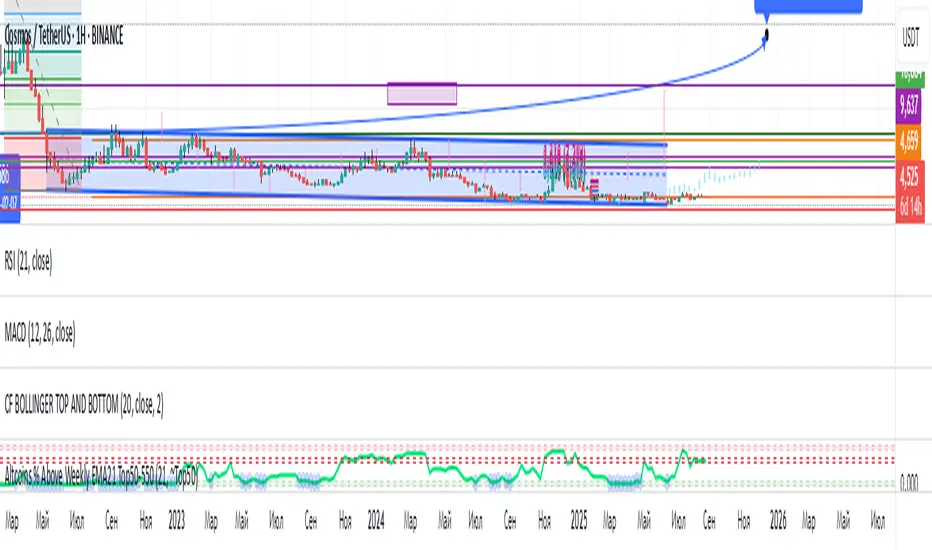
Altcoins % Above Weekly EMA21 Top50-550The indicator shows the percentage of altcoins trading above the weekly EMA21 within a selected group (Top50, Top150, Top550, or Personal).
It helps assess overall altcoin market strength, identify overbought/oversold zones, and spot potential entry or exit points.
LevelsThis Indicator is meant to plot some of the most common levels that traders use.
The display of these levels is highly customizable, as you can choose the line type , color , thickness and whether it shows you no label, price only, reduced label or full label next to the line. All labels (except for "no Label") will show the price at this level.
Also You have the option to mark the start on each timeframe with either a individually colored background or a vertical line where you can choose the line style and color.
Full List of available Levels and Optional inputs to these levels:
Previous HTF Candle Levels:
• Previous HTF Candle Open
• Previous HTF Candle High
• Previous HTF Candle Low
• Previous HTF Candle Close
Optional:
• Choose any higher timeframe
• Mark start of new HTF candle
Session Levels:
• Session Open
• Session High
• Session Low
• Session Close
Optional:
• Choose any time as start and end of your session
• Mark start of session
• Mark full session
Daily Levels:
• Current Day Open
• Current Day High
• Current Day Low
• Previous Day Open
• Previous Day High
• Previous Day Low
• Previous Day Close
Optional:
• Choose start of day (standard, NY Midnight, custom start time)
• Mark start of day
Weekly Levels:
• Current Week Open
• Current Week High
• Current Week Low
• Previous Week Open
• Previous Week High
• Previous Week Low
• Previous Week Close
Optional:
• Mark start of Week
Monthly Levels:
• Current Month Open
• Current Month High
• Current MonthLow
• Previous Month Open
• Previous Month High
• Previous Month Low
• Previous Month Close
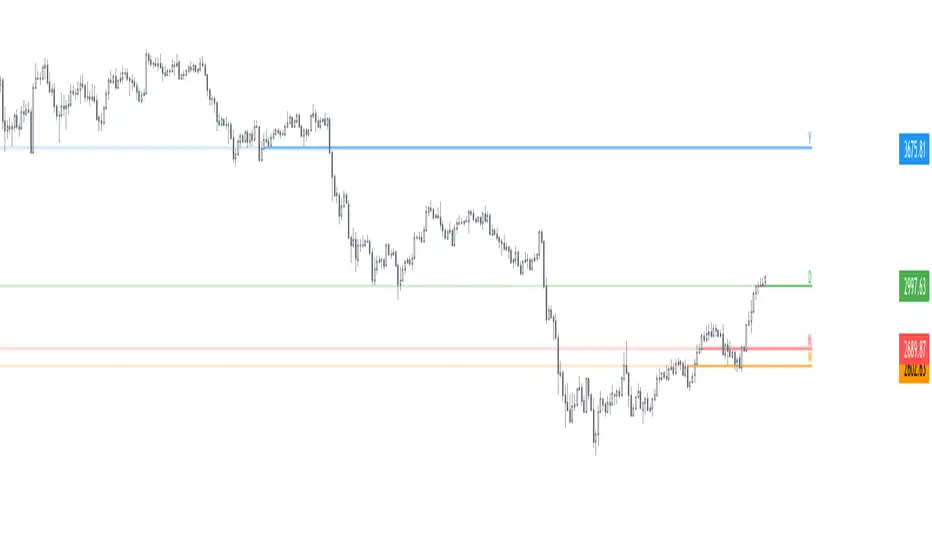
Optional:
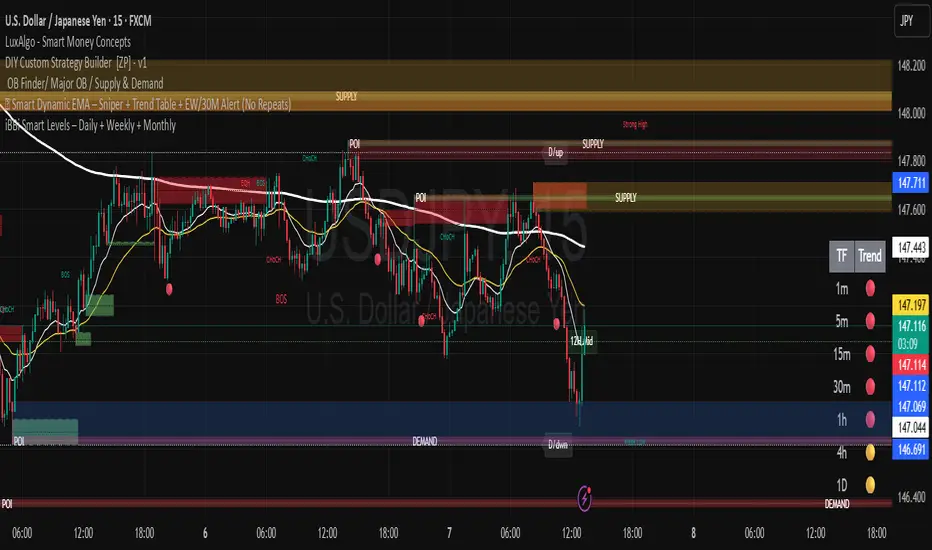
• Mark start of Month


iBBi Smart Levels – Daily + Weekly + MonthlyThis is a level indicator. In trading levels make lots of difference - this indicator gives us, daily, weekly and monthly levels. Then, it gives last 12-hours high and low level. This means at any given time you will have these EIGHT LEVELS available to you.