Wolfe Waves [BigBeluga]🔵 OVERVIEW
The Wolfe Waves pattern was first introduced by Bill Wolfe , a trader and analyst in the 1980s–1990s who specialized in market geometry and natural rhythm cycles. Wolfe observed that price often forms symmetrical wave structures that anticipate equilibrium points where supply and demand meet. These formations, called Wolfe Waves , gained popularity as a reliable pattern for forecasting both short- and long-term reversals.
The Wolfe Waves indicator automatically detects these patterns in real time. It tracks sequences of five pivots (points 1 through 5) and connects them with wave lines. Users can select either Bullish or Bearish Wolfe Waves depending on their trading bias. When the pattern fails, the lines automatically turn red to highlight invalidation.
🔵 CONCEPTS
Five-Point Structure – Wolfe Waves are defined by five pivots (1–5), which together form the basis of the wave pattern.
Bullish Pattern – Occurs when price compresses downward into point 5, signaling a potential upside reversal.
Bearish Pattern – Occurs when price extends upward into point 5, forecasting a downside reversal.
Validation & Failure – The pattern is considered valid once all five pivots form; if price fails to respect the expected breakout, the indicator marks the structure as broken with red lines.
🔵 FEATURES
Automatic detection of Bullish and Bearish Wolfe Waves.
Labels each pivot (1–5) on the chart for clarity.
Draws connecting lines between pivots to visualize the wave structure.
Projects target/dashed lines (EPA/ETA) based on Wolfe Wave geometry.
Lines automatically turn red when the pattern is broken, giving immediate feedback.
Customizable color scheme for bullish (lime) and bearish (orange) waves.
Adjustable sensitivity for pivot detection.
🔵 HOW TO USE
Choose between Bullish or Bearish mode depending on your analysis.
Watch for the formation of all five pivots; the indicator labels them clearly.
Look for potential entries near point 5, with the expectation that price will travel toward the projected EPA line.
Use invalidation (lines turning red) as a risk management warning to exit failed setups.
Combine with momentum, volume, or higher-timeframe analysis to increase reliability.
🔵 CONCLUSION
The Wolfe Waves brings the classic Wolfe Wave theory into an automated TradingView tool. Inspired by Bill Wolfe’s original concept of natural market cycles, this indicator detects, labels, and validates Wolfe Waves in real time. With automatic invalidation marking and customizable settings, it offers traders a structured way to harness one of the most well-known geometric reversal patterns.
"wave" için komut dosyalarını ara

Apex Edge – Wolfe Wave HunterApex Edge – Wolfe Wave Hunter
The modern Wolfe Wave, rebuilt for the algo era
This isn’t just another Wolfe Wave indicator. Classic Wolfe detection is rigid, outdated, and rarely tradable. Apex Edge – Wolfe Wave Hunter re-engineers the pattern into a modern, SMC-driven model that adapts to today’s liquidity-dominated markets. It’s not about drawing pretty shapes – it’s about extracting precision entries with asymmetric risk-to-reward potential.
🔎 What it does
Automatic Wolfe Wave Detection
Identifies bullish and bearish Wolfe Wave structures using pivot-based logic, symmetry filters, and slope tolerances.
Channel Glow Zones
Highlights the Wolfe channel and projects it forward into the future (bars are user-defined). This allows you to see the full potential of the trade before price even begins its move.
Stop Loss (SL) & Entry Arrow
At the completion of Wave 5, the algo prints a Stop Loss line and a tiny entry arrow (green for bullish, red for bearish). but the colours can be changed in user settings. This is the “execution point” — where the Wolfe setup becomes tradable.
Target Projection Lines
TP1 (EPA): Derived from the traditional 1–4 line projection.
TP2 (1.272 Fib): Optional secondary profit target.
TP3 (1.618 Fib): Optional extended target for large runners.
All TP lines extend into the future, so you can track them as price evolves.
Volume Confirmation (optional)
A relative volume filter ensures Wave 5 is formed with meaningful market participation before a setup is confirmed.
Alerts (ready out of the box)
Custom alerts can be fired whenever a bullish or bearish Wolfe Wave is confirmed. No need to babysit the charts — let the script notify you.
⚙️ Customisation & User Control
Every trader’s market and style is different. That’s why Wolfe Wave Hunter is fully customisable:
Arrow Colours & Size
Works on both light and dark charts. Choose your own bullish/bearish entry arrow colours for maximum visibility.
Tolerance Levels
Adjust symmetry and slope tolerance to refine how strict the channel rules are.
Tighter settings = fewer but cleaner zones.
Looser settings = more frequent setups, but with slightly lower structural quality.
Channel Glow Projection
Define how many bars forward the channel is drawn. This controls how far into the future your Wolfe zones are extended.
Stop Loss Line Length
Keep the SL visible without it extending infinitely across your chart.
Take Profit Line Colors
Each TP projection can be styled to your preference, allowing you to clearly separate TP1, TP2, and TP3.
This isn’t a one-size-fits-all tool. You can shape Wolfe detection logic to match the pairs, timeframes, and market conditions you trade most.
🚀 Why it’s different
Classic Wolfe waves are rare — this script adapts the model into something practical and tradeable in modern markets.
Liquidity-aligned — many setups align with structural sweeps of Wave 3 liquidity before driving into profit.
Entry built-in — most Wolfe scripts only draw the structure. Wolfe Wave Hunter gives you a precise entry point, SL, and projected TPs.
Backtest-friendly — you’ll quickly discover which assets respect Wolfe waves and which don’t, creating your own high-probability Wolfe watchlist.
⚠️ Limitations & Disclaimer
Not all markets respect Wolfe Waves. Some FX pairs, metals, and indices respect the structure beautifully; others do not. Backtest and create your own shortlist.
No guaranteed sweeps. Many entries occur after a liquidity sweep of Wave 3, but not all. The algo is designed to detect Wolfe completion, not enforce textbook liquidity rules.
Probabilistic, not predictive. Wolfe setups don’t win every time. Always use risk management.
High-RR focus. This is not a high-frequency tool. It’s designed for precision, asymmetric setups where risk is small and reward potential is large.
✅ The Bottom Line
Apex Edge – Wolfe Wave Hunter is a modern reimagination of the Wolfe Wave. It blends structural geometry, liquidity dynamics, and algo-driven execution into a single tool that:
Detects the pattern automatically
Provides SL, entry, and TP levels
Offers alerts for hands-off trading
Allows deep customisation for different markets
When it hits, it delivers outstanding risk-to-reward. Backtest, refine your tolerances, and build your watchlist of assets where Wolfe structures consistently pay.
This isn’t just Wolfe detection — it’s Wolfe trading, rebuilt for the modern trader.
Developer Notes - As always with the Apex Edge Brand, user feedback and recommendations will always be respected. Simply drop us a message with your comments and we will endeavour to address your needs in future version updates.

Smart Elliott Wave [The_lurker]🔷 Smart Elliott Wave – موجات إليوت الذكية
A professional indicator for automatically detecting and analyzing Elliott Wave patterns on the chart. Built on classical Elliott Wave theory, it enhances accuracy with dynamic Fibonacci validation and geometric logic—solving the most common issues traders face when applying Elliott Wave manually: complexity, subjectivity, and misinterpretation of corrections.
🎯 Key Features
Smart Elliott Wave offers a layered intelligent system that:
- Automatically detects impulsive and corrective wave structures
- Validates wave formations using Fibonacci rules
- Highlights potential reversal zones (PRZ)
- Sends instant alerts for newly detected patterns
- Supports both bullish and bearish trends
- Includes fully customizable user settings
🧠 Core Concept
The indicator analyzes price movement over time using pivot points (discovered via `ta.pivothigh` and `ta.pivotlow`) to detect wave structures that conform to Elliott Wave sequencing:
- Impulse Wave: 0-1-2-3-4-5
- Simple Correction: ABC
- Complex Correction: WXY
Each structure is validated through a strict set of logical rules combined with Fibonacci ratio checks to ensure pattern integrity and reduce false signals.
🧩 Wave Structure Components
1️⃣ Impulse Waves
- Wave 3 is not the shortest
- Wave 4 does not overlap Wave 1
- Waves 1, 3, and 5 are impulsive; Waves 2 and 4 are corrective
- Fibonacci validation can be applied to Waves 2 and 4 if enabled
2️⃣ Simple Corrections (ABC)
- Wave B partially retraces Wave A
- Wave C completes the structure without invalid overlap
- Fibonacci ratios validate the symmetry of A, B, and C (if enabled)
3️⃣ Complex Corrections (WXY)
- Only used if ABC structure is insufficient
- Requires 6 sequential pivot points: W, X, Y
- W and Y are corrective; X is a linking wave
- Follows both structural and ratio-based validations
📏 Dynamic Fibonacci Validation
When Enable Fibonacci Rules is active:
- Validates against common ratios:
`38.2%`, `50%`, `61.8%`, `78.6%`, `127.2%`, `161.8%`
- Adjustable **Fibonacci Tolerance** allows for controlled deviation
- Patterns are ignored if ratios fall outside the accepted range
🔮 Potential Reversal Zones (PRZ)
- Calculated from the most recent completed impulse wave
- Uses Fibonacci extensions to project PRZ ahead of price
- Customizable visibility and color for each ratio
- Used as dynamic take-profit or stop-loss zones
🖍️ Dual Trend Detection & Wave Coloring
- Supports both bullish and bearish patterns
- Automatic wave coloring for quick visual recognition:
- 🟦 Blue: Bullish waves
- 🟥 Red: Bearish waves
- Optional fill color for correction zones
🔔 Smart Alert System
Instant alerts are triggered when a valid wave pattern is confirmed:
- New impulse wave detected
- ABC correction appears
- Complex WXY correction formed
> Alerts are triggered only after the bar closes to prevent repainting.
⚙️ Indicator Settings
📌 Wave Detection Settings
- Pivot Left Strength: Bars to the left used for pivot detection
- Pivot Right Strength: Bars to the right for confirmation (0 = real-time)
- Enable Fibonacci Rules: Toggle Fibonacci ratio validation
- Fibonacci Tolerance: Allowed deviation in percentage
🎨 Display Settings
- Show Previous Patterns: Toggle between all patterns or only the latest
- Fill correction zones with color
- Customize wave and PRZ color schemes
📉 PRZ Settings
- Show/hide specific Fibonacci ratios
- Customize each PRZ color
- Set maximum bar extension for PRZ display
🔕 Alert Settings
- Enable or disable alerts for each type of pattern
📚 Practical Use Cases
- Daily or intraday price structure analysis
- Combine with RSI, MACD, or momentum indicators
- Filter weak signals using Fibonacci-based pattern validation
- Use PRZ zones as dynamic entry/exit targets
- Learn and reinforce Elliott Wave theory through real-time examples
📝 Important Notes
- Setting `Pivot Right = 0` allows for real-time pattern previews (may repaint)
- Disabling Fibonacci validation increases pattern count but reduces accuracy
- TradingView limits to 500 visual objects (labels, boxes, lines); older patterns may be removed
- PRZ extends up to 100 bars or 0.618 of the previous impulse duration by default
⚠️ Disclaimer:
This indicator is for educational and analytical purposes only. It does not constitute financial, investment, or trading advice. Use it in conjunction with your own strategy and risk management. Neither TradingView nor the developer is liable for any financial decisions or losses.
🔷 Smart Elliott Wave – موجات إليوت الذكية
مؤشر احترافي لرصد وتحليل أنماط موجات إليوت تلقائيًا على الرسم البياني، يعتمد على المبادئ الكلاسيكية للنظرية مع تعزيزها بالتحقق الرياضي والهندسي، ويهدف إلى تجاوز العقبات التي يواجهها معظم المتداولين عند تطبيق موجات إليوت يدويًا، مثل صعوبة التحديد، التقديرات الذاتية، وتشويش التصحيحات.
🎯 ما الذي يميز هذا المؤشر؟
يُقدّم Smart Elliott Wave نظامًا تراكبيًا ذكيًا يقوم بـ:
رصد تلقائي للموجات (الدافعة والتصحيحية)
التحقق من صحة النموذج باستخدام قواعد فيبوناتشي
عرض مناطق الانعكاس المحتملة (PRZ)
توليد تنبيهات لحظية عند تشكّل أنماط جديدة
دعم الاتجاهين (الصاعد والهابط)
واجهة إعدادات مرنة قابلة للتخصيص الكامل
🧠 الفكرة الأساسية
يعتمد المؤشر على تحليل حركة السعر عبر تسلسل زمني من النقاط المحورية (Pivots)، والتي تُكتشف باستخدام دوال مدمجة مثل ta.pivothigh وta.pivotlow. ثم يُبني فوق هذه النقاط نماذج هندسية متوافقة مع تسلسل موجات إليوت:
الموجة الدافعة (Impulse): تسلسل 0-1-2-3-4-5
التصحيح البسيط (ABC)
التصحيح المعقد (WXY)
ويتم التحقق من كل نموذج اعتمادًا على قواعد إليوت + نسب فيبوناتشي، ما يضمن موضوعية التصنيف، ودقة التحديد.
🧩 مكوّنات التحليل:
1️⃣ الموجات الدافعة (Impulse Waves):
يُشترط أن تكون الموجة الثالثة غير الأقصر.
لا تتداخل الموجة الرابعة مع نطاق الموجة الأولى.
تأكيد أن الموجات 1 و3 و5 دافعة، و2 و4 تصحيحية.
يتم التحقق من نسب تصحيح الموجتين 2 و4 حسب قواعد فيبوناتشي عند تفعيلها.
2️⃣ التصحيح البسيط (ABC):
B تصحيح جزئي للموجة A.
C تُكمل الهيكل بدون تداخل مع A.
يتم التحقق من أطوال الموجات وفق نسب فيبوناتشي لضمان التناسق.
3️⃣ التصحيح المعقد (WXY):
لا يتم تفعيله إلا عند فشل ABC في تفسير النمط.
يتطلب 6 نقاط محورية متسلسلة: W, X, Y.
W وY تصحيحيتان، وX رابط مركزي.
يخضع أيضًا لقواعد النسب والتماثل البنائي.
📏 التحقق باستخدام نسب فيبوناتشي:
عند تفعيل خاصية Enable Fibonacci Rules، يتم التحقق الصارم من نسب تصحيح الموجات:
النسب المعتمدة:
38.2%, 50%, 61.8%, 78.6%, 127.2%, 161.8%
إذا لم تكن الموجة ضمن نطاق النسبة + نسبة التسامح (Tolerance)، يتم تجاهل النموذج.
يُستخدم هذا التحقق أيضًا لرسم مناطق الانعكاس المحتملة (PRZ).
🔮 مناطق الانعكاس المحتملة (PRZ)
تُحسب PRZ باستخدام نسب فيبوناتشي انطلاقًا من نهاية آخر موجة دافعة.
تُعرض بشكل مستطيلات شفافة أو ملونة.
يمكن تخصيص كل نسبة لونًا وشكلًا خاصًا.
تُستخدم PRZ كأداة توقع للموجة التالية أو لتحديد أهداف وقف الخسارة وجني الأرباح ديناميكيًا.
🖍️ دعم الاتجاهين وتلوين الموجات:
يدعم المؤشر النماذج الصاعدة والهابطة بشكل تلقائي.
يتم استخدام تلوين بصري لتسهيل التمييز:
الأزرق: للموجات الصاعدة
الأحمر: للموجات الهابطة
لون تعبئة مخصص لمناطق التصحيح
🔔 نظام التنبيهات الذكية
يحتوي المؤشر على تنبيهات تلقائية يتم تفعيلها عند اكتمال أي نمط جديد.
يدعم التنبيهات التالية:
موجة دافعة جديدة
تصحيح بسيط ABC
تصحيح معقد WXY
التنبيهات تُطلق بعد إغلاق الشمعة التي تحقق فيها النموذج (غير فوري Repainting-safe)
⚙️ إعدادات المؤشر
📌 إعدادات تحليل الموجة:
Pivot Left Strength: عدد الأعمدة (bars) إلى اليسار لتحديد الانعكاس
Pivot Right Strength: الأعمدة إلى اليمين لتأكيد الانعكاس (0 يعني تنبؤ لحظي)
Enable Fibonacci Rules: تفعيل/تعطيل التحقق من فيبوناتشي
Fibonacci Tolerance: نسبة التفاوت المقبولة بالنسب المئوية
🎨 إعدادات العرض:
Show Previous Patterns: إظهار كل الأنماط المكتشفة أو آخر نمط فقط
PRZ Settings:
إظهار أو إخفاء نسب معينة
تخصيص الألوان
تحديد امتداد مربع PRZ زمنيًا (Max Bars)
🔕 إعدادات التنبيهات:
تفعيل/تعطيل تنبيه عند كل نمط جديد
📚 حالات الاستخدام العملية:
تحليل الحركة السعرية في بداية كل جلسة
دمج المؤشر مع أدوات مثل RSI أو MACD للحصول على إشارات مركّبة
مراقبة الموجات التوسعية والتصحيحية على فواصل 4H / Daily
استخدام PRZ كأداة لتحديد الأهداف أو وقف الخسارة
التعلم العملي لنظرية إليوت من خلال أمثلة حية
📝 ملاحظات مهمة:
تعيين Pivot Right = 0 يعني نقاط فورية (قد يعاد رسمها لاحقًا)
تعطيل فيبوناتشي يزيد عدد النماذج، لكن قد يُضعف دقتها
TradingView يحد عدد الكائنات المرسومة (Labels, Boxes, Lines) إلى 500، مما قد يؤدي إلى حذف الأنماط الأقدم تلقائيًا
PRZ يمتد افتراضيًا حتى 100 شمعة، أو 0.618 من مدة الموجة الدافعة السابقة
⚠️ إخلاء مسؤولية:
هذا المؤشر لأغراض تعليمية وتحليلية فقط. لا يُمثل نصيحة مالية أو استثمارية أو تداولية. استخدمه بالتزامن مع استراتيجيتك الخاصة وإدارة المخاطر. لا يتحمل TradingView ولا المطور مسؤولية أي قرارات مالية أو خسائر.

GKD-C Wavelet Oscillator [Loxx]The Giga Kaleidoscope GKD-C Wavelet Oscillator is a Confirmation module included in AlgxTrading's "Giga Kaleidoscope Modularized Trading System."
█ GKD-C Wavelet Oscillator, a brief overview
The Wavelet Oscillator is an advanced technical analysis tool that integrates wavelet transformations with the Kalman filter to provide a nuanced understanding of market trends and momentum. At the heart of this oscillator is the Haar wavelet transform, a mathematical technique that breaks down price data into different frequency components. The Haar transform works by analyzing the price series in pairs, calculating the average and difference between adjacent data points, effectively separating the underlying signal (trend) from noise or minor fluctuations. This decomposition allows the oscillator to isolate significant price movements and reconstruct them with greater clarity through the inverse Haar transform. The Kalman filter is then applied to further smooth the signal, refining the data and reducing the impact of short-term volatility.
This process enhances the oscillator's ability to detect subtle shifts in market dynamics that might be missed by conventional indicators. The GKD-C Wavelet Oscillator utilizes these refined signals to generate two types of trading signals: Zero-line crosses, where the oscillator moves above or below a central reference point, indicating potential bullish or bearish momentum, and Signal crosses, where the current oscillator value crosses its previous value, signaling possible trend reversals. These features make the Wavelet Oscillator particularly effective in identifying key turning points in the market, providing traders with a powerful tool for anticipating and responding to changes in price momentum within the GKD trading system. (Read the sections below to learn how traders can test these different signal types using AlgxTrading's GKD trading system.)
GKD-C Wavelet Oscillator in Zero-line crosses mode
GKD-C Wavelet Oscillator in Signal crosses mode
To explain the features included in the GKD-C Wavelet Oscillator, let's first dive into the details of the Giga Kaleidoscope (GKD) Modularized Trading System.
█ Giga Kaleidoscope (GKD) Modularized Trading System
The GKD Trading System is a comprehensive, algorithmic trading framework from AlgxTrading, designed to optimize trading strategies across various market conditions. It employs a modular approach, incorporating elements such as volatility assessment, trend identification through a baseline, multiple confirmation strategies for signal accuracy, and volume analysis. Key components also include specialized strategies for entry and exit, enabling precise trade execution. The system allows for extensive backtesting, providing traders with the ability to evaluate the effectiveness of their strategies using historical data. Aimed at reducing setup time, the GKD system empowers traders to focus more on strategy refinement and execution, leveraging a wide array of technical indicators for informed decision-making.
🔶 Core components of a GKD Algorithmic Trading System
Each GKD indicator is denoted with a module identifier of either: GKD-BT, GKD-B, GKD-C, GKD-V, GKD-M, or GKD-E. This allows traders to understand to which module each indicator belongs and where each indicator fits into the GKD system. The GKD algorithm is built on the principles of trend, momentum, and volatility. There are eight core components in the GKD trading algorithm:
🔹 Volatility - In the GKD trading system, volatility is used as a part of the system to help determine the appropriate stop loss and take profit levels for a trade. There are 17+ different types of volatility available in the GKD system including Average True Range (ATR), True Range Double (TRD), Close-to-Close, Garman-Klass, and more.
🔹 Baseline (GKD-B) - The baseline is essentially a moving average and is used to determine the overall direction of the market. The baseline in the GKD trading system is used to filter out trades that are not in line with the long-term trend of the market. The baseline is plotted on the chart along with other GKD indicators.
Trades are only taken when the price is in the same direction as the baseline. For example, if the baseline is sloping upwards or price is above the baseline, then only long trades are taken, and if the baseline is sloping downwards or price is below the baseline, then only short trades are taken. This approach helps to ensure that trades are in line with the overall trend of the market, and reduces the risk of entering trades that are likely to fail.
🔹 Confirmation 1, Confirmation 2, Continuation (GKD-C) - The GKD trading system incorporates technical confirmation indicators for the generation of its primary long and short signals, essential for its operation.
The GKD trading system distinguishes three specific categories. The first category, Confirmation 1, encompasses technical indicators designed to identify trends and generate explicit trading signals. The second category, Confirmation 2, a technical indicator used to identify trends; this type of indicator is primarily used to filter the Confirmation 1 indicator signals; however, this type of confirmation indicator also generates signals*. Lastly, the Continuation category includes technical indicators used in conjunction with Confirmation 1 and Confirmation 2 to generate a special type of trading signal called a "Continuation"
In a full GKD trading system all three categories generate signals. (see the section “GKD Trading System Signals” below)
🔹 Volatility/Volume (GKD-V) - Volatility/Volume indicators are used to measure the amount of buying and selling activity in a market. They are based on the trading Volatility/Volume of the market, and can provide information about the strength of the trend. In the GKD trading system, Volatility/Volume indicators are used to confirm trading signals generated by the various other GKD indicators. In the GKD trading system, Volatility is a proxy for Volume and vice versa.
Volatility/Volume indicators reduce the risk of false signals and improve the overall profitability of trades. These indicators can provide additional information about the market that is not captured by GKD-C confirmation and GKD-B baseline indicators.
🔹 Exit (GKD-E) - The exit indicator in the GKD system is an indicator that is deemed effective at identifying optimal exit points. The purpose of the exit indicator is to identify when a trend is likely to reverse or when the market conditions have changed, signaling the need to exit a trade. By using an exit indicator, traders can manage their risk and prevent significant losses.
🔹 Backtest (GKD-BT) - The GKD-BT backtest indicators link all other GKD-C, GKD-B, GKD-E, GKD-V, and GKD-M components together to create a GKD trading system. GKD-BT backtests generate signals (see the section “GKD Trading System Signals” below) from the confluence of various GKD indicators that are imported into the GKD-BT backtest. Backtest types include: GKD-BT solo and full GKD backtest strategies used for a single ticker; GKD-BT optimizers used to optimize a single indicator or the full GKD trading system; GKD-BT Multi-ticker used to backtest a single indicator or the full GKD trading system across up to ten tickers; GKD-BT exotic backtests like CC, Baseline, and Giga Stacks used to test confluence between GKD components to then be injected into a core GKD-BT Multi-ticker backtest or single ticker strategy.
🔹 Metamorphosis (GKD-M)** - The concept of a metamorphosis indicator involves the integration of two or more GKD indicators to generate a compound signal. This is achieved by evaluating the accuracy of each indicator and selecting the signal from the indicator with the highest accuracy. As an illustration, let's consider a scenario where we calculate the accuracy of 10 indicators and choose the signal from the indicator that demonstrates the highest accuracy.
The resulting output from the metamorphosis indicator can then be utilized in a GKD-BT backtest by occupying a slot that aligns with the purpose of the metamorphosis indicator. The slot can be a GKD-B, GKD-C, GKD-E, or GKD-V slot, depending on the specific requirements and objectives of the indicator. This allows for seamless integration and utilization of the compound signal within the GKD-BT framework.
*(see the section “GKD Trading System Signals” below)
**(not a required component of the GKD algorithm)
🔶 What does the application of the GKD trading system look like?
Example trading system:
Volatility: Average True Range (ATR) (selectable in all backtests and other related GKD indicators)
GKD-B Baseline: GKD-B Multi-Ticker Baseline using Hull Moving Average
GKD-C Confirmation 1: GKD-C Advance Trend Pressure
GKD-C Confirmation 2: GKD-C Dorsey Inertia
GKD-C Continuation: GKD-C Stochastic of RSX
GKD-V Volatility/Volume: GKD-V Damiani Volatmeter
GKD-E Exit: GKD-E MFI
GKD-BT Backtest: GKD-BT Multi-Ticker Full GKD Backtest
GKD-M Metamorphosis: GKD-M Baseline Optimizer
**all indicators mentioned above are included in the same AlgxTrading package**
Each module is passed to a GKD-BT backtest module. In the backtest module, all components are combined to formulate trading signals and statistical output. This chaining of indicators requires that each module conform to AlgxTrading's GKD protocol, therefore allowing for the testing of every possible combination of technical indicators that make up the various indictor types in the GKD algorithm.
🔶 GKD Trading System Signals
🔹 Standard Entry requires a sequence of conditions including a confirmation signal from GKD-C, baseline agreement, price criteria related to the Goldie Locks Zone, and concurrence from a second confirmation and volatility/volume indicators.
🔹 1-Candle Standard Entry introduces a two-phase process where initial conditions must be met, followed by a retraction in price and additional confirmations in the subsequent candle, including baseline, confirmations 1 and 2, and volatility/volume criteria.
🔹 Baseline Entry focuses on signals generated by the GKD-B Baseline, requiring agreement from confirmation signals, specific price conditions within the Goldie Locks Zone, and a timing condition related to the confirmation 1 signal.
🔹 1-Candle Baseline Entry mirrors the baseline entry but adds a requirement for a price retraction and subsequent confirmations in the following candle, maintaining the focus on the baseline's guidance.
🔹 Volatility/Volume Entry is predicated on signals from volatility/volume indicators, requiring support from confirmations, price criteria within the Goldie Locks Zone, baseline agreement, and a timing condition for the confirmation 1 signal.
🔹 1-Candle Volatility/Volume Entry adapts the volatility/volume entry to include a phase of initial signal and agreement, followed by a retracement phase that seeks further agreement from the system's components in the subsequent candle.
🔹 Confirmation 2 Entry is based on the second confirmation signal, requiring the first confirmation's agreement, specific price criteria, agreement from volatility/volume indicators, and baseline, with a timing condition for the confirmation 1 signal.
🔹 1-Candle Confirmation 2 Entry adds a retracement requirement to the confirmation 2 entry, necessitating additional agreements from the system's components in the candle following the signal.
🔹 PullBack Entry initiates with a baseline signal and agreement from the first confirmation, with a price condition related to volatility. It then looks for price to return within the Goldie Locks Zone and seeks further agreement from the system's components in the subsequent candle.
🔹 Continuation Entry allows for the continuation of an active position, based on a previously triggered entry strategy. It requires that the baseline hasn't crossed since the initial trigger, alongside ongoing agreements from confirmations and the baseline.
█ GKD-C Wavelet Oscillator, a deep dive
Now that you have a basic understanding of the GKD trading system. let's dive deeper into the features included in the GKD-C Wavelet Oscillator
🔶 GKD-C Wavelet Oscillator Modes aka "Confirmation Type"
The GKD-C Wavelet Oscillator has 4 modes: Confirmation for confirmation 1 and 2; Continuation; Multi-ticker for multi-ticker confirmation 1 and 2; and Optimizer.
🔹 Confirmation: When in this mode, the GKD-C Wavelet Oscillator generates confirmation 1 and 2 signals. These values can then be exported to a GKD-BT backtest strategy.
Signal Key: L = Long, S = Short
GKD-C Wavelet Oscillator in Confirmation mode
Confirmation Exports
GKD-C Wavelet Oscillator in attached to a GKD-BT backtest strategy
**the backtest data rendered to the chart above uses $5 commission per trade and 10% equity per trade with $1 million initial capital. Each backtest result for each ticker assumes these same inputs. The results are NOT cumulative, they are separate and isolated per ticker and trading side, long or short**
🔹 Continuation: When in this mode, the GKD-C Wavelet Oscillator generates continuation signals.
Signal Key: L = Long, S = Short, CL = Continuation Long, CS = Continuation Short
GKD-C Wavelet Oscillator in Continuation mode
Continuation Exports
🔹 Multi-ticker: When in this mode, the GKD-C Wavelet Oscillator generates multi-ticker confirmation 1 and 2. This mode allows users to generate confirmation 1 and 2, and continuation signals for up to 10 different tickers. These values can then be exported to a GKD-BT Multi-ticker backtest.
Signal Key: L = Long, S = Short
GKD-C Wavelet Oscillator in Multi-ticker mode
Multi-ticker Exports
GKD-C Wavelet Oscillator attached to the GKD-BT Multi-ticker SCS Backtest
**the backtest data rendered to the chart above uses $5 commission per trade and 10% equity per trade with $1 million initial capital. Each backtest result for each ticker assumes these same inputs. The results are NOT cumulative, they are separate and isolated per ticker and trading side, long or short**
🔹 Optimizer: When in this mode, the GKD-C Wavelet Oscillator generates optimization signals. These signals allow the user to backtest a range of input values. These values are exported to a GKD-BT optimizer backtest.
Signal Key: L = Long, S = Short
GKD-C Wavelet Oscillator in Optimizer mode
Optimizer Inputs and Exports
GKD-C Wavelet Oscillator attacked to the GKD-BT Optimizer SCS Backtest
**the backtest data rendered to the chart above uses $5 commission per trade and 10% equity per trade with $1 million initial capital. Each backtest result for each ticker assumes these same inputs. The results are NOT cumulative, they are separate and isolated per ticker and trading side, long or short**
█ Conclusion
The GKD-C Wavelet Oscillator serves as a multi-modal component of the GKD trading system allowing traders to optimize and backtest acorss a range of input parameters and tickers. These features decrease total build time required to create a custom GKD algorithmic trading system by allowing users to spend more time trading and less time guessing.
█ How to Access
You can see the Author's Instructions below to learn how to get access.

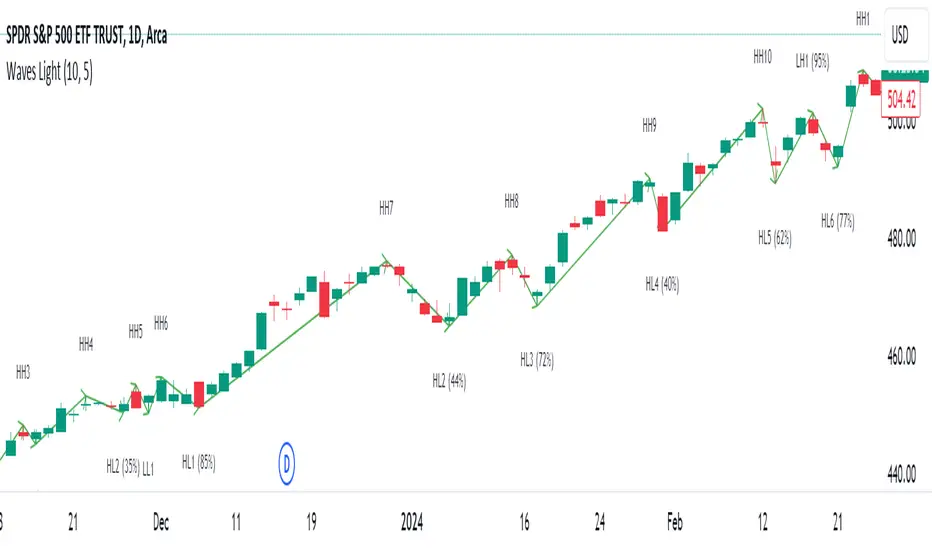
HT: Waves LightIndicator visualizes waves, based on candlestick analysis (one-time-framing and price action concepts), eliminating subjectivity bias that often plagues manual charting of waves. It also doesn’t require much tuning to adjust for specific ticket unlike zigzag or other volatility-based indicators.
Waves can be used to detect current trend and assess its healthiness. For example, we can compare lengths of bullish and bearish waves to detect shift in power. Also, visualization of waves makes it easy to identify chart patterns such as double tops/bottoms, head-and-shoulders etc…
Another application is using waves’ pv points as reference levels to check for Change of Character. For example, in an uptrend higher low (HL) often acts as major support level. If broken it indicates a major change of character (i.e. possible trend reversal)
How it works?
Waves construction:
• Wave construction depends on the selected timeframe.
• Bullish wave lasts while every new candlestick low is higher than previous candlestick low. Breaking of this rule marks change of direction.
• Bearish wave lasts while every new candlestick high is lower than previous candlestick high. Breaking of this rule marks change of direction.
• Outside bars (when new high is higher than previous and new low is lower than previous) are interpreted as continuation of current direction unless counter-movement is really strong
• There is a time lag, measured in candlesticks, between actual direction change and when this change was detected (small triangle markers on the chart)
• Only confirmed bars are used for calculations.
Trend detection:
• Trend detection is based on price-action principle. Uptrend is marked by rising highs and lows; downtrend - by falling highs and lows. We need at least two highs and two lows to confirm trend.
• There are situations of uncertainty when we have higher low and lower high at the same time. They can resolve into continuation of the current trend or into its reversal. Such situations are drawn in gray color.
Pivot Points
Indicator does marking of pivot points based on their relative position - higher low (HL), lower low (LL), higher high (HH), lower high (LH) – and shows retracement level for correction waves.
Parameters:
• Allowance - allowance in ticks that must be exceeded to trigger direction reversal. E.g. if value = 10, then bullish wave ends when new candle low is 10 ticks lower than previous candle low (except for outside bars). Low values are recommended for lower timeframes and/or low volatility tickets; higher values – for higher timeframes and/or high volatility.
• Periods Back – number of candles back from the direction change signal to look for pivot low/high. In 90% of cases 5 is the optimal value but sometimes you might want to increase it for better fit (e.g. for low timeframes/low volatility)
Disclaimer
This indicator should not be used as a standalone tool to make trading decisions. It should be used in conjunction with other technical analysis methods.
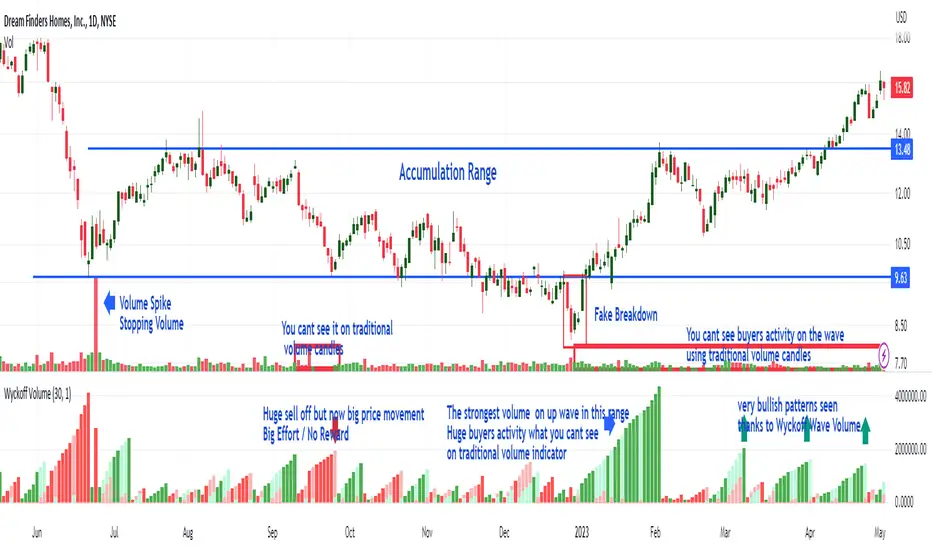
Weis Wave Volume MTF 🎯 Indicator Name
Weis Wave Volume (Multi‑Timeframe) — adapted from the original “Weis Wave Volume by LazyBear.”
This version adds multi‑timeframe (MTF) readings, configurable colors, font size, and screen position for clear dashboard‑style display.
🧠 Concept Background — What is Weis Wave Volume (WWV)?
The Weis Wave Volume indicator originates from Wyckoff and David Weis’ techniques.
Its purpose is to link price movement “waves” with the amount of traded volume to reveal how strong or weak each wave is.
Instead of showing bars one by one, WWV accumulates the total volume while price keeps moving in the same direction.
When price direction changes (up → down or down → up), it:
Finishes the previous wave volume total.
Starts a new wave and begins accumulating again.
Those wave volumes help traders see:
Effort vs Result: Big volume with small price move ⇒ absorption; low volume with big move ⇒ weak participation.
Trend confirmation or exhaustion: High volume waves in trend direction strengthen it, while low‑volume waves hint exhaustion.
⚙️ How this Script Works
Trend & Wave Detection
Compares close with the previous bar to determine up or down movement (mov).
Detects trend reversals (when mov direction changes).
Builds “waves,” each representing a continuous run of bars in one direction.
Volume Accumulation
While price keeps the same direction, the script adds each bar’s volume to the running total (vol).
When direction flips, it resets that total and starts a new wave.
Multi‑Timeframe Computation
Calculates these wave volumes on three timeframes at once, chosen dynamically:
Active Chart Timeframe Displays WWV for:
1 min 1 min
5 min 5 min
15 min 15 min
Any other Chart TF
It uses request.security() to pull each timeframe’s latest WWV value and current wave direction.
Visual Output
Instead of plotting histogram bars, it shows a table with three numeric values:
WWV (1): 25.3 M | (15): 312 M | (240): 2.46 B
Each value is color‑coded:
user‑selected Uptrend Color when price wave = up
user‑selected Downtrend Color when wave = down
You can position this small table in any corner/center (top / bottom × left / center / right).
Font size is user‑adjustable (Tiny → Huge).
📈 How Traders Use It
Quickly gauge buying vs selling effort across multiple horizons.
Compare short‑term wave volume to higher‑timeframe waves to spot:
Alignment → all up and big volumes = strong trend
Divergence → small or opposite‑colored higher‑TF wave = potential reversal or pause
Combine with Wyckoff, VSA, or standard trend analysis to judge if a breakout or pullback has real participation.
🧩 Key Features of This Version
Feature Description
Multi‑Timeframe Panel Displays WWV values for 3 selected TFs at once
Dynamic TF Mapping Auto‑adjusts which TFs to use based on chart
Up/Down Color Coding Customizable colors for wave direction
Adjustable Font and Placement Set font size (Tiny→Huge) and screen corner/center
No Histograms Keeps chart clean; acts as a compact WWV dashboard

Elliott Wave [BigBeluga]🔵 OVERVIEW
Elliott Wave automatically finds and draws an Elliott-style 5-wave impulse and a dashed projection for a potential -(a)→(b)→(c) correction. It detects six sequential reversal points from rolling highs/lows — 1, 2, 3, 4, 5, (a) — validates their relative placement, and then renders the wave with labels and horizontal reference lines. If price invalidates the structure by closing back through the Wave-5 level inside a 100-bar window, the pattern is cleared (optionally kept as “broken”) while key dotted levels remain for context.
🔵 CONCEPTS
Reversal harvesting from extremes : The script scans highest/lowest values over a user-set Length and stores swing points with their bar indices.
Six-point validation : A pattern requires six pivots (1…5 and (a)). Their vertical/temporal order must satisfy Elliott-style constraints before drawing.
Impulse + projection : After confirming 1→5, the tool plots a curved polyline through the pivots and a dashed forward path from (a) toward (b) (midpoint of 5 and (a)) and back to (c).
Risk line (invalidator) : The Wave-5 price is tracked; a close back through it within 100 bars marks the structure as broken.
Minimal persistence : When broken, the wave drawing is removed to avoid noise, while dotted horizontals for waves 5 and 4 remain as reference.
🔵 FEATURES
Automatic pivot collection from rolling highs/lows (user-controlled Length ).
Wave labeling : Points 1–5 are printed; the last collected swing is marked b
. Projected i
& i
are shown with a dashed polyline.
Breaker line & cleanup : If price closes above Wave-5 (opposite for bears) within 100 bars, the pattern is removed; only dotted levels of 5 and 4 stay.
Styling controls :
Length (pivot sensitivity)
Text Size for labels (tiny/small/normal/large)
Wave color input
Show Broken toggle to keep invalidated patterns visible
Lightweight memory : Keeps a compact buffer of recent pivots/draws to stay responsive.
🔵 HOW TO USE
Set sensitivity : Increase Length on noisy charts for cleaner pivots; decrease to catch earlier/shorter structures.
Wait for confirmation : Once 1→5 is printed and (a) appears, use the Wave-5 line as your invalidation. A close back through it within ~100 bars removes the active wave (unless Show Broken is on).
Plan with the dashed path : The (a)→(b)→(c) projection offers a scenario for potential corrective movement and risk placement.
Work MTF : Identify cleaner waves on higher TFs; refine execution on lower TFs near the breaker or during the move toward (b).
Seek confluence : Align with structure (S/R), volume/Delta, or your trend filter to avoid counter-context trades.
🔵 CONCLUSION
Elliott Wave systematizes discretionary wave analysis: it detects and labels the 5-wave impulse, projects a plausible (a)-(b)-(c) path, and self-cleans on invalidation. With clear labels, dotted reference levels, and a practical breaker rule, it gives traders an objective framework for scenario planning, invalidation, and timing.

zSph x Larry Waves Wave Zone ForecastElliott Waves and Fibonacci Ratio Lengths have a strong correlated relationship when observing the general strength and termination of both Impulse (Motive) Waves and Corrective Waves.
There are certain Fibonacci levels that are highly reactive when applying it from a Wave Analysis perspective and being aware of the current wave sequence is required.
Often, those beginning their Elliott Wave journey and studies are unsure what Fibonacci levels are relevant and how to apply it to the wave structure that is being observed – this tool removes that ambiguity on placement.
Being aware of the predisposed levels that have a high rate of reaction can assist in managing trades from a scalp intra-day approach, a day trading approach, and a swing trading approach.
# Concept
This tool helps with identifying zones that are relevant to the wave that is currently in progression upon the market and visualize important Fibonacci levels where reactions often occur from an Elliott Wave perspective such as:
Wave 2
Wave 3
Wave 4
Wave 5
Wave B Zigzag
Wave B Flat
Wave X Zigzag
Wave X Flat
Wave C
Wave Y
This helps remove almost all the manual labor of updating fib levels, selecting certain fib levels, and manually moving the fib levels as price continues to print while autonomously providing the levels visually.
# Correct Usage
Wave 3 / Wave C / Wave Y
Once a clear impulse/motive structure has been identified for a Wave 1, Wave A or Wave W, apply the indicator to the structure.
Anchor 1 is the beginning of the impulse for Wave 1 or A or W.
Anchor 2 is the end of the impulse for Wave 1 or A or W.
The result is the standard zones for Wave 3, Wave C and Wave Y.
BINANCE:LINKUSD
Wave 4
Once a clear impulse/motive structure has been identified for Wave 3, apply the indicator to the structure.
Anchor 1 is the beginning of Wave 3 (or the end of Wave 2)
Anchor 2 is the end of Wave 3 (or the beginning of Wave 4)
The result is the standard zone for Wave 4.
LINKUSD
Wave B / Wave X / Wave C / Wave Y
Once a clear 3-wave corrective has been identified for a potential Corrective pattern, apply the indicator to the structure.
- Anchor 1 is the end of beginning of Wave A or Wave W
- Anchor 2 is the end of Wave A or Wave W
The result is the standard zones Waves B / X and Waves C / Y for Zigzags, Flats and Combos.
BINANCE:LINKUSD
# Settings
"Show Labels" will toggle on and off the labels for each fib zone, each fib line, and invalidation ticks that are in the 2/3 – B/C option to help with calculating risk management quickly.
"Use Log Scale" will allow you to toggle on/off the log scale for log fibs
"Extend Lines" will allow you to extend the fib lines to current price action from the Elliott Wave Zones to see reactions off the fib levels.
“Extend Zones” will allow you to extend the overall zone for the fibs to current price action from the Elliott Wave Zones to see reactions off the zone. There is also user customization of color use for the zones/.
“Fib Levels” will allow you to customize the lines and colors of the fibs lines.
“X-Axis Offset” will increase or decrease the position of the fibs of the zones (not the extension boxes)..

HGDA – Wave Target 🔹 HGDA – Wave Target
Precision Wave Projections + Liquidity-Confirmed Alerts
📌 Overview:
This indicator automatically detects confirmed price waves and projects smart Fibonacci-based targets for both reversals and breakouts.
It’s powered by a multi-layered logic that combines:
Pivot-based wave detection
MA30 trend confirmation
Live buy/sell pressure analysis
Ratio-based price projection
And visual + table alerts only when all conditions are aligned.
The result is a clean, noise-free system that highlights only high-probability price targets — after real confirmation.
⚙️ Core Logic:
Wave Detection
The indicator waits for a valid swing high or low to form (using pivots).
Once confirmed, it tracks the most recent directional wave.
Trend Filter (MA30)
Only waves in the direction of the 30-period Moving Average are considered valid.
E.g. Bullish wave must be above MA30, bearish wave below.
Liquidity Confirmation
An internal smart flow engine measures real-time buy/sell pressure.
The wave direction must match liquidity dominance to be valid.
Target Calculation
For reversal scenarios: the wave is projected in the opposite direction.
For breakout scenarios: the wave is extended in the same direction.
Target levels include: 1.236 – 1.5 – 1.618
Smart Alerts
Visual alerts are displayed only when trend + liquidity + ratios align.
No signals are shown during weak, unclear, or conflicting phases.
💡 How to Use:
✅ Step 1: Switch to the 1H chart for optimal balance between structure and signal reliability (works also on 30m–4H).
✅ Step 2: Wait for a new wave to appear with valid trend direction (check the trend row in the table).
✅ Step 3: Confirm that buy/sell pressure supports the wave.
✅ Step 4: Observe the projected targets on the chart (1.236 / 1.5 / 1.618).
✅ Step 5: Plan entry around the first ratio zone with stop loss behind the wave base.
✅ Step 6: Use alerts to act on opportunities when all layers align.
🧠 Built for Traders Who...
Want a clean structure-based system
Avoid false signals caused by random pivots or overused indicators
Rely on trend + liquidity + wave structure for their setups
Prefer price action + dynamic ratios over fixed patterns
📋 Built-in Table Shows:
📈 Wave target price
🧭 Trend direction
💧 Liquidity pressure
🎯 Closest ratio zone
📊 Signal status
🚫 No Repainting – 100% Confirmed Signals Only.

Adaptive Causal Wavelet Trend FilterThe Adaptive Causal Wavelet Trend Filter is a technical indicator implementing causal approximations of wavelet transform properties for better trend detection with adaptive volatility response.
The Adaptive Causal Wavelet Trend Filter (ACWTF) applies mathematical principles derived from wavelet analysis to financial time series, providing robust trend identification with minimal lag. Unlike conventional moving averages, it preserves significant price movements while filtering market noise through signal processing that i describe below.
I was inspired to build this indicator after reading " Wavelet-Based Trend Identification in Financial Time Series " by In, F., & Kim, S. 2013 and reading about Mexican Hat wavelet filters.
The ACWTF maintains optimal performance across varying market regimes without requiring parameter adjustments by adapting filter characteristics to current volatility conditions.
Mathematical Foundation
Inspired by the Mexican Hat wavelet (Ricker wavelet), this indicator implements causal approximations of wavelet filters optimized for real-time financial analysis. The multi-resolution approach identifies features at different scales and the adaptive component dynamically adjusts filtering characteristics based on local volatility measurements.
Key mathematical properties include:
Non-linear frequency response adaptation
Edge-preserving signal extraction
Scale-space analysis through dual filter implementation
Volatility-dependent coefficient adjustment, which I love
Filter Methods
Adaptive: Implements a volatility-weighted combination of multiple filter types to optimize the time-frequency resolution trade-off
Hull: Provides a causal approximation of wavelet edge detection properties with forward-projection characteristics
VWMA: Incorporates volume information into the filtering process for enhanced signal detection
EMA Cascade: Creates a multi-pole filter structure that approximates certain wavelet scaling properties
Suggestion: try all as they will provide slightly different signals. Try also different time-frames.
Practical Applications
Trend Direction Identification: Clear visual trend direction with reduced noise and lag
Regime Change Detection: Early identification of significant trend reversals
Market Condition Analysis: Integrated volatility metrics provide context for current market behavior
Multi-timeframe Confirmation: Alignment between primary and secondary filters offers additional confirmation
Entry/Exit Timing: Filter crossovers and trend changes provide potential trading signals
The comprehensive information panel provides:
Current filter method and trend state
Trend alignment between timeframes
Real-time volatility assessment
Price position relative to filter
Overall trading bias based on multiple factors
Implementation Notes
Log returns option provides improved statistical properties for financial time series
Primary and secondary filter lengths can be adjusted to optimize for specific instruments and timeframes
The indicator performs particularly well during trend transitions and regime changes
The indicator reduces the need for using additional indicators to check trend reversion

Weis Wave Max█ Overview
Weis Wave Max is the result of my weis wave study.
David Weis said,
"Trading with the Weis Wave involves changes in behavior associated with springs, upthrusts, tests of breakouts/breakdowns, and effort vs reward. The most common setup is the low-volume pullback after a bullish/bearish change in behavior."
THE STOCK MARKET UPDATE (February 24, 2013)
I inspired from his sentences and made this script.
Its Main feature is to identify the largest wave in Weis wave and advantageous trading opportunities.
█ Features
This indicator includes several features related to the Weis Wave Method.
They help you analyze which is more bullish or bearish.
Highlight Max Wave Value (single direction)
Highlight Abnormal Max Wave Value (both directions)
Support and Resistance zone
Signals and Setups
█ Usage
Weis wave indicator displays cumulative volume for each wave.
Wave volume is effective when analyzing volume from VSA (Volume Spread Analysis) perspective.
The basic idea of Weis wave is large wave volume hint trend direction. This helps identify proper entry point.
This indicator highlights max wave volume and displays the signal and then proper Risk Reward Ratio entry frame.
I defined Change in Behavior as max wave volume (single direction).
Pullback is next wave that does not exceed the starting point of CiB wave (LH sell entry, HL buy entry).
Change in Behavior Signal ○ appears when pullback is determined.
Change in Behavior Setup (Entry frame) appears when condition of Min/Max Pullback is met and follow through wave breaks end point of CiB wave.
This indicator has many other features and they can also help a user identify potential levels of trade entry and which is more bullish or bearish.
In the screenshot below we can see wave volume zones as support and resistance levels. SOT and large wave volume /delta price (yellow colored wave text frame) hint stopping action.
█ Settings
Explains the main settings.
-- General --
Wave size : Allows the User to select wave size from ① Fixed or ② ATR. ② ATR is Factor x ATR(Length).
Display : Allows the User to select how many wave text and zigzag appear.
-- Wave Type --
Wave type : Allows the User to select from Volume or Volume and Time.
Wave Volume / delta price : Displays Wave Volume / delta price.
Simplified value : Allows the User to select wave text display style from ① Divisor or ② Normalized. Normalized use SMA.
Decimal : Allows the User to select the decimal point in the Wave text.
-- Highlight Abnormal Wave --
Highlight Max Wave value (single direction) : Adds marks to the Wave text to highlight the max wave value.
Lookback : Allows the User to select how many waves search for the max wave value.
Highlight Abnormal Wave value (both directions) : Changes wave text size, color or frame color to highlight the abnormal wave value.
Lookback : Allows the User to select SMA length to decide average wave value.
Large/Small factor : Allows the User to select the threshold large wave value and small wave value. Average wave value is 1.
delta price : Highlights large delta price by large wave text size, small by small text size.
Wave Volume : Highlights large wave volume by yellow colored wave text, small by gray colored.
Wave Volume / delta price : highlights large Wave Volume / delta price by yellow colored wave text frame, small by gray colored.
-- Support and Resistance --
Single side Max Wave Volume / delta price : Draws dashed border box from end point of Max wave volume / delta price level.
Single side Max Wave Volume : Draws solid border box from start point of Max wave volume level.
Bias Wave Volume : Draws solid border box from start point of bias wave volume level.
-- Signals --
Bias (Wave Volume / delta price) : Displays Bias mark when large difference in wave volume / delta price before and after.
Ratio : Decides the threshold of become large difference.
3Decrease : Displays 3D mark when a continuous decrease in wave volume.
Shortening Of the Thrust : Displays SOT mark when a continuous decrease in delta price.
Change in Behavior and Pullback : Displays CiB mark when single side max wave volume and pullback.
-- Setups --
Change in Behavior and Pullback and Breakout : Displays entry frame when change in behavior and pullback and then breakout.
Min / Max Pullback : Decides the threshold of min / max pullback.
If you need more information, please read the indicator's tooltip.
█ Conclusion
Weis Wave is powerful interpretation of volume and its tell us potential trend change and entry point which can't find without weis wave.
It's not the holy grail, but improve your chart reading skills and help you trade rationally (at least from VSA perspective).
Bullish Wave StructureThis indicator visualizes bullish waves and the uptrend structure. It highlights the wave patterns, breakout levels, and swing highs and lows, distinguishing major and minor swings. The script also incorporates labels to denote trend and wave numbers, enhancing clarity in trend and wave identification. The waves plotted on the chart aid in chart study, trend analysis, and decision-making. Drawing objects on the chart are customizable.
## Fundamental Trend Assumptions
A trend starts when there is a break above a major swing high. There is then a first wave.
Subsequent waves are validated when there is a break above the high of the preceding wave and another major swing high is detected.
The trend ends when the price trades below the swing low of the latest wave.
## Wave drawing mechanism
The drawing of a wave occurs when:
There is a break above a major swing high (or the high of a wave) and another major swing high is detected.
There is a break above a major swing high (or the high of a wave) and the price collapses below the lowest point between the highest high and the high of the previous wave. The script treats this false break high as a legitimate bullish wave, even if no major swing high has been detected. The trend ends because the low of the current wave has been breached. This is a false break high that falls back within the range of the preceding wave.
There is a break above a major swing high (or the high of a wave) and the price collapses below the low of the preceding wave. The script treats this false break high as a legitimate bullish wave, even if no major swing high has been detected. The trend ends because the low of the preceding wave has been breached. This is a false break high followed by a sharp sell-off.
In short, the script draws the wave if there is a break above a major swing high (or the high of a wave) and another swing high is detected (or there is a break below the low of a wave).
## Remarks
While lower timeframes could benefit from this indicator, it shows clearer wave and trend structures in higher timeframes, starting from the 1H chart.
This indicator does not provide price projections. The drawing occurs after the price patterns have been unveiled. In other words, it draws waves and performs labeling in hindsight. However, users can fully benefit from the indicator for trend study and various technical analyses to support trading decisions, as explained in the description above.
## Acknowledgement
The script uses user-defined functions to look back and find indexes of the highest and lowest values when no swings have been found (i.e., one-bar false break high and collapse). The detection of regular minor and major swings has been accomplished by the built-in functions:
ta.pivothigh() [Pine Script Language Reference Manual — TradingView (www.tradingview.com)
ta.pivotlow() [Pine Script Language Reference Manual — TradingView (www.tradingview.com)

Wolfe Wave Detector [LuxAlgo]The Wolfe Wave Detector displays occurrences of Wolfe Waves, alongside a target line. A multiple swing detection approach is used to maximize the number of detected waves.
The indicator includes a dashboard with the number of detected waves, as well as the number of reached targets.
🔶 USAGE
The Wolfe Wave pattern is a chart pattern composed of five segments, with the initial segment extremities (points XABCD) forming a channel containing price variations.
After the price reaches point D , we can expect a reversal toward a target line (point E ). The target line is obtained by connecting and extending point X -> C .
The script draws the XABCD pattern and a projection of where E might potentially be located.
The projection is derived from the intersection between the target line and a line starting from D , parallel to B-C . From this line, margins are added, left and right, creating a wedge-shaped figure in most cases.
When the price passes the target line, this is highlighted by a dot. The dot and pattern are green by default when the target is above D and red when the target is below D . Colors can be edited in the settings. The dashed target line is colored in the opposite color.
As seen in the above example, the price trend can reverse after reaching the target line.
🔹 Symmetry
Ideally, the Wolfe Wave must have a degree of symmetry; every upward line should have a similar angle to the other upward lines, and the same should be true for the downward lines.
Also, the lines forming the channel should be as parallel as possible.
Users have the option to adjust the tolerance:
Margin controls the wave symmetry of the pattern
Angle controls the channel symmetry of the pattern
It's important to note that in both cases, a lower number will lead to more symmetrical patterns, but they may appear less frequently.
It is also important to note that increasing the Margin can delay validating the pattern. In the meantime, the price could surpass the channel in the opposite direction, invalidating and deleting the otherwise valid pattern.
🔹 Multiple Swings
Users can set a Minimum Swing length (for example 2) and a Maximum Swing length (for example 100) which defines the range of the swing point detection length, higher values for these settings will detect longer-term Wolfe patterns, while a larger range will allow for the detection of a larger number of patterns.
By using multiple swings, it is possible to find smaller next to larger patterns at the same time.
The dashboard shows the number of patterns found and targets reached. When, for example, bullish patterns are disabled in the settings, the dashboard only shows the results of bearish patterns.
🔹 Extend Target Line
The publication includes a setting that allows the Target Line to be extended up to 50 bars further. As seen in the above example, the Target Line can still be reached even after the pattern has been finalized. Once the Target Line is reached, it won't be updated further.
Here is another example of a Target Line being reached later on.
The Target Line acted as a support level, after which where the price changed direction.
🔹 Show Progression
An option is included to show the progression before the pattern is completed. Users can make use of the XABC pattern or visualize where point D should be positioned.
The focus lies on the bar range (between the left and right borders of the grey rectangle). The pattern is considered invalid and deleted when point D is beyond these limits. The height of the rectangle is optional. Ideally, the price should be located between the top and bottom of the rectangle, but it is not mandatory.
Show Progression has three options including:
Full: Show all lines of XABC plus line C-D and rectangle for the position of point D
Partial: Show line C-D and rectangle for the position of point D
None: Only show valid completed patterns
The 'Partial' option in the 'Show Progression' feature is designed to help users locate the desired position of point D without the visual clutter caused by the XABC lines. This can be useful for those who prefer a cleaner visual representation of the evolving pattern.
🔶 SETTINGS
🔹 Swing Length
Minimum: Minimum length used for the swing detection.
Maximum Swing Length: Maximum length used for the swing detection.
🔹 Tolerance
Margin: Influences the symmetry of the pattern; with a higher number allowing for less symmetry.
Angle: Influences the symmetry of the channel; with a higher number allowing for less symmetry.
🔹 Style
Toggle: Bullish/Bearish + colors
Extend Target Line: Extend a maximum of 50 bars or until Target Line is reached
Show Progression: Show pattern progression
Dot Size: The size of the dot when the Target Line is reached
🔹 Dashboard
Show Dashboard: Toggle dashboard which shows the number of found patterns and targets reached.
Location: Location of the dashboard on the chart.
Text Size: Text size.
🔹 Calculation
Calculated Bars: Allows the usage of fewer bars for performance/speed improvement

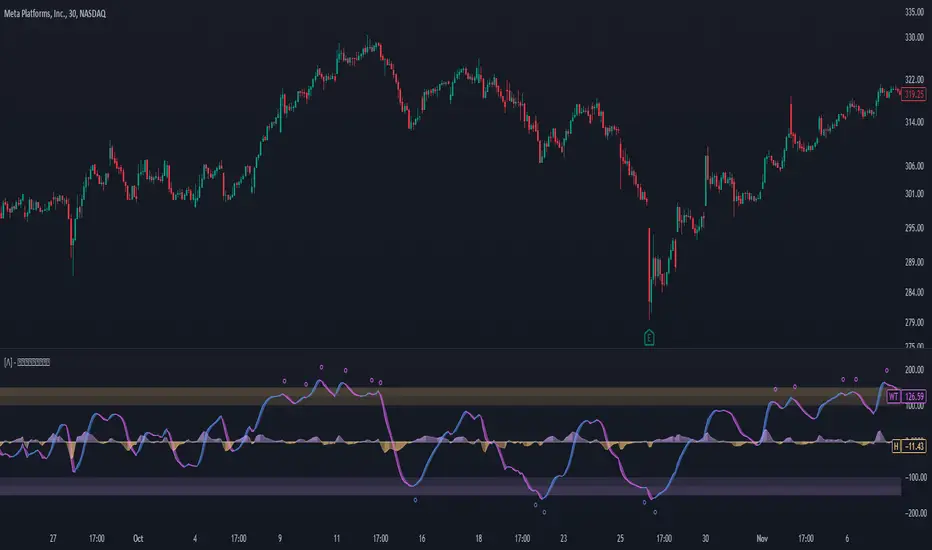
Enhanced WaveTrend OscillatorThe Enhanced WaveTrend Oscillator is a modified version of the original WaveTrend. The WaveTrend indicator is a popular technical analysis tool used to identify overbought and oversold conditions in the market and generate trading signals. The enhanced version addresses certain limitations of the original indicator and introduces additional features for improved analysis and comparison across assets.
WaveTrend:
The original WaveTrend indicator calculates two lines based on exponential moving averages and their relationship to the asset's price. The first line measures the distance between the asset's price and its EMA, while the second line smooths the first line over a specific period. The result is divided by 0.015 multiplied by the smoothed difference ('d' for reference). The indicator aims to identify overbought and oversold conditions by analyzing the relationship between the two lines.
In the original formula, the rudimentary estimation factor 0.015 times 'd' fails to accomodate for approximately a quarter of the data, preventing the indicator from reaching the traditional stationary levels of +-100. This limitation renders the indicator quantitatively biased, as it relies on the user's subjective adjustment of the levels. The enhanced version replaces this factor with the standard deviation of the asset's price, resulting in improved estimation accuracy and provides a more dynamic and robust outcome, we thereafter multiply the result by 100 to achieve a more traditional oscillation.
Enhancements and Features:
The enhanced version of the WaveTrend indicator addresses several limitations of the original indicator and introduces additional features-
Dynamic Estimation: The original indicator uses an arbitrary estimation factor, while the enhanced version replaces it with the standard deviation of the asset's price. This modification provides a more dynamic and accurate estimation, adapting to the specific price characteristics of each asset.
Stationary Support and Resistance Levels: The enhanced version provides stationary key support and resistance levels that range from -150 to 150. These levels are determined based on the analysis of the indicator's data and encompass more than 95% of the indicator's values. These levels offer important reference points for traders to identify potential price reversals or significant price movements.
Comparison Across Assets: The enhanced version allows for better comparison and analysis across different assets. By incorporating the standard deviation of the asset's price, the indicator provides a more consistent and comparable interpretation of the market conditions across multiple assets.
Upon closer inspection of the modification in the enhanced version, we can observe that the resulting indicator is a smoothed variation of the Z-Score!
f_ewave(src, chlen, avglen) =>
basis = ta.ema(src, chlen)
dev = ta.stdev(src, chlen)
wave = (src - basis) / dev * 100
ta.ema(wave, avglen)
Z-Score Analysis:
The Z-Score is a statistical measurement that quantifies how far a particular data point deviates from the mean in terms of standard deviations. In the enhanced version, the calculation involves determining the basis (mean) and deviation (standard deviation) of the asset's price to calculate its Z-Score, thereafter applying a smoothing technique to generate the final WaveTrend value.
Utility:
The 𝗘𝗻𝗵𝗮𝗻𝗰𝗲𝗱 𝗪𝗧 indicator offers traders and investors valuable insights into overbought and oversold conditions in the market. By analyzing the indicator's values and referencing the stationary support and resistance levels, traders can identify potential trend reversals, evaluate market strength, and make better informed analysis.
It is important to note that this indicator should be used in conjunction with other technical analysis tools and indicators to confirm trading signals and validate market dynamics.
Credit:
The 𝗘𝗻𝗵𝗮𝗻𝗰𝗲𝗱 𝗪𝗧 indicator is a modification of the original WaveTrend Oscillator developed by @LazyBear on TradingView.
Example Charts:
Elliott Wave [LuxAlgo]The Elliott Wave indicator allows users to detect Elliott Wave (EW) impulses as well as corrective segments automatically on the chart. These are detected and displayed serially, allowing users to keep track of the evolution of an impulse or corrective wave.
Fibonacci retracements constructed from detected impulse waves are also included.
This script additionally allows users to get alerted on a wide variety of trigger conditions (see the ALERTS section below).
🔶 SETTINGS
🔹 Source
• "high" -> options high, close, maximum of open/close
• "low" -> options low, close, minimum of open/close
🔹 ZigZag
• The source and length are used to check whether a new Pivot Point is found.
Example:
• source = high/low, length = 10:
• There is a new pivot high when:
- previous high is higher than current high
- the highs of 10 bars prior to previous high are all lower
• These pivot points are used to form the ZigZag lines, which in their turn are used for pattern recognition
🔶 USAGE
The basic principles we use to identify Elliott Wave impulses are:
• A movement in the direction of the trend ( Motive/Impulse wave ) is divided in 5 waves (Wave 1 -> 5)
• The Corrective Wave (against the trend) is divided in 3 waves (Wave A -> C)
• The waves can be subdivided in smaller waves
• Wave 2 can’t retrace more than the beginning of Wave 1
• Wave 4 does not overlap with the price territory of Wave 1
Here we see an example:
Let's look at the development:
• 1 bar after point (5) a confirmed 5 Motive Wave pattern is found (1 -> 5; The 5 Waves can also be seen as one large Wave 1 ).
• Next, the script draws a set of Fibonacci lines, which are area's where the Corrective Wave potentially will bounce.
Here we see the fifth wave is getting larger, the previous highest point is updated, and the Wave 5 is larger than Wave 3 :
(At this point, the pattern is invalidated, and it display as dotted)
Further progression in time:
At this point, a confirmed " 3 Corrective Wave pattern " is found (a -> c)
When a new high has developed, a circle is drawn (in the same color of the lines)
However, when the bottom of the drawn box has breached, a red cross will be visualized.
Further progression:
Later on, a bearish confirmed " 5 Motive Wave pattern " is found (1 -> 5):
When a Corrective Wave becomes invalidated, the ABC pattern will display as dashed (not dotted):
🔶 TECHNIQUES
Pine Script™ introduces methods!
• More information can be found here:
• Pine Script™ v5 User Manual 👉 Methods
• Pine Script™ language reference manual 👉 method
🔶 ALERTS
Dynamic alerts are included in the script, you only need to set 1 alert to receive following messages:
• When a new EW Motive Pattern is found (Bullish/Bearish )
• When a new EW Corrective Pattern is found (Bullish/Bearish )
• When an EW Motive Pattern is invalidated (Bullish/Bearish )
• When an EW Corrective Pattern is invalidated (Bullish/Bearish )
• When possible, a start of a new EW Motive Wave is found (Bullish/Bearish )
• Here is information how you can set these alerts()

Elliott Wave [MS]Elliott Wave counter for TradingView! Automatically count Elliott waves on any asset and any timeframe. The script will count in-progress patterns as well as show past patterns that have completed (adjustable in Settings).
Simple to use, just add to your chart and choose how big of waves you're looking for with the Size setting.
Smaller numbers will auto count smaller sized Elliott Waves.
Larger numbers will auto count bigger sized Elliott Waves.
Scan for multiple size waves by adding the indicator to your chart multiple times.
Settings
Size - Set how big or small of waves you want to scan for
Hide Failed Patterns - Show or hide past waves that didn't get to 5
Color Mode - Set your own colors for each wave
Function Sawtooth WaveThis is an indicator to draw a sawtooth wave on the chart.
It can be a useful perspective, as decaying markets tend to oscillate in reverse sawtooth waves, and bullish markets can oscillate in conventional sawtooth waves. With the right inputs, it can be an early warning signal for potential movements.
Something I've noted is that large waves cause a ripple effect and sets the frequency for the market until a change occurs. Sawtooth waves may help in capturing ripple waves.
Useful inputs are:
- Average True Range as wave height (amplitude)
- Periodicity of market as wave duration (frequency)
(Inputs will change the wave from conventional to reverse)
I hope that it is helpful.
GLHF
- DPT

Hashem WaveTrendHASHEM WAVETREND
This indicator is mixture of 4 types of WaveTrends with proper SMA and EMA Smoothings. When the Blue wave crosses the purple wave and if they are in the Lower or Higher Zones, that could be a setup. Also, Customized Godmode with 2 settings and Divergences on Purple Wave are included.
When an Orange Triangle shows up it means the setup is quite powerful.
This can be used on any timeframes and any markets. Don't forget always Higher TF = More Weight and Don't be greedy in CounterTrends .
Besides, VWAP (the difference between the two waves) is plotted. When the Yellow wave is high and near the Fibo levels, It means the trend is just started OR it's near the end.
This indicator is powerful in Swings , Scalpes and Trends on any timeframe, but when the price is ranging in a very tight range , the signals often would be false. So be careful about tight ranges .
Note That The Signals are NOT Confirmed. You must Confirm them with your own TA.

Elliott Wave - AutoCounting [NXT2017] draws the Wave 3 and 5HI BIG PLAYERS,
here's another indicator that I use pretty often.
The waves of Elliott Wave theory are automatically detected and displayed.
It makes it possible to count the Elliott waves almost always correctly and plausibly. However, the tool can only detect wave 3 as well as waves 5, A, B and C. The rest you have to draw yourself.
Sometimes the waves 3 and 5/A/B/C overlap - so I only use the view with wave 3 myself.
Kind regards
NXT2017

[AU] Waves+ Waves+ v0R7b
Plus version of Waves with components from both Waves Advanced and Mnemosyne. Essentially, Waves+ is highly configurable hybrid wavetrend oscillator and Fibonacci oscillator.
Slow wavetrend component replaced by Follower/Base from Mnemosyne indicator
TTM Squeeze Loose/Strict + Explosion Zones now enabled by default
Extreme Caution Fast Wavetrend Line, Fast wavetrend and Extreme Caution Fast WT cross signal now available
Disabled/removed to speed up script performance and load time: Divergence component, stoch k crossovers, T1 signals. Draw objects reduced from 89 to 64 to conform to Pinescript v4 requirements.
Large inactive code blocks stripped/removed to speed up performance and load time

ZigZag Multi [TradingFinder] Trend & Wave Lines - Structures🔵 Introduction
"Zigzag" is an indicator that forms based on price changes. Essentially, the function of this indicator is to connect consecutive and alternating High and Low pivots. This pattern assists in analyzing price changes and can also be used to identify classic patterns. "Zigzag" is an analytical tool that, by filtering partial price movements based on the specified period, can identify price waves across different time frames (short or long term).
🔵 Reason for Creation
The combination of "short term zigzag" and "long term zigzag" enhances accuracy and reduces analysis time. In a time frame, "long term zigzag" represents the main trend, while "short term zigzag" depicts short-term waves.
🔵 How to Use
After selecting the desired time frame and adding "zigzag" to the chart, begin utilization. Keep in mind to identify the main market trend from "long term zigzag" and the minor waves from "short term zigzag".
🟣 Important: Additionally, classic patterns such as HH, LH, LL, and HL can be recognized. All traders analyzing financial markets using classic patterns and Elliot Waves can benefit from the "zigzag" indicator to facilitate their analysis.
🔵 Settings
Short term zigzag : In this section, you can adjust settings such as time frame range, display mode, color, and line width of the zigzag lines.
Short term label : This section allows you to activate or deactivate the display of zigzag labels according to your needs. You can also customize their color and size.
Long term zigzag : Here, you can adjust settings for time frame range, display mode, color, and line width of zigzag lines.
Long term label : Similar to short term label settings.
The recommended time frame for "long term zigzag" is between 9 to 15, and for "short term zigzag" is between 3 to 5.
🟣 Important Notes :
Considering the different behaviors of financial markets and various time frames, it is recommended to experiment with different time frame settings when using "zigzag" to find the best settings for each symbol and time frame, thereby preventing potential errors.
🟣 Terminology Explanations :
"HH": When the price is higher than the previous peak (Higher High).
"HL": When the price is higher than the previous low (Higher Low).
"LH": When the price is lower than the previous peak (Lower High).
"LL": When the price is lower than the previous low (Lower Low).

[volfgang] WAVEA compass to the financial charts.
The Volfgang WAVE Indicator helps you to decode complex market trends and make informed decisions in your trading.
Quick Summary
The WAVE has a signal line which alternates between Red or Blue.
Red is bearish and Blue is bullish.
It turns Blue when the WAVE line crosses above the signal and holds for 1 bar.
it turns Red when the WAVE line crosses below the signal and holds for 1 bar.
(You can change the signal line’s length in the settings, the default is 3 which is suited towards Day Trading – For Swing Traders I recommend 4 or 5 – For Investors 6 to 9).
The WAVE line will change colour to alert you when price is potentially pivoting.
When the WAVE is WHITE, the trend is currently Bearish but could flip bullish soon.
When the WAVE is GREEN, the trend is Bullish and there is strong Bullish momentum.
When the WAVE is ORANGE, it means trend is bullish but there is danger of a Bearish Reversal.
When the WAVE is PINK it means there is strong Bearish Momentum.
WAVETrend Scanner
The WAVETrend Scanner can be enabled in the settings and gives you a quick overview of the current trend across 8 potential timeframes:
You can use this to make sure the trades you are taking on lower timeframes align with the current bias on higher term timeframes, thus ensuring a higher chance of success.
WAVE Colours
The background colour of the WAVE also changes according to the current trend across multiple timeframes. The scanner is constantly measuring the current trend across 7 timeframes;
When 4 timeframes line up Bullish, the WAVE is LIGHT BLUE (Cyan)
When 5 timeframes line up Bullish, the WAVE is DARK BLUE (Navy)
When 6+ timeframes line up Bullish, the WAVE is GREEN
When 4 timeframes line up Bearish, the WAVE is ORANGE
When 5 timeframes line up Bearish, the WAVE is RED
When 6+ timeframes line up Bearish, the WAVE is PINK
Divergence Checker & Buy/Sell Signals
The BUY and SELL Signals are represented by a BLUE or RED Histogram line that extends from the WAVE to the 0 Line.
A BUY signal shows when a Crossover occurs & there is a Bullish Diversion Present within the last 50 bars.
A SELL signal appears when a Crossunder occurs & there is Bearish Diversion present within the last 50 bars.
You can change the length of the Divergence Checker in the settings, default is 50 bars.
Under The Hood
The WAVE pulls information from multiple sources within a set period such as;
Close Price
Highest Price
Lowest Price
EMA
The script applies a set of complicated algebraic equations. Which essentially measures the and of recent price action.
Then it uses EMA's to measure from the and , whilst applying more weight to recent price action.
The functions then calculate more averages which measure the difference from and .
Next, it uses all of these calculated averages to create a value that represents the current WAVE condition. This calculation will determine whether the WAVE is in a bullish or bearish trend.
This sum is then smoothed out to get one more value, which is used to display the info box content that allows us to see exactly at what price the WAVE will keep rising or keep falling.
One final calculation also predicts the point at which the WAVE will flip trend. It uses similar calculations to the "Keep Rising/Falling" prediction function, but its aim is to predict the exact price at which the WAVE will cross.
What gives the WAVE indicator an edge over most Stochastic Indicators, is how it uses Pinescript's "request.security" function to pull information from multiple timeframes in order to generate plots, info data and colours to add much more relevant information to the chart which you can use to make informed trading decisions. This is what allows the WAVETrend Scanner to work.
The WAVE indicator is designed to work with all markets and asset types.

Wyckoff Wave Volume
What Is Wyckoff Wave Volume and How Does It Work?
It is the cumulative sum of exchanged (sold/bought) shares or contracts on a given wave (downward or upward) in a given time plotted below the chart as volume histogram. It shows how much trade is taking place on a given wave. Values are displayed below the chart as opposed to the Wyckoff Wave Chart indicator which displays these values as numbers plotted on the chart.
As you can see in the attached chart, volume candles usually only show a single buyer and seller exposure on the chart. On a normal volume, "Volume Spike" are clearly visible, which play an important role in the analysis. However, the cumulative volume on a wave gives us much more information and shows exactly on which waves the biggest purchases or the biggest sales take place. As in the attached chart, we can see how buyers aggressively carried out the final accumulation action just before the range breakout. In the analysis of the Wyckoff method, cumulative volume is a key indicator to assess the strength or weakness of the market.
It works very similarly the other way around (distribution). Before the market changes direction after large increases, downward waves are characterized by very high volume, which is drawn on the histogram as ultra-high bars. This is information about the distribution carried out by the players - taking profits after increases or opening shorts.
Wyckoff Wave Volume for TradingView
Wyckoff Wave Volume is the best tool to identify turning points in all markets. Money plays in the market, not set ups. Therefore, in order to earn money, you must play in the same direction as the professionals! It is thanks to the observation of the volume that you can know which side the professionals (Smart Money) are on and trade in accordance with their direction. You can also "look" inside the chart and see on the numbers or graphical histogram who controls the market at a given moment - Buyer or the Seller.
Let's Start From The Beginning!
Wyckoff Wave Volume created by Richard Wyckoff in early 1930' were a breakthrough in technical analysis. In his famous technical analysis course, he told his students to "think like waves". Volume analysis was an integral part of his way of investing. During the period when Wyckoff was active in the financial markets wave volume was calculated manually, we now have a fully automated version for TradingView. Using Wyckoff Cumulative Volume you will be surprised how well it identifies turning points in all markets and on any time frame. This tool is very helpful in predicting trend changes in all markets like forex, crypto, futures and stocks.
In order for the indicator to work well on all charts, it is necessary to set the appropriate step in its settings.
"Step" is the wave setting to be taken into account when counting the volume on a given swing. The standard setting for each round is 30. This is the measure of pips on which the next upward or downward wave is to be counted. However, for individual assets, these settings can be adjusted individually.