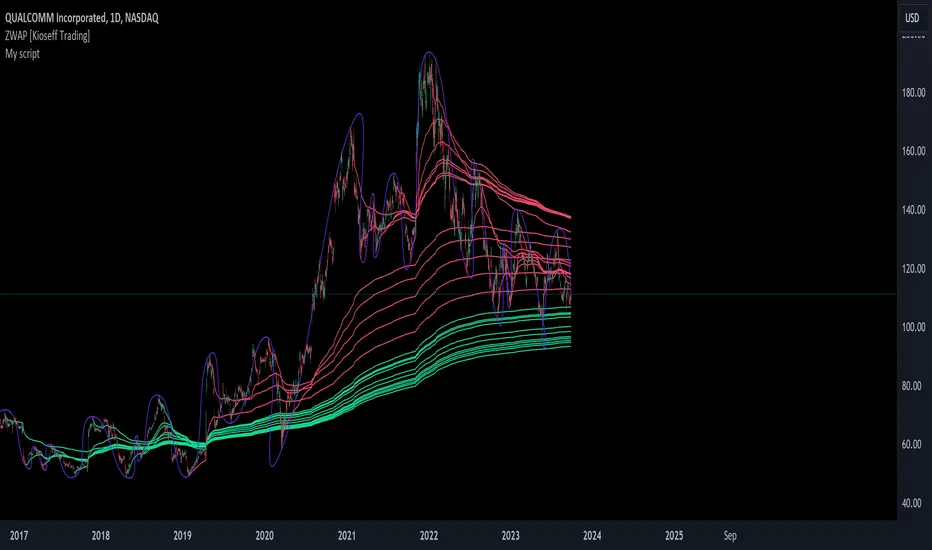
ZWAP (ZigZag Anchored VWAP) [Kioseff Trading]Hello!
Quick script showcasing the new polyline function for Pine Script!
Features
Up to 100 high/low pivot points auto anchored VWAP
Visible range auto anchored VWAP
Curved ZigZag (Adjustable!)
With the new polyline function, auto-anchored VWAP at specific price points is more viable.
When using line.new() only 500 lines can exist on the chart concurrently and, since VWAP is calculated on every update, a "proper" VWAP drawn using line.new() can extend 500 bars at most, to which no additional VWAP lines can be drawn after.
Of course, when using the plot() function a VWAP line will draw on every bar; however, this method isn't highly compatible with auto-anchoring VWAP lines.
However!
A polyline, from beginning to end irrespective of the number of coordinates used, constitutes 1 polyline; 100 can exist simultaneously with 10,000 xy coordinates per line.
The image above shows an attempt to draw the same auto-anchored VWAP lines using the line.new() function. Not an ideal outcome!
The image above shows the same attempt using the polyline.new() function!
Very nice (:
The image above shows the indicator auto anchoring to zig zag turning points.
Subsequent to a new anchoring, VWAP is calculated for the following bars - up to the current bar.
Thank you for checking this out; if you have any ideas to spice it up feel free to comment!
"vwap" için komut dosyalarını ara
Anchored VWAP+This indicator is an enhanced version of the Anchored VWAP indicator with additional functions:
1. Anchored AP (average price). It removes the volume weighting step in Anchored VWAP, and can display the average price over a period of time. For example, if the price of the stock in the last 3 days is 100, 200, 300, then AP is their average value of 200
2. Anchored AC (average cost). The average cost over time can be displayed. For example, if the price of the stock in the last 2 days is 100,300, then AC is (1+1)/(1/100+1/300)=150
When using the indicator, you need to choose a starting point, then the indicator will start to calculate the subsequent VWAP, AP and AC from this starting point, and draw 3 lines in the graph
These three lines can be regarded as the average cost line of the market, with potential support and resistance effects
We have filled the shadow between VWAP and AP, which can be regarded as a potential support resistance band
===========================中文版本===========================
该指标为增强版本的Anchored VWAP指标。在Anchored VWAP基础上增加了额外功能:
1. Anchored AP。其去掉了Anchored VWAP中成交量加权的步骤,可以显示一段时间的平均价格。举个例子,假如股票最近3天的价格为100,200,300,那么AP为他们的平均值200
2. Anchored AC。可以显示一段时间的平均成本。举个例子,假如股票最近2天的价格为100,300,那么AC为(1+1)/(1/100+1/300)=150
使用指标时你需要先选择一个起点,随后指标将会以该起点开始计算后续的VWAP、AP和AC,并且在图中绘制3根线
这3根线均可以视作是市场的平均成本线,具有潜在的支撑和阻力效果
我们让VWAP和AP之间填充了阴影,该阴影可以视作潜在的支撑阻力带

Volume Profile Free Pro (25 Levels Value Area VWAP) by RRBVolume Profile Free Pro by RagingRocketBull 2019
Version 1.0
All available Volume Profile Free Pro versions are listed below (They are very similar and I don't want to publish them as separate indicators):
ver 1.0: style columns implementation
ver 2.0: style histogram implementation
ver 3.0: style line implementation
This indicator calculates Volume Profile for a given range and shows it as a histogram consisting of 25 horizontal bars.
It can also show Point of Control (POC), Developing POC, Value Area/VWAP StdDev High/Low as dynamically moving levels.
Free accounts can't access Standard TradingView Volume Profile, hence this indicator.
There are 3 basic methods to calculate the Value Area for a session.
- original method developed by Steidlmayr (calculated around POC)
- classical method using StdDev (calculated around the mean VWAP)
- another method based on the mean absolute deviation (calculated around the median)
POC is a high volume node and can be used as support/resistance. But when far from the day's average price it may not be as good a trend filter as the other methods.
The 80% Rule: When the market opens above/below the Value Area and then returns/stays back inside for 2 consecutive 30min periods it has 80% chance of filling VA (like a gap).
There are several versions: Free, Free Pro, Free MAX. This is the Free Pro version. The Differences are listed below:
- Free: 30 levels, Buy/Sell/Total Volume Profile views, POC
- Free Pro: 25 levels, +Developing POC, Value Area/VWAP High/Low Levels, Above/Below Area Dimming
- Free MAX: 50 levels, packed to the limit
Features:
- Volume Profile with up to 25 levels (3 implementations)
- POC, Developing POC Levels
- Buy/Sell/Total/Side by Side View modes
- Side Cover
- Value Area, VAH/VAL dynamic levels
- VWAP High/Low dynamic levels with Source, Length, StdDev as params
- Show/Hide all levels
- Dim Non Value Area Zones
- Custom Range with Highlighting
- 3 Anchor points for Volume Profile
- Flip Levels Horizontally
- Adjustable width, offset and spacing of levels
- Custom Color for POC/VA/VWAP levels and Transparency for buy/sell levels
Usage:
- specify max_level/min_level for a range (required in ver 1.0/2.0, auto/optional in ver 3.0 = set to highest/lowest)
- select range (start_bar, range length), confirm with range highlighting
- select mode Value Area or VWAP to show corresponding levels.
- flip/select anchor point to position the buy/sell levels, adjust width and spacing as needed
- select Buy/Sell/Total/Side by Side view mode
- use POC/Developing POC/VA/VWAP High/Low as S/R levels. Usually daily values from 1-3 days back are used as levels for the current day.
- Green - buy volume of a specific price level in a range, Red - sell volume. Green + Red = Total volume of a price level in a range
There's no native support for vertical histograms in Pinescript (with price axis as base)
Basically, there are 4 ways to plot a series of horizontal bars stacked on top of each other:
1. plotshape style labeldown (ver 0 prototype discarded)
- you can have a set of fixed width/height text labels consisting of a series of underscores and moving dynamically as levels. Level offset controls visible length.
- you can move levels and scale the base width of the volume profile histogram dynamically
- you can calculate the highest/lowest range values automatically. max_level/min_level inputs are optional
- you can't fill the gaps between levels/adjust/extend width, height - this results in a half baked volume profile and looks ugly
- fixed text level height doesn't adjust and looks bad on a log scale
- fixed font width also doesn't scale and can't be properly aligned with bars when zooming
2. plot style columns + hist_base (ver 1.0)
- you can plot long horizontal bars using a series of small adjacent vertical columns with level offsets controlling visible length.
- you can't hide/move levels of the volume profile histogram dynamically on each bar, they must be plotted at all times regardless - you can't delete the history of a plot.
- you can't scale the base width of the volume profile histogram dynamically, can't set show_last from input, must use a preset fixed width for each level
- hist_base can only be a static const expression, can't be assigned highest/lowest range values automatically - you have to specify max_level/min_level manually from input
- you can't control spacing between columns - there's an equalizer bar effect when you zoom in, and solid bars when you zoom out
- using hist_base for levels results in ugly load/redraw times - give it 3-5 sec to finalize its shape after each UI param change
- level top can be properly aligned with another level's bottom producing a clean good looking histogram
- columns are properly aligned with bars automatically
3. plot style histogram + hist_base (ver 2.0)
- you can plot long horizontal bars using a series of small vertical bars (horizontal histogram) instead of columns.
- you can control the width of each histogram bar comprising a level (spacing/horiz density). Large enough width will cause bar overlapping and give level a "solid" look regardless of zoom
- you can only set width <= 4 in UI Style - custom textbox input is provided for larger values. You can set width and plot transparency from input
- this method still uses hist_base and inherits other limitations of ver 2.0
4. plot style lines (ver 3.0)
- you can also plot long horizontal bars using lines with level offsets controlling visible length.
- lines don't need hist_base - fast and smooth redraw times
- you can calculate the highest/lowest range values automatically. max_level/min_level inputs are optional
- level top can't be properly aligned with another level's bottom and have a proper spacing because line width uses its own units and doesn't scale
- fixed line width of a level (vertical thickness) doesn't scale and looks bad on log (level overlapping)
- you can only set width <= 4 in UI Style, a custom textbox input is provided for larger values. You can set width and plot transparency from input
Notes:
- hist_base for levels results in ugly load/redraw times - give it 3-5 sec to finalize its shape after each UI param change
- indicator is slow on TFs with long history 10000+ bars
- Volume Profile/Value Area are calculated for a given range and updated on each bar. Each level has a fixed width. Offsets control visible level parts. Side Cover hides the invisible parts.
- Custom Color for POC/VA/VWAP levels - UI Style color/transparency can only change shape's color and doesn't affect textcolor, hence this additional option
- Custom Widh for levels - UI Style supports only width <= 4, hence this additional option
- POC is visible in both modes. In VWAP mode Developing POC becomes VWAP, VA High and Low => VWAP High and Low correspondingly to minimize the number of plot outputs
- You can't change buy/sell level colors (only plot transparency) - this requires 2x plot outputs exceeding max 64 limit. That's why 2 additional plots are used to dim the non Value Area zones
- Use Side by Side view to compare buy and sell volumes between each other: base width = max(total_buy_vol, total_sell_vol)
- All buy/sell volume lengths are calculated as % of a fixed base width = 100 bars (100%). You can't set show_last from input
- Sell Offset is calculated relative to Buy Offset to stack/extend sell on top of buy. Buy Offset = Zero - Buy Length. Sell Offset = Buy Offset - Sell Length = Zero - Buy Length - Sell Length
- If you see "loop too long error" - change some values in UI and it will recalculate - no need to refresh the chart
- There's no such thing as buy/sell volume, there's just volume, but for the purposes of the Volume Profile method, assume: bull candle = buy volume, bear candle = sell volume
- Volume Profile Range is limited to 5000 bars for free accounts
P.S. Cantaloupia Will be Free!
Links on Volume Profile and Value Area calculation and usage:
www.tradingview.com
stockcharts.com
onlinelibrary.wiley.com

Volume weighted average price band strategy [Kevin-Patrick]VWAP Bands strategy, Credit
VWAP Machine Learning Bands is an advanced indicator designed to enhance trading analysis by integrating VWAP with a machine learning-inspired adaptive smoothing approach. This tool helps traders identify trend-based support and resistance zones, predict potential price movements, and generate dynamic trade signals.
Key Features
Adaptive ML VWAP Calculation: Uses a dynamically adjusted SMA-based VWAP model with volatility sensitivity for improved trend analysis.
Forecasting Mechanism: The 'Forecast' parameter shifts the ML output forward, providing predictive insights into potential price movements.
Volatility-Based Band Adjustments: The 'Sigma' parameter fine-tunes the impact of volatility on ML smoothing, adapting to market conditions.
Multi-Tier Standard Deviation Bands: Includes two levels of bands to define potential breakout or mean-reversion zones.
Dynamic Trend-Based Colouring: The VWAP and ML lines change colour based on their relative positions, visually indicating bullish and bearish conditions.
Custom Signal Detection Modes: Allows traders to choose between signals from Band 1, Band 2, or both, for more tailored trade setups.
+ Strategy setting by Kevin-Patrick

VWAP CATS background flipped 4.0VWAP CATS Background Flipped 4.0 is a sophisticated Pine Script v5 indicator for TradingView that combines a configurable moving average (MA) with dynamic Gann Square of 9 levels to create a multi-layered background shading system for price action analysis. It visualizes support/resistance zones around a central MA (often VWAP or RVWAP) using incremental offsets (either % or absolute points), generating symmetrical bands that resemble a "CATS" (Concentric Adaptive Tiered System) — hence the name.The background is "flipped" in the sense that shading intensity and structure emphasize higher-tier zones, and labels are placed to the right of the chart for future projection.Key FeaturesFeature
Description
Multi-MA Engine
Supports 20+ MA types: EMA, DEMA, TEMA, SMA, VWAP, RVWAP, HMA, ALMA, custom volume blends (CVB1–4)
RVWAP Mode
Rolling VWAP with adaptive or fixed time window (days/hours/minutes)
Gann Square of 9 Logic
Generates 80+ symmetric levels (0.25x to 17x increment) above/below the MA
Dual Increment Mode
Choose Percent or Points for spacing
Background Fills
Tiered transparency fills between Gann levels (darker = stronger zones)
Visual MA Offset
Shift MA line left/right without breaking fill alignment
Smart Labels
Projected labels on last bar: "FV", "normal", "high", "3/4" at key levels
Performance Optimized
Hidden plots + label cleanup to prevent lag
Primary Use Cases
1. Institutional VWAP Anchoring
Use RVWAP (1-day fixed) as maRaw
Set Increment = 0.5 points or 0.05%
Watch price interaction with "normal" (2x), "high" (4x), "3/4" (6x) zones
Ideal for intraday scalping on indices (ES, NQ) or forex
2. Swing Trading with Gann Projections
Use 400-period SMA/EMA on daily chart
Increment in Percent mode (~1.22%)
Identify confluence when price rejects at 2x, 4x, or 6x bands
Labels project future targets to the right
3. Volume-Weighted Mean Reversion
Select CVB1–CVB4 for heavy volume smoothing
Use Points mode for stocks with stable tick sizes (e.g. $0.50 increments)
Trade mean reversion between ±1x and ±2x bands
4. Risk Management & Stop Placement
Place stops beyond 2x or 4x bands
Take profits at next major tier (e.g. 4x → 6x)
Pro Tips
Enable "Use Fixed Time Period" for RVWAP to avoid session reset issues
Increase i_label_offset on lower timeframes to avoid overlap
Combine with volume profile or order flow for confluence
The "FV" label marks the Fair Value MA — core anchor
Summary"VWAP CATS Background Flipped 4.0" turns any moving average into a dynamic Gann-based pricing grid with intelligent background shading and forward-projected labels — perfect for institutional-style mean reversion, swing targeting, and risk-defined trading."

Order-Flow Proxy (VWAP Deviation Zones)Order-Flow Proxy (VWAP Deviation Zones) helps traders visualize when market price moves unusually far away from its Volume-Weighted Average Price (VWAP) — a key fair-value level used by institutional participants.
When price stretches too far above or below VWAP, it often signals temporary imbalance between buying and selling pressure.
This tool highlights those moments using simple color zones and an optional statistical Z-Score filter for deeper precision.
In short: it’s a clean, minimal mean-reversion indicator showing when price is statistically “too far” from fair value.
Red zone → Price extended above VWAP → possible buyer exhaustion or short setup.
Green zone → Price extended below VWAP → possible seller exhaustion or long setup.
VWAP line → Acts as a dynamic fair-value anchor.
Concept:
VWAP combines both price and traded volume to define where most transactions occurred.
Deviations from it — measured either by a fixed distance (1%) or by Z-Score — can reveal overvaluation or undervaluation zones used by professional traders for contrarian setups.
How to use:
Apply the indicator to any intraday chart (1m–1h recommended).
Watch for background color shifts — red or green.
Optionally enable the Z-Score filter to focus only on statistically extreme deviations.
Combine with volume spikes, liquidity sweeps, or your own order-flow tools for confirmation.
Tip:
Best used as a visual overlay for detecting stretched markets and potential reversals.

Trading Blueprint v7 Pro — VWAP-CVD, cPOC Trend MomentumTBv7 Pro is the advanced release of the Trading Blueprint framework — engineered for institutional-style intraday analysis that fuses VWAP location, CVD orderflow, composite profile bias, and momentum curvature into one cohesive system.
Core Framework
VWAP Structure → Adaptive mean anchored to session VWAP with ±1σ / ±2σ deviation envelopes for dynamic equilibrium detection.
vPOC per bar by ruckard ()
Anchored Volume Profile by DGT ()
CVD Orderflow Divergence → Smoothed delta histogram with fractal pivots identifying hidden absorption and exhaustion (patterns (Bull / Bear Div). Cumulative Volume Delta by AustrianTradingMachine )
cPOC Integration (2-Day Composite) by poopsnag (me :)→ Confirms true acceptance or rejection zones across sessions for precision bias alignment.
TMI (Trend Momentum Indicator by TradingRiot()) → Quantifies slope + mean crossover strength, providing actionable momentum confirmation (bullish / bearish support / divergence).
Bias Dashboard → Displays VWAP bias, numerical score, and dynamic color feedback for at-a-glance trade orientation.
Usage Context
Designed for professionals trading 15 m execution inside 1 h / 4 h context. Ideal for VWAP-cPOC location setups, reversion / continuation scalps, and orderflow confirmation using cumulative delta behavior.
🔧 Modules such as RSI / AO are pre-wired and easily activated for full Trading Blueprint confluence mapping.

ARSI – (VWAP & ATR) 3QKRAKThe ARSI Long & Short – Dynamic Risk Sizing (VWAP & ATR) indicator combines three core components—an adjusted RSI oscillator (ARSI), Volume‐Weighted Average Price (VWAP), and Average True Range (ATR)—so that entry/exit signals and position sizing are always tailored to current market conditions. ARSI, plotted from 0 to 100 with clearly marked overbought and oversold zones, is the primary signal driver: when ARSI falls below the lower threshold it indicates an excessive sell‐off and flags a long opportunity, whereas a break above the upper threshold signals overextended gains and foreshadows a short. A midpoint line at 50 can serve as an early exit or reduction signal when crossed against your position.
VWAP, showing the volume‐weighted average price over the chosen period, acts as a trend filter—long trades are only taken when price sits above VWAP, and shorts only when it’s below—ensuring each trade aligns with the prevailing market momentum. ATR measures current volatility and is used both to set safe stop‐loss levels and to dynamically size each position. In practice, this means positions automatically shrink in high‐volatility environments and grow in quieter markets, all while risking a fixed percentage of your capital.
Everything appears on a single chart: the ARSI pane below the price window with its reference levels; VWAP overlaid on the price; and the ATR‐based stop‐loss distances graphically displayed. Traders thus get a comprehensive, at-a-glance view of entries, exits, trend confirmation, and exactly how large a position they can safely take. The indicator runs in real time, removing the need for manual parameter calculations and letting you focus on strategic decision-making.

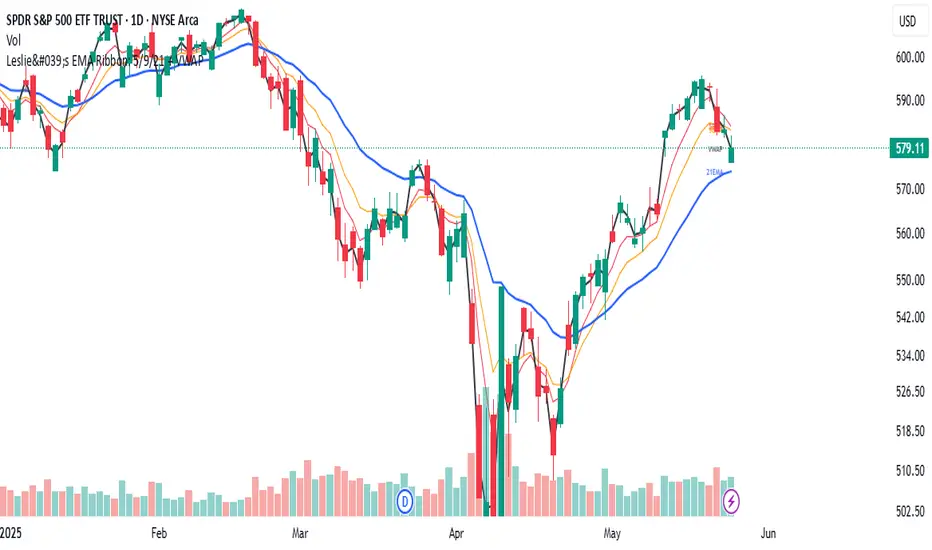
Leslie's EMA Ribbon: 5/9/21 + VWAPEMA + VWAP Crossover Indicator with Alerts
This script blends three Exponential Moving Averages (5, 9, 21) with VWAP to identify momentum shifts and volume-confirmed trend signals. It’s optimized for the Daily timeframe, but also adaptable to shorter-term trading.
🔍 Why this combination?
EMAs provide fast and reliable trend signals:
- 5/9 EMA crossover → short-term shifts (more frequent)
- 9/21 EMA crossover → swing confirmation (less noise)
- VWAP adds volume context used by institutions for fair value tracking.
- 9EMA crossing VWAP confirms price action supported by volume.
Together, these tools offer a multi-layered view of market momentum — combining speed, confirmation, and conviction.
⚙️ Features:
Clean plots with dynamic labels on latest bar
Adjustable line weights for clarity
Alerts included for all crossovers:
- 5EMA / 9EMA
- 9EMA / 21EMA
- 9EMA / VWAP
✅ How to Use:
- Best on the Daily timeframe
- Use 5/9 as early signals, 9/21 for trend filtering, and 9/VWAP for volume-backed setups
- Turn on alerts to stay informed of key shifts without staring at charts
Vwap Vision #WhiteRabbitVWAP Vision #WhiteRabbit
This Pine Script (version 5) script implements a comprehensive trading indicator called "VWAP Vision #WhiteRabbit," designed for analyzing price movements using the Volume-Weighted Average Price (VWAP) along with multiple customizable features, including adjustable color themes for better visual appeal.
Features:
Customizable Color Themes:
Choose from four distinct themes: Classic, Dark Mode, Fluo, and Phil, enhancing the visual layout to match user preferences.
VWAP Calculation:
Uses standard VWAP calculations based on selected anchor periods (Session, Week, Month, etc.) to help identify price trends.
Band Settings:
Multiple bands are calculated based on standard deviations or percentages, with customization options to configure buy/sell zones and liquidity levels.
Buy/Sell Signals:
Generates clear buy and sell signals based on price interactions with the calculated bands and the exponential moving average (EMA).
Real-time Data Display:
Displays real-time signals and VWAP values for selected trading instruments, including XAUUSD, NAS100, and BTCUSDT, along with related alerts for trading opportunities.
Volatility Analysis:
Incorporates volatility metrics using the Average True Range (ATR) to assess market conditions and inform trading decisions.
Enhanced Table Displays:
Provides tables for clear visualization of trading signals, real-time data, and performance metrics.
This script is perfect for traders looking to enhance their analysis and gain insights for making informed trading decisions across various market conditions.

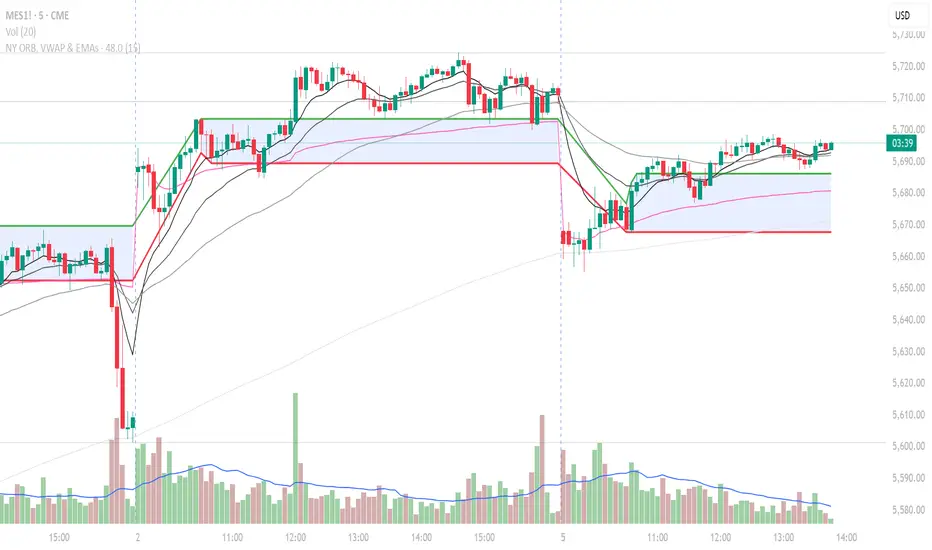
NY ORB, VWAP & EMAsIndicator is designed to display key technical analysis tools on your Trading View chart. It includes:
One of the key benefits of this indicator is that it allows Basic Trading View users to set VWAP, EMAs, and ORB in a single indicator. This is particularly useful for users who are limited to a single indicator on their Basic plan, as it provides a comprehensive view of market sentiment, trend, and potential breakouts without the need for multiple indicators.
Features
New York Opening Range Breakout (ORB): Plots the high and low of the first 15 minutes (configurable) of the New York trading session.
Volume Weighted Average Price (VWAP): Displays the VWAP line, which can be toggled on or off.
Exponential Moving Averages (EMAs): Plots four EMAs (9, 21, 50, and 200 periods), which can also be toggled on or off.
Customization
ORB Length: Choose from 5 or 15 minutes for the ORB calculation.
Show VWAP and EMAs: Toggle the visibility of the VWAP and EMA lines on or off.
Usage
This indicator is designed to help traders identify key market levels, trends, and potential breakouts during the New York trading session. The ORB can be used to gauge market sentiment, while the VWAP provides a benchmark for average price action. The EMAs offer additional trend analysis and can be used to identify potential support and resistance levels.
J Lines EMA + VWAPThe EMA + VWAP indicator combines the power of Exponential Moving Averages (EMA) with the Volume Weighted Average Price (VWAP) to help traders spot trends, identify potential entries/exits, and understand market momentum with ease. This dual-purpose tool is designed to give both beginner and experienced traders a clear view of price direction and volume influence, whether for day trading or swing trading.
Key Features:
Dynamic EMA Lines:
Six customizable moving averages (EMA by default) adapt to your selected timeframe. EMAs help track trend direction and strength, with various colors and opacity settings that visually separate them for clarity.
VWAP Tracking: A standalone VWAP line (blue) shows the average trading price adjusted for volume, making it ideal for pinpointing significant price levels where institutional interest often lies.
EMA Ribbons for Trend Confirmation: Soft-colored ribbons are placed between EMA pairs to make the trend strength visually apparent, with different color fills between lines. This makes it easy to gauge bullish or bearish conditions at a glance.
Flexible MA Options: Besides EMA, you can choose from SMA, WMA, HMA, and RMA, allowing you to adapt the indicator to various trading strategies.
This tool simplifies trend-following and volume-based analysis by giving you insight into both price momentum and market participation levels. EMAs adapt to volatility and changing market conditions, while the VWAP keeps you aware of critical price zones based on trading volume. Together, these help you stay on the right side of the market, avoid false breakouts, and make informed decisions on when to enter or exit trades.
Ideal for beginners due to its visual clarity and flexible enough for seasoned traders, EMA + VWAP is your go-to indicator for a structured approach to market trends.

Buy and Sell Alerts using VWAPThis is my first script, which I hope you'll enjoy.
The script generates alerts for buy and sell trades using VWAP and volume threshold that you select.
Indicators and Moving Averages :
This script allows you to choose which moving averages like VWAP, 9EMA, 10, 20, 50, 100, 200, and 325 SMAs you want to see on your chart.
Volume Threshold :
You can set a volume threshold, which is the minimum required volume required for buy and sell signals to be considered valid. (For example, I like 60,000 on SPY, 5 minute chart.)
Buy and Sell Signals :
The script checks if the stock prices crosses above or below the VWAP and if the trading volume is above the threshold you set.
If the price crosses above the VWAP and the volume is sufficient, a "Buy" signal is generated.
If the price crosses below the VWAP and the volume is sufficient, a "Sell" signal is generated.
This hopefully user-friendly indicator will alert you when certain conditions trading conditions are met, helping to make it a little easier to make informed trading decisions.

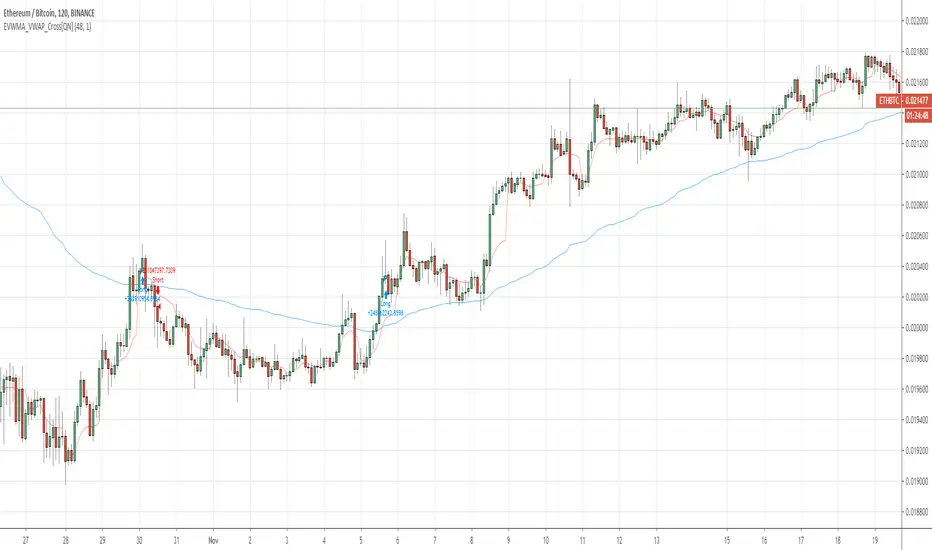
EVWMA VWAP Cross Strategy [QuantNomad]Continue to experiement with VWAP and EVWMA.
It seems that just simple crosses between VWAP and EVWMA can be pretty good signals. VWAP is a bit choppy so you can use VWAP smoothing input to smoth it a bit.
Here are few other strategies based on EVWMA:
EVWMA VWAP MACD Strategy
QuantNomad - EVWMA MACD Strategy
VWAP Z-Score Oscillator + Scaled TableVWAP Z-Score Oscillator + Scaled Table
This indicator calculates the Z-Score of the VWAP (Volume Weighted Average Price) based on your chosen source price and reset period (Session, Week, Month, Quarter, or Year).
The Z-Score represents how many standard deviations the current price is from the VWAP, visualized as an oscillator oscillating between ±3 sigma levels. The indicator also features three standard deviation bands for easy reference.
To enhance readability, a scaled Z-Score is displayed in a clean, minimalistic table on the top right of the indicator panel. This score is linearly capped between -2 and +2, mapping the raw Z-Score values with limits at ±3 sigma for clarity and quick assessment.
Use this tool to identify extreme deviations from the VWAP, which may signal potential reversals or continuation of price trends.

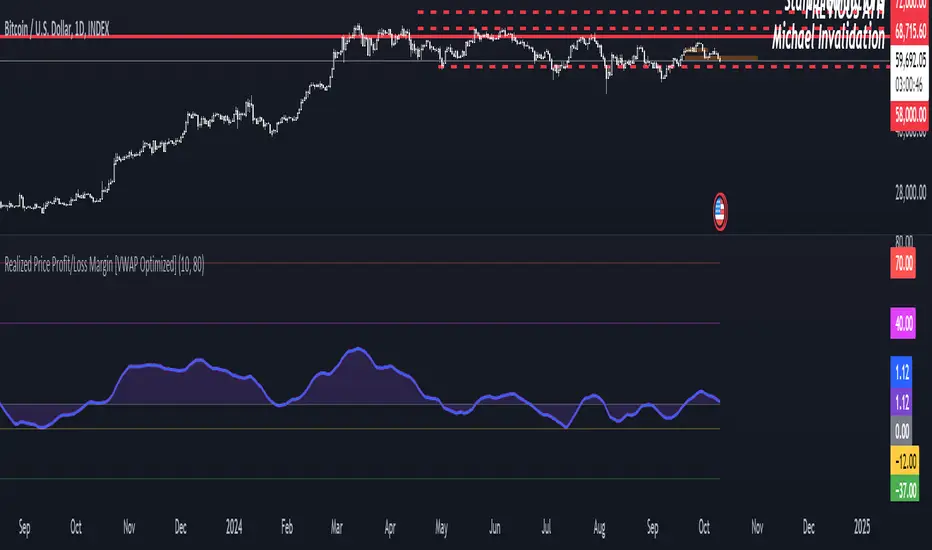
Realized Price Profit/Loss Margin [VWAP Optimized]Shaded Profit/Loss Margin Oscillator
The Shaded Profit/Loss Margin Oscillator is a powerful tool designed to measure Bitcoin’s Net Unrealized Profit/Loss (NUPL). This metric reflects the difference between Bitcoin’s current market price and its realized price, which approximates the price at which coins were last moved. By smoothing the NUPL using a moving average, the indicator provides a clean purple oscillator line that helps users easily gauge market sentiment. When the oscillator is above the zero line, the market is in profit, and when it is below zero, participants are generally in a state of unrealized loss. The shaded area between the oscillator and the zero line enhances visual clarity, making it easier to identify potential shifts in market behavior such as profit-taking or capitulation.
Unique Features and Added Value
What sets this indicator apart from traditional NUPL indicators is the use of a volume-weighted average price (VWAP) as a proxy for the realized price. Unlike the original on-chain NUPL metric, which relies on complex on-chain data, this indicator leverages VWAP to provide an approximation of realized price based solely on price and volume data available directly on TradingView. This method makes it highly accessible to traders who don’t have access to on-chain data platforms.
The use of VWAP not only simplifies the calculation but also provides additional value, as it incorporates volume into the realized price estimation. This volume-sensitive approach may offer a more responsive and dynamic reflection of realized prices compared to on-chain models, which can sometimes lag. In essence, this VWAP-based NUPL oscillator offers a unique edge in tracking profit/loss margins, particularly for traders who want a straightforward and efficient way to gauge sentiment without relying on external on-chain data sources. It brings the essence of NUPL into the world of technical analysis in an accessible and actionable way.
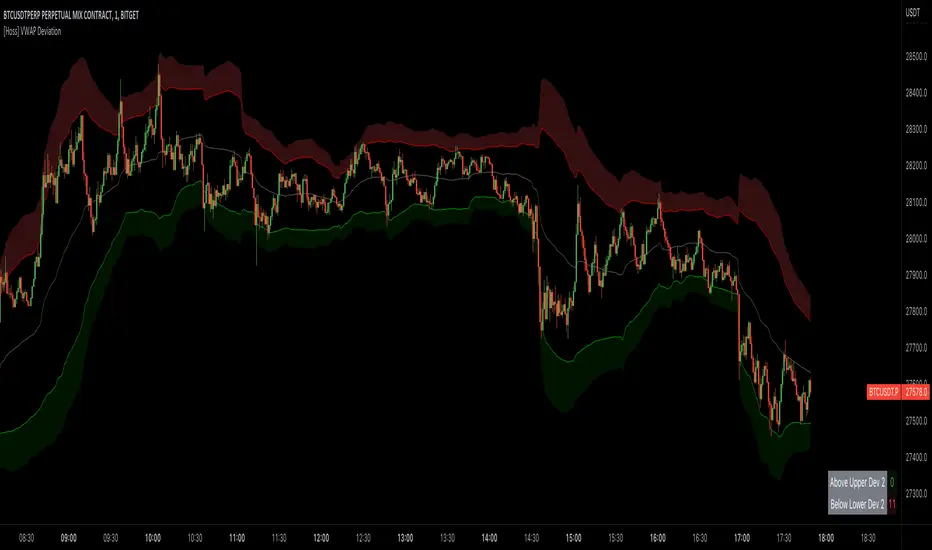
[Hoss] VWAP ADThe VWAP ( Volume Weighted Average Price ) Deviation script is a powerful tool designed for traders to analyze the relationship between price and volume . By calculating deviations around the VWAP , the script allows users to identify key support and resistance levels that can help in making better-informed trading decisions.
The script calculates VWAP based on the chosen data source (default is closing price) and then computes deviations above and below the VWAP using either the Average Deviation or the Standard Deviation method. The user can select the desired method through the script's input options. These deviations are then plotted as bands on the chart, providing a visual representation of the areas where the price may potentially revert or experience a breakout.
A unique and valuable feature of this script is the addition of a monitor that counts the number of times the price crosses above the Upper Deviation level 2 and below the Lower Deviation level 2 within a user-defined lookback period. This monitor is displayed as a table in the bottom right corner of the chart and can be enabled or disabled through an input option.
The cross count monitor serves as a valuable aid to traders by providing insights into the historical frequency of price crossing the deviation levels. This information can be used to identify potential trading opportunities based on historical price behavior around these levels.
BankNifty - VWAP + StdDev Bands- By Default the script draws Daily VWAP for Bank Nifty based on Futures Volume or underlying Index Stocks based on user input
- Optionally one may Anchor it to Week/Month etc or anchor it from a particular Time.
- It also draws 3 Standard Deviation Bands from the VWAP based on User Input.
- Optionally draws Previous VWAP Close for and Bullish or Bearish Move.
- It works with NIFTY 50 as well but only using Futures Volume(Pine limitation to number of security calls) . Please change the Symbol and Futures Volume symbol to "NSE:NIFTY" and "NSE:NIFTY1!" NSE:BANKNIFTY NSE:NIFTY

HYE Mean Reversion VWAPIndicator version of the strategy "HYE Mean Reversion VWAP"
"Long", "Short", "Exit Long" and "Exit Short" alarms added.
Use with "Once Per Bar Close".
*** I used the "VWAP with period" indicator code of @neolao. Special thanks to @neolao.
Indicator Link:

Ultimate VWAP Bands- Ultimate VWAP Bands is a script that helps to decide and further clarify areas of oversold and overbought conditions.
- For example, when the price is in the lowest band it is extremely oversold relative to the VWAP . Hence it should be considered a good place to buy with a high risk to reward payoff.
- Each band is set at a fixed offset away from the VWAP . The "VWAP Band Multiplier" adjusts this and is a key part of the script. This allows the indicator to be adjusted based on the assets volatility . For example, with Crypto. A multiplier of 1 would be strongly advised. Whilst a multiplier of 0.1-0.25 would be useful for currency pairs.
- This indicator can be used for all manners of trading. However, it is most effective when used for scalping and swing trading.

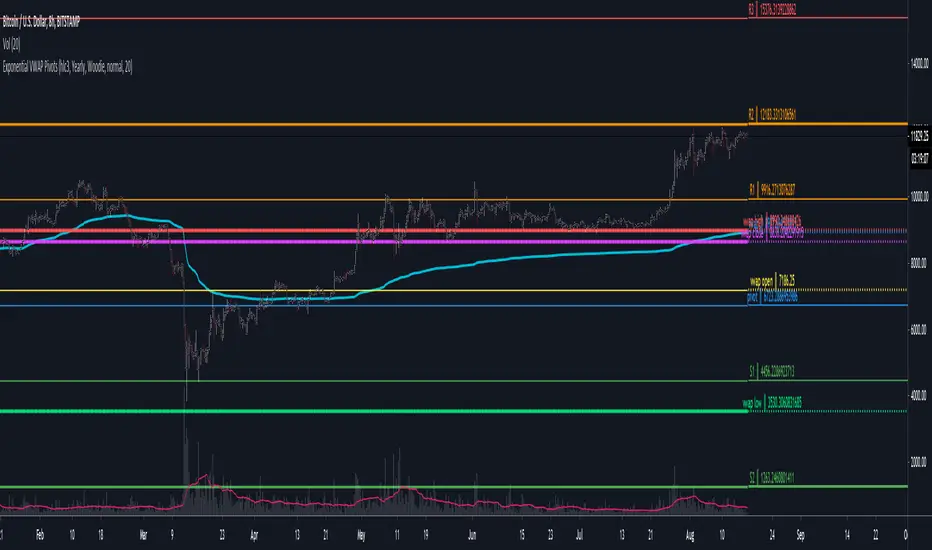
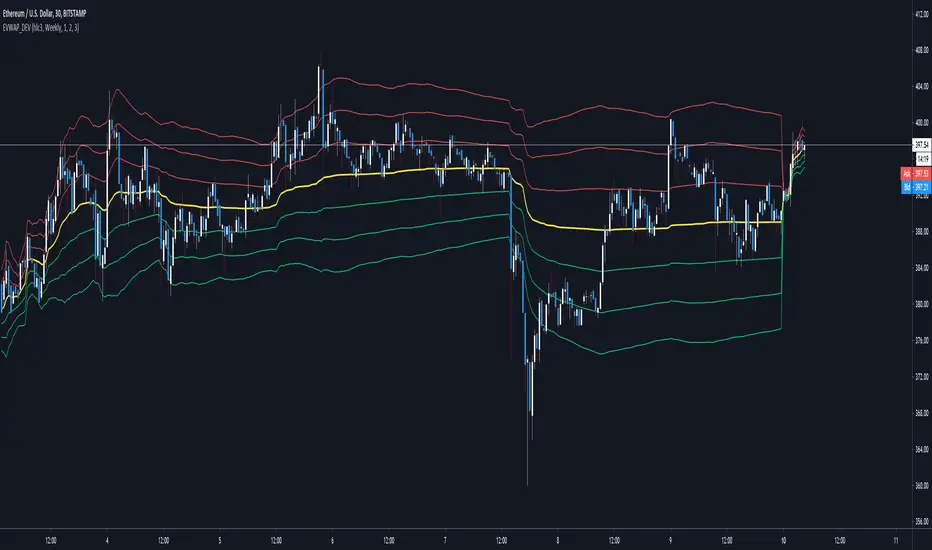
Exponential VWAP & DeviationsExponential Volume Weighted Average Price and Deviations.
Selectable intervals (daily/weekly/monthly/yearly vwap). Options to change deviation multipliers and display interval closing values for the previous interval.
Uses volume weighted EMA for the interval as the basis/vwap & exponential deviations calculated using the exponential vwap as the mean.
My VWAP Reversal + Pivot Points StandardThis indicator, with the addition of a standard VWAP indicator to the 5m chart, helps the operator when using a closing candle Price to initiate a VWAP Reversal strategy.
The strategy involves Price gapping up, look for a Close below the 1st 5m candle Low; else look for a Close above the 1st 5m candle High. On a break of VWAP, take the trade in the opposite direction of the gap, hence the VWAP Reversal. Not my own strat, credit to T3 Newsbeat, publicly posted on YouTube.
The Pivot Points Standard in the Pine 4 user manual, was the base source code, and leaving it here will allow me to remove the PP indicator I was using.
