GOLD Volume-Based Entry StrategyShort Description:
This script identifies potential long entries by detecting two consecutive bars with above-average volume and bullish price action. When these conditions are met, a trade is entered, and an optional profit target is set based on user input. This strategy can help highlight momentum-driven breakouts or trend continuations triggered by a surge in buying volume.
How It Works
Volume Moving Average
A simple moving average of volume (vol_ma) is calculated over a user-defined period (default: 20 bars). This helps us distinguish when volume is above or below recent averages.
Consecutive Green Volume Bars
First bar: Must be bullish (close > open) and have volume above the volume MA.
Second bar: Must also be bullish, with volume above the volume MA and higher than the first bar’s volume.
When these two bars appear in sequence, we interpret it as strong buying pressure that could drive price higher.
Entry & Profit Target
Upon detecting these two consecutive bullish bars, the script places a long entry.
A profit target is set at current price plus a user-defined fixed amount (default: 5 USD).
You can adjust this target, or you can add a stop-loss in the script to manage risk further.
Visual Cues
Buy Signal Marker appears on the chart when the second bar confirms the signal.
Green Volume Columns highlight the bars that fulfill the criteria, providing a quick visual confirmation of high-volume bullish bars.
Works fine on 1M-2M-5M-15M-30M. Do not use it on higher TF. Due the lack of historical data on lower TF, the backtest result is limited.
"volume" için komut dosyalarını ara

Price and Volume Breakout Buy Strategy [TradeDots]The "Price and Volume Breakout Buy Strategy" is a trading strategy designed to identify buying opportunities by detecting concurrent price and volume breakouts over a specified range of candlesticks.
This strategy is optimized for assets demonstrating high volatility and significant momentum spikes.
HOW IT WORKS
The strategy first takes the specific number of candlesticks as the examination window for both price and volume.
These values are used as benchmarks to identify breakout conditions.
A trade is initiated when both the closing price and the trading volume surpass the maximum values observed within the predetermined window.
Price must be above a designated moving average, serving as the trend indicator, ensuring that all trades align with the prevailing market trend.
APPLICATION
This strategy is particularly effective for highly volatile assets such as Bitcoin and Ethereum, capitalizing on the cues from sudden price and volume breakouts indicative of significant market movement, often driven by market smart money traders.
However, for broader markets like the S&P 500, this strategy may be less effective due to less pronounced volume and price shifts compared to the cryptocurrency markets.
DEFAULT SETUP
Commission: 0.01%
Initial Capital: $10,000
Equity per Trade: 70%
Backtest result sometimes gives fewer than 100 trades under certain higher timeframes, as most trades tend to have a long holding period. Entry conditions are also more stringent, which, combined with the relatively brief history of cryptocurrencies, results in fewer trades on longer timeframes.
Users are advised to adjust and personalize this trading strategy to better match their individual trading preferences and style.
RISK DISCLAIMER
Trading entails substantial risk, and most day traders incur losses. All content, tools, scripts, articles, and education provided by TradeDots serve purely informational and educational purposes. Past performances are not definitive predictors of future results.

Fine-Tune Inputs: Fourier Smoothed Hybrid Volume Spread AnalysisUse this Strategy to Fine-tune inputs for the HSHVSA Indicator.
Strategy allows you to fine-tune the indicator for 1 TimeFrame at a time; cross Timeframe Input fine-tuning is done manually after exporting the chart data.
I suggest using " Close all " input False when fine-tuning Inputs for 1 TimeFrame. When you export data to Excel/Numbers/GSheets I suggest using " Close all " input as True , except for the lowest TimeFrame.
MEANINGFUL DESCRIPTION:
The Fourier Smoothed Hybrid Volume Spread Analysis (FSHVSA) Strategy/Indicator is an innovative trading tool designed to fuse volume analysis with trend detection capabilities, offering traders a comprehensive view of market dynamics.
This Strategy/Indicator stands apart by integrating the principles of the Discrete Fourier Transform (DFT) and volume spread analysis, enhanced with a layer of Fourier smoothing to distill market noise and highlight trend directions with unprecedented clarity.
This smoothing process allows traders to discern the true underlying patterns in volume and price action, stripped of the distractions of short-term fluctuations and noise.
The core functionality of the FSHVSA revolves around the innovative combination of volume change analysis, spread determination (calculated from the open and close price difference), and the strategic use of the EMA (default 10) to fine-tune the analysis of spread by incorporating volume changes.
Trend direction is validated through a moving average (MA) of the histogram, which acts analogously to the Volume MA found in traditional volume indicators. This MA serves as a pivotal reference point, enabling traders to confidently engage with the market when the histogram's movement concurs with the trend direction, particularly when it crosses the Trend MA line, signalling optimal entry points.
It returns 0 when MA of the histogram and EMA of the Price Spread are not align.
WHAT IS FSHVSA INDICATOR:
The FSHVSA plots a positive trend when a positive Volume smoothed Spread and EMA of Volume smoothed price is above 0, and a negative when negative Volume smoothed Spread and EMA of Volume smoothed price is below 0. When this conditions are not met it plots 0.
HOW TO USE THE STRATEGY:
Here you fine-tune the inputs until you find a combination that works well on all Timeframes you will use when creating your Automated Trade Algorithmic Strategy. I suggest 4h, 12h, 1D, 2D, 3D, 4D, 5D, 6D, W and M.
ORIGINALITY & USEFULNESS:
The FSHVSA Strategy is unique because it applies DFT for data smoothing, effectively filtering out the minor fluctuations and leaving traders with a clear picture of the market's true movements. The DFT's ability to break down market signals into constituent frequencies offers a granular view of market dynamics, highlighting the amplitude and phase of each frequency component. This, combined with the strategic application of Ehler's Universal Oscillator principles via a histogram, furnishes traders with a nuanced understanding of market volatility and noise levels, thereby facilitating more informed trading decisions.
DETAILED DESCRIPTION:
My detailed description of the indicator and use cases which I find very valuable.
What is the meaning of price spread?
In finance, a spread refers to the difference between two prices, rates, or yields. One of the most common types is the bid-ask spread, which refers to the gap between the bid (from buyers) and the ask (from sellers) prices of a security or asset.
We are going to use Open-Close spread.
What is Volume spread analysis?
Volume spread analysis (VSA) is a method of technical analysis that compares the volume per candle, range spread, and closing price to determine price direction.
What does this mean?
We need to have a positive Volume Price Spread and a positive Moving average of Volume price spread for a positive trend. OR via versa a negative Volume Price Spread and a negative Moving average of Volume price spread for a negative trend.
What if we have a positive Volume Price Spread and a negative Moving average of Volume Price Spread?
It results in a neutral, not trending price action.
Thus the Indicator/Strategy returns 0 and Closes all long and short positions.
In the next Image you can see that trend is negative on 4h, we just move Negative on 12h and Positive on 1D. That means trend/Strategy flipped negative .
I am sorry, the chart is a bit messy. The idea is to use the indicator/strategy over more than 1 Timeframe.
Use this Strategy to fine-tune inputs for the HSHVSA Indicator.
(Strategy allows you to fine-tune the indicator for 1 TimeFrame at a time; cross Timeframe Input fine-tuning is done manually after exporting the chart data)
I suggest using " Close all " input False when fine-tuning Inputs for 1 TimeFrame. When you export data to Excel/Numbers/GSheets I suggest using " Close all " input as True , except for the lowest TimeFrame. I suggest using 100% equity as your default quantity for fine-tune purposes. I have to mention that 100% equity may lead to unrealistic backtesting results. Be avare. When backtesting for trading purposes use Contracts or USDT.

Ranged Volume DCA Strategy - R3c0nTraderUpdate: Republishing this as Public Open-Source script.
Credits:
Thank you "EvoCrypto" for granting me permission to use "Ranged Volume" to create this strategy.
Thank you "junyou0424" for granting me permission to use "DCA Bot with SuperTrend Emulator" which I used for adding bot inputs, calculations, and strategy
What does this do?
This script is mainly used for backtesting a Ranged Volume strategy to see how a 3Commas bot would perform.
I created this script out of necessity and I wanted a way to test a 3Commas DCA bot with a strategy based on “Volume.”
I came across "EvoCrypto’s" "Ranged Volume" study and strategy in TradingView and I liked it. I wanted to configure it so it can be used for DCA bot backtesting. I used parts from "junyou0424’s" "DCA Bot with SuperTrend Emulator" to add the following:
1. The Start Time and End Time
2. Price deviation to open safety orders (%)
3. Target Take Profit (%)
4. Trailing deviation
5. Base Order and Safety Order
6. Safety order volume scale
7. Safety order step scale
8. Max safety orders
In addition to the above, I also added chart indicators for "Take Profit" as well as "Safety Order"
Pre-requisites:
You can use this script without a 3Commas account and see how 3Commas DCA Bot and Ranged Volume strategy would perform vs. a non-DCA strategy. However, I highly recommend signing up for their free account and going through their training. This would give you a base understanding on the settings you will see in this strategy and why you will need to know them.
That said these are the pre-requisites I suggest you have:
1. Base Knowledge of 3Commas DCA bots
2. Base knowledge of settings such as “Max safety trades count”, “safety order volume scale” and “safety order step scale”. If these are alien to you, I suggest you read up on these.
3. Knowledge of setting up a Single-pair 3Commas bot for receiving custom TradingView signal.
4. A paper-bot to test your ideas. (Do not use a real money bot until you have tested it sufficiently with a paper-bot. You alone are responsible for your results!)
5. Add the study I created called "R3c0nTrader’s Ranged Volume Study” which adds a separate chart in its own pane showing the volume spikes. It will also generate the “buy” signals for your bot. NOTE: The study also has the same color scheme as this strategy and having the colors in both the strategy and the study will make things easier to see. If you use EvoCrypto’s Ranged Volume Study instead, just keep in mind that the colors won’t match, and you will have to manually match them.
6. Make your buy signals from your strategy are the same as in your study! To do this, use the same “Volume Range Length” you entered in the STRATEGY and enter that value for the “Volume Range Length” in the STUDY. Also ensure you have the same settings for “Heikin Ashi” (On or Off).
Comparisons of Ranged Volume Strategy vs Ranged Volume DCA Strategy
BTCUSD
Beware of Strategies that claim super high profits. This can easily be done by lowering the initial capital to something unrealistic. If I did that with this strategy and set the initial capital $100 and base order size to $100, I get a net profit of 2,864% which is not realistic.
How to Use
1. On the “Inputs” tab:
a. Set your Start and End Time to backtest against.
b. Set your “Volume Range Length” (number of bars to look back)
c. “Heikin Ashi Colors” – Usually I leave this enabled
d. “Show Bar Colors” – Leave enabled
e. “Show Break-Out” – Leave enabled
f. “Show Range” – Leave enabled
g. Set your other inputs which are those settings you would find in your 3Commas bot that you want to test (e.g., Price deviation to open safety orders, Target Take Profit, Base order, Safety order, etc.).
h. Quick Example for BTCUSD on 2hr chart:
i. Price deviation to open safety orders (%) = 6
ii. Target Take Profit (%) = 14
iii. Trailing deviation = 0
iv. Base order = 100
v. Safety order = 200
vi. Safety order volume scale = 2
vii. Safety order step scale = 1.4
viii. Max safety order = 5
2. On the “Properties” tab, set your initial capital, base currency, etc.
a. Initial capital – Default is 10,000 (Please use realistic values here. The amount here should be able to cover ALL your safety orders if they were triggered. Ideally, you should have funds left over and not use all trade capital.)
b. Base currency – Select your currency
c. Order Size - Not used. Use the “Inputs” tab to change your base order size.
d. Leave “Pyramiding” set to 999. This acts as a ceiling to the “Max safety orders” on the “Inputs” tab. It must always be higher than your “Max safety orders.” For example, if you set your “Max safety orders” to “4” and “Pyramiding” to “4” then it effectively means you have “3” “Max safety orders” and not “4” because it is counting each successive entry including the initial order.
e. “Commission” - Optional
f. “Verify price for limit orders” – Leave at zero. This does not change anything that I can tell.
g. Optional - Enter a value for “Commission”
h. Slippage – Optional. Slippage does not occur in backtesting but does occur in real trading but it can be simulated. Example use case for tracking performance of a real money bot: You enter the start date and time of your bot’s trade into this strategy and you notice some values are a little off due to slippage (average price, take profit, safety orders are not lining up) then you would go back here and increase the slippage until those lines up close enough with your actuals.
i. Margin for long positions – I don’t use this honestly.
j. Margin for short positions – I don’t use this honestly.
k. Recalculate “After order is filled” and “On every tick” – I don’t use this honestly.
3. “Style” tab
a. Ranged Volume Bar Coloring - You must disable bar coloring in any studies you added or this may not work properly
i. Color 0 – Default Yellow; appears when a volume breakout occurs
ii. Color 1 – Default Red; appears when a volume breakdown occurs
iii. Color 2 – Light Blue; appears when Close is higher than the Open
iv. Color 3 – Dark Blue; appears when the Close is lower than the Open
b. Take profit – Default Green; take profit line
c. Safety order – Default Light Blue; safety order line
d. No Safety Orders left – Default Red; when a trade runs out of safety orders, the line turns red and there is no safety orders left underneath to catch any further falling price movements.
e. Avg Position Price – Default Orange; your average position price for any given trade.
f. Take Profit Plot Area – Default Green; creates a highlighted area for your take profit
g. SO Plot Area – Default Light Blue; creates a highlighted area for your safety orders
h. Trades on chart – Show or hide your trades on the chart
i. Signal labels – Show or hide the trade signal labels on the chart
j. Quantity – Show or hide the trade quantity on the chart
Explanation of Chart lines and colors on chart

Combo Backtest 123 Reversal & Percentage Volume Oscillator (PVO) This is combo strategies for get a cumulative signal.
First strategy
This System was created from the Book "How I Tripled My Money In The
Futures Market" by Ulf Jensen, Page 183. This is reverse type of strategies.
The strategy buys at market, if close price is higher than the previous close
during 2 days and the meaning of 9-days Stochastic Slow Oscillator is lower than 50.
The strategy sells at market, if close price is lower than the previous close price
during 2 days and the meaning of 9-days Stochastic Fast Oscillator is higher than 50.
Second strategy
The Percentage Volume Oscillator (PVO) is a momentum oscillator for volume.
PVO measures the difference between two volume-based moving averages as a
percentage of the larger moving average. As with MACD and the Percentage Price
Oscillator (PPO), it is shown with a signal line, a histogram and a centerline.
PVO is positive when the shorter volume EMA is above the longer volume EMA and
negative when the shorter volume EMA is below. This indicator can be used to define
the ups and downs for volume, which can then be use to confirm or refute other signals.
Typically, a breakout or support break is validated when PVO is rising or positive.
WARNING:
- For purpose educate only
- This script to change bars colors.

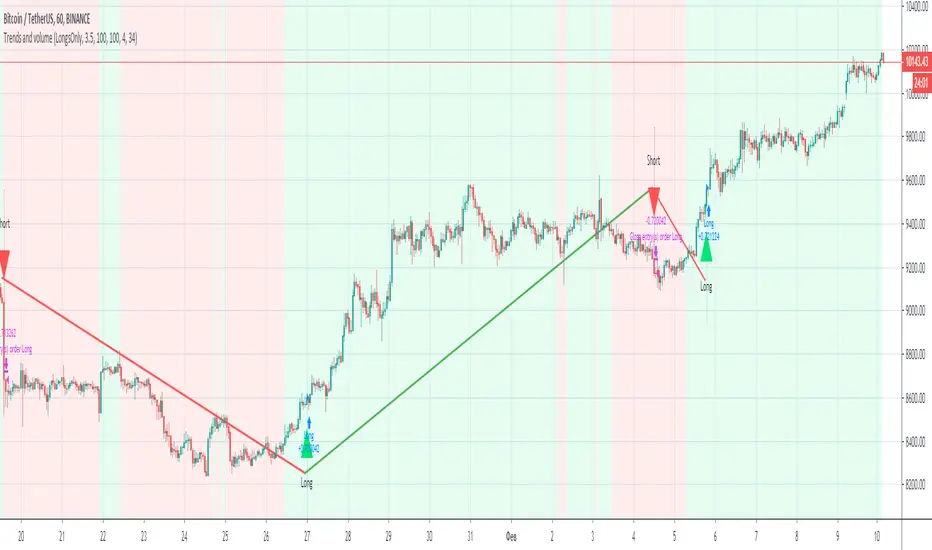
Trends and volume“Trends and volume” is a pair of ZigZag and Volume indicators. If in the ZigZag indicator a trend has changed from descending to ascending, and in the Volume indicator the volume of purchases (accumulation) exceeds the volume of sales (distribution), a signal to open a long position occurs.
Accordingly, the opening of a short position occurs with opposite indicators of trend and volume. The strategy has Volume smoothing settings and a ZigZag filter for selecting optimal settings on other instruments.
With default settings, the strategy allows you to make 2-4 successful trades per month, ideally shows the direction of the trades on the BINANCE:BTCUSDT , timeframe 1 hour.
Together with the “Trends and volume” backtest, you get the “Trends and volume alerts” indicator in which the alert function is built-in, you can set an alert for events: long entry and short entry.
Pay attention when you set alerts in the tradingview in the indicator, the true signal comes at the close of the hourly candle.
I can open demo access to the Trends and volume strategy for 15 days, for this write me.
Percentage Volume Oscillator (PVO) Backtest The Percentage Volume Oscillator (PVO) is a momentum oscillator for volume.
PVO measures the difference between two volume-based moving averages as a
percentage of the larger moving average. As with MACD and the Percentage Price
Oscillator (PPO), it is shown with a signal line, a histogram and a centerline.
PVO is positive when the shorter volume EMA is above the longer volume EMA and
negative when the shorter volume EMA is below. This indicator can be used to define
the ups and downs for volume, which can then be use to confirm or refute other signals.
Typically, a breakout or support break is validated when PVO is rising or positive.
You can change long to short in the Input Settings
WARNING:
- For purpose educate only
- This script to change bars colors.

Advance-Decline Volume Percent Backtest Advance-Decline Volume Percent (AD Volume Percent) is a breadth indicator
that measures the percentage of Net Advancing Volume for a particular group
of stocks, such as an index or ETF. Net Advancing Volume equals the volume
of advances less the volume of declines. AD Volume Percent equals Net Advancing
Volume divided by total volume for the group. AD Volume Percent fluctuates
between -100% and +100%.
You can change long to short in the Input Settings
Please, use it only for learning or paper trading. Do not for real trading

MACD Volume Strategy (BBO + MACD State, Reversal Type)Overview
MACD Volume Strategy (BBO + MACD State, Reversal Type) is a momentum-based reversal system that combines MACD crossover logic with volume filtering to enhance signal accuracy and minimize noise. It aims to identify structural trend shifts and manage risk using predefined parameters.
※This strategy is for educational and research purposes only. All results are based on historical simulations and do not guarantee future performance.
Strategy Objectives
Identify early trend transitions with high probability
Filter entries using volume dynamics to validate momentum
Maintain continuous exposure using a reversal-style model
Apply a consistent 1:1.5 risk-to-reward ratio per trade
Key Features
Integrated MACD and volume oscillator filtering
Zero repainting (all signals confirmed on closed candles)
Automatic position flipping for seamless direction shifts
Stop-loss and take-profit based on recent structural highs/lows
Trading Rules
Long Entry Conditions
MACD crosses above the zero line (BBO Buy arrow)
Volume oscillator is positive (short EMA > long EMA)
MACD is above the signal line
Close any existing short and enter a new long
Short Entry Conditions
MACD crosses below the zero line (BBO Sell arrow)
Volume oscillator is positive
MACD is below the signal line
Close any existing long and enter a new short
Exit Rules
Take Profit (TP) = Entry ± (risk distance × 1.5)
Stop Loss (SL) = Recent swing low (for long) or high (for short)
Early Exit = Triggered when a reversal signal appears (flip logic)
Risk Management Parameters
Pair: ETH/USD
Timeframe: 10-minute
Starting Capital: $3,000
Commission: 0.02%
Slippage: 2 pip
Risk per Trade: 5% of account equity (adjusted for sustainable practice)
Total Trades: 312 (backtest on selected dataset)
※Risk parameters are fully configurable and should be adjusted to suit each trader's personal setup and broker conditions.
Parameters & Configurations
Volume Short Length: 6
Volume Long Length: 12
MACD Fast Length: 11
MACD Slow Length: 21
Signal Smoothing: 10
Oscillator MA Type: SMA
Signal Line MA Type: SMA
Visual Support
Green arrow = Long entry
Red arrow = Short entry
MACD lines, signal line, and histogram
SL/TP markers plotted directly on the chart
Strategic Advantages & Uniqueness
Volume filtering eliminates low-participation, weak signals
Structurally aligned SL/TP based on recent market pivots
No repainting — decisions are made only on closed candles
Always in the market due to the reversal-style framework
Inspirations & Attribution
This strategy is inspired by the excellent work of:
Bitcoinblockchainonline – “BBO_Roxana_Signals MACD + vol”
Leveraging MACD zero-line cross and volume oscillator for intuitive signal generation.
HasanRifat – “MACD Fake Filter ”
Introduced a signal filter using MACD wave height averaging to reduce false positives.
This strategy builds upon those ideas to create a more automated, risk-aware, and technically adaptive system.
Summary
MACD Volume Strategy is a clean, logic-first automated trading system built for precision-seeking traders. It avoids discretionary bias and provides consistent signal logic under backtested historical conditions.
100% mechanical — no discretionary input required
Designed for high-confidence entries
Can be extended with filters, alerts, or trailing stops
※Strategy performance depends on market context. Past performance is not indicative of future results. Use with proper risk management and careful configuration.

BBPBΔ(OBV-PVT)BB - Time Series Decomposition & Volume WeightedThis is an indicator that shows 5 different points of information:
#1 The Trendline is uses a time-series decomposition to remove noise and seasonality data to provide a trendline without using moving averages. This is then further processed by a custom VWAP block that weights it based on the time frame you're currently using.
#2 BB%B - This is the blue histogram that's partially transparent. This is used to find when a security is overbought or oversold.
#3 BB%B of the Δ(OBV-PVT). This is the green histogram. We took the OBV and subtracted the PVT from it, then we found the delta of that compared to the previous candle. This output a line, which we wrapped in bollinger bands to find the BB%B of this line. This line is represented as a histogram, for visual clarity.
#4 Long and Short Indicators: Long is represented by a green dot, and short is represented by a red dot.
#5 Zones - there are multiple zones, which are used to identify overbought and oversold zones.
How to use the indicator:
Simple way: Long on green dot, Short on red dot. Use stop losses and take profits.
Slightly More Complex: Same as above, but also close out longs, when the green histogram drops but the blue does not. As this means price action hasn't caught up with volume. Use stop losses and take profits.
Full Usage: Long only when both the green, blue and yellow lines are below 0, and sell when the blue or green histogram rises above 1. Perform the opposite for the shorting. Ignore the dots if you use this method, they are for simple reference points til you get used to this indicator. Use stop losses and take profits.

Session Volume Profile Sniffer: HVN & Rejection ZonesA simple tool built for traders who rely on intraday volume structure.
What this script does
This script tracks volume distribution inside a selected session and highlights two key price levels:
High Volume Nodes (HVNs) — areas where price spent time building heavy participation.
Low Volume Nodes (LVNs) — thin zones where price moved quickly with very little interest.
Instead of plotting a full profile, this tool gives you the exact rejection-level lines you usually hunt manually.
Why these levels matter
HVN → price tends to react, stall, or flip direction
LVN → price often rejects strongly since liquidity is thin
Rejection patterns around these areas give clean entry signals
Positioning trades around HVN/LVN helps filter noise in choppy sessions
This script removes the trouble of drawing profiles, counting bins, or guessing node levels. Everything is calculated inside the session you choose.
How the detection works
Inside your session window, the script:
1. Tracks each tick-based price bucket
2. Accumulates raw volume for every bucket
Identifies:
HVNs = buckets with volume above a tier
LVNs = buckets with volume below a tier
3. Prints each level as a single clean line
4. Generates:
Long signal → bounce from LVN
Short signal → rejection from HVN
Built-in exits use ATR-based conditions for quick testing.
Features
Session-based volume mapping
HVN + LVN levels drawn automatically
Entry triggers based on rejection
ATR exits for experimental backtests
Clean, minimal visual output
Best use cases
Intraday futures
Index scalping
FX sessions (London / NY)
Crypto sessions (user-timed)
Anyone who trades around volume structure
Adjustable settings
Session window
Volume bin size
HVN multiplier
LVN multiplier
Enable/disable zone lines
This keeps it flexible enough for both scalpers and slow-paced intraday setups.
Important note
This script is built for study + idea testing.
It is not intended as a final system.
Once you identify how price behaves around these nodes, you can blend this tool into your own setup.

Velocity/Volatility/Volume StrategyThe "Vel/Vty/Vol Strategy" is a momentum-based trading approach designed to take advantage of strong price movements that are confirmed by both volatility and volume (if enabled). It provides a high level of customization, allowing traders to adjust various settings based on market conditions and individual preferences. By combining three critical indicators—velocity, volatility (measured through Bollinger Band Width), and an optional volume filter—the strategy generates trade signals for both long and short positions. Here’s a comprehensive explanation of how the strategy works, how the parameters can be customized, and how those adjustments benefit users.
At its core, the strategy focuses on velocity, which measures the speed at which price is changing over time. This is a key indicator of momentum, with a "StrongUp" signal indicating bullish momentum and a "StrongDown" signal suggesting bearish momentum. In addition to velocity, the strategy factors in acceleration, which helps gauge whether momentum is building or weakening. The second essential component is Bollinger Band Width (BBW), which measures volatility in the market. When the BBW expands, it signals increasing volatility, a condition that must be met in combination with a velocity signal to generate a trade. Lastly, the strategy includes an optional Volume Oscillator to filter trades. When this volume filter is enabled, trades will only be executed if there’s an increase in volume, further validating market activity.
The strategy generates long and short trade signals based on specific conditions. A long trade is triggered when there is a strong upward velocity, accompanied by an increase in Bollinger Band Width, indicating both momentum and heightened volatility. If the volume filter is toggled on, a rise in volume must also confirm the signal. Similarly, a short trade is initiated when a strong downward velocity is detected, again paired with an increase in volatility and, optionally, a volume rise. This ensures that trades occur during periods of heightened market activity, reducing the likelihood of false signals.
To help manage risk, the strategy includes several customizable tools. Users can set take profit levels to automatically close positions and lock in gains once a predefined profit percentage is reached. For example, if a 2% take profit is set, a long position will be closed once the price has risen by 2%. Additionally, a trailing take profit option can be enabled, allowing the strategy to dynamically adjust the take-profit target as the market moves in the user’s favor. This ensures that profits are locked in as long as the market continues to trend positively, while providing protection in case of a reversal. The strategy also includes a trailing stop-loss feature, which adjusts the stop price as the market moves in favor of the trade, helping to minimize losses and protect gains.
The strategy offers a variety of parameters that can be customized to suit different trading styles and market conditions. The velocity lookback period controls how far back the strategy looks to calculate velocity. A shorter lookback makes the strategy more sensitive to recent price changes, generating more signals, which can benefit day traders or those seeking to capture short-term price swings. Conversely, a longer lookback smooths out the velocity calculation, reducing false signals and making the strategy more suitable for traders seeking to capture larger trends. Similarly, the Bollinger Band Width (BBW) length can be adjusted to control how far back the strategy looks to calculate volatility. A shorter BBW length makes the strategy more sensitive to volatility spikes, useful in rapidly changing markets. In contrast, a longer BBW length filters out short-term noise and focuses on more sustainable volatility shifts, better suited for slower, more stable markets.
The volume filter is another powerful feature that can be toggled on or off. When turned on, the strategy will only execute trades if there is an increase in volume alongside velocity and volatility signals. This helps filter out false signals in low-volume markets, ensuring that price movements are supported by actual market activity. If the volume filter is turned off, the strategy focuses purely on price and volatility changes, which can be useful in markets where volume data is unreliable or less relevant.
The take profit percentage can be adjusted to define how aggressively or conservatively profits are locked in. A lower take profit percentage allows traders to capture smaller, quicker profits, which can be advantageous in volatile markets. A higher take profit percentage suits traders who prefer to capture larger moves, allowing them to stay in trades longer to benefit from extended trends. Similarly, the trailing take profit percentage determines how tightly the strategy follows market prices as they move in favor of the trade. A tighter trailing percentage ensures that profits are locked in quickly, while a wider trailing percentage gives trades more room to run, ideal for capturing large trends.
The stop loss percentage is another key setting that controls how much risk a trader is willing to take before the position is closed. A tighter stop loss minimizes losses but may result in more frequent stop-outs, particularly in volatile markets. A wider stop loss provides more room for trades to develop, which is useful for traders aiming to capture longer trends despite short-term fluctuations. Additionally, the velocity thresholds can be adjusted to set how sensitive the strategy is to price movements. Lower thresholds increase sensitivity, generating more signals in fast-moving markets, while higher thresholds filter out weaker signals, focusing on larger momentum shifts.
The strategy also allows users to define a time range during which it is active, offering flexibility in backtesting and optimizing for specific market conditions. By limiting the strategy to certain periods, users can tailor it to seasonal trends or historical data that matches their current trading environment.
The flexibility of this strategy makes it suitable for a wide range of traders. Day traders can benefit from adjusting the velocity and BBW lookback periods, tightening take profit and stop loss settings to capture short, fast price movements in highly volatile markets. Trend traders can lengthen the lookback periods and widen the velocity thresholds to capture larger, sustained moves while riding out short-term volatility. Traders with a lower risk tolerance can enable the volume filter and tighten stop losses to reduce false signals and minimize losses. On the other hand, aggressive traders can widen the take profit and trailing stop percentages to allow trades to develop fully, maximizing potential gains in trending markets.
Price-Volume w Trendline - Strategy [presentTrading]█ Introduction and How it is Different
The Price-Volume with Trendline Strategy is an innovative strategy that combines volume profile analysis, price-based Z-scores, and dynamic trendline filtering to identify optimal entry and exit points in the market. What sets this strategy apart is the integration of volume concentration (Point of Control or PoC) with dynamic volatility thresholds. Additionally, this strategy introduces a multi-step take profit (TP) mechanism that adjusts based on predefined levels, allowing traders to exit trades progressively while capitalizing on market momentum.
BTCUSD 6hr LS Performance
█ Strategy, How it Works: Detailed Explanation
The combination of multiple indicators and methodologies serves to create a more robust and reliable trading system. Each element is carefully chosen for its complementary role in providing accurate signals while minimizing false entries and exits. Here’s why the different components were chosen and how they work together:
- PoC and Z-Scores: The volume profile identifies key price areas, while the Z-score measures deviations from the mean. Together, they highlight points where the market is likely to react. For example, when the Z-score indicates an oversold condition near a PoC support level, it increases the probability of a reversal, providing a clear entry signal.
- Trendlines and Z-Scores: Trendlines serve as a secondary filter to ensure that price deviations identified by Z-scores align with broader market trends. This ensures that trades are only entered when the price has both deviated from its average and broken through a significant trendline level, reducing the likelihood of false signals.
- Multi-Step TP and Risk Management: Finally, the multi-step take profit logic works in tandem with the entry signals generated by the PoC, Z-scores, and trendlines. As the price moves in favor of the trade, profits are gradually locked in, ensuring the trader captures gains while still leaving room for further upside.
🔶 Point of Control (PoC) and Volume Profile Analysis
The PoC identifies the price level with the highest volume concentration within a specified lookback period. This price level represents where the most trading activity has occurred, often acting as a strong support or resistance. By breaking down the range into several rows (bins), the strategy identifies how much volume was traded at each price level.
🔶 Z-Score Calculation
The Z-score is a statistical metric that measures how far the current price is from its mean, expressed in terms of standard deviations. This is calculated both for price deviation and PoC-based deviation.
🔶 Trendline Breakout Filtering
The trendline filtering is a crucial aspect that refines entry signals by confirming trend continuation or reversals. It calculates trendlines based on pivot highs and lows using the selected method (e.g., ATR or standard deviation).
🔶 Multi-Step Take Profit
The multi-step take profit mechanism allows the strategy to take partial profits at several predefined levels. For example, when the price reaches 3%, 8%, 14%, or 21% above (or below) the entry price, it exits portions of the position. This is a useful technique for locking in profits as the market moves favorably.
Local
█ Usage
The Price-Volume with Trendline Strategy can be applied to various asset classes, including stocks, cryptocurrencies, and commodities. It is particularly effective in volatile markets where price deviations and volume concentrations signal potential reversals or trend continuations. By adjusting the settings for volatility and the lookback period, this strategy can be tailored to both short-term intraday trades and longer-term swing trades.
█ Default Settings
The default settings in the strategy play a vital role in shaping its performance.
- POC_lookbackLength (144): This defines the number of bars used to calculate the PoC. A longer lookback captures more data, leading to a more stable PoC, but may result in delayed signals. A shorter lookback increases responsiveness but may introduce noise.
- priceDeviationLength (200): This determines the period for calculating the standard deviation of price. A higher length smooths out the volatility, reducing the likelihood of false signals. Shorter lengths make the strategy more sensitive to sudden price movements.
- TL_length (14): Controls the swing detection period for trendline calculation. A shorter length will generate more frequent trendline breakouts, while a longer length captures only significant moves.
- Stop Loss and Take Profit: The strategy offers both fixed and SuperTrend-based stop losses. SuperTrend is adaptive to volatility, while fixed stop losses provide simpler risk control. The multi-step take profit ensures that profits are secured progressively, which can improve performance in trending markets by reducing the risk of full reversals.
Each of these settings can significantly affect the strategy’s risk-reward balance. For instance, increasing the stop loss level or the take profit percentages allows the strategy to stay in trades longer, potentially increasing profit per trade but at the cost of larger drawdowns. Conversely, tighter stops and smaller profit targets result in more frequent trades with lower average profit per trade.

Gann + Laplace Smoothed Hybrid Volume Spread AnalysisThe Gann + Laplace Smoothed Hybrid Volume Spread Analysis ( GannLSHVSA ) Strategy/Indicator is an trading tool designed to fuse volume analysis with trend detection, offering traders a view of market dynamics.
This Strategy/Indicator stands apart by integrating the principles of the upgraded Discrete Fourier Transform (DFT), the Laplace Stieltjes Transform and volume spread analysis, enhanced with a layer of Fourier smoothing to distill market noise and highlight trend directions with unprecedented clarity.
The length of EMA and Strategy Entries are modified with the Gann swings .
This smoothing process allows traders to discern the true underlying patterns in volume and price action, stripped of the distractions of short-term fluctuations and noise.
The core functionality of the GannLSHVSA revolves around the innovative combination of volume change analysis, spread determination (calculated from the open and close price difference), and the strategic use of the EMA (default 10) to fine-tune the analysis of spread by incorporating volume changes.
Trend direction is validated through a moving average (MA) of the histogram, which acts analogously to the Volume MA found in traditional volume indicators. This MA serves as a pivotal reference point, enabling traders to confidently engage with the market when the histogram's movement concurs with the trend direction, particularly when it crosses the Trend MA line, signalling optimal entry points.
It returns 0 when MA of the histogram and EMA of the Price Spread are not align.
WHAT IS GannLSHVSA INDICATOR:
The GannLSHVSA plots a positive trend when a positive Volume smoothed Spread and EMA of Volume smoothed price is above 0, and a negative when negative Volume smoothed Spread and EMA of Volume smoothed price is below 0. When this conditions are not met it plots 0.
HOW TO USE THE STRATEGY:
Here you fine-tune the inputs until you find a combination that works well on all Timeframes you will use when creating your Automated Trade Algorithmic Strategy. I suggest 4h, 12h, 1D, 2D, 3D, 4D, 5D, 6D, W and M.
ORIGINALITY & USEFULNESS:
The GannLSHVSA Strategy is unique because it applies upgraded DFT, the Laplace Stieltjes Transform for data smoothing, effectively filtering out the minor fluctuations and leaving traders with a clear picture of the market's true movements. The DFT's ability to break down market signals into constituent frequencies offers a granular view of market dynamics, highlighting the amplitude and phase of each frequency component. This, combined with the strategic application of Ehler's Universal Oscillator principles via a histogram, furnishes traders with a nuanced understanding of market volatility and noise levels, thereby facilitating more informed trading decisions. The Gann swing strategy is developed by meomeo105, this Gann high and low algorithm forms the basis of the EMA modification.
DETAILED DESCRIPTION:
My detailed description of the indicator and use cases which I find very valuable.
What is the meaning of price spread?
In finance, a spread refers to the difference between two prices, rates, or yields. One of the most common types is the bid-ask spread, which refers to the gap between the bid (from buyers) and the ask (from sellers) prices of a security or asset.
We are going to use Open-Close spread.
What is Volume spread analysis?
Volume spread analysis (VSA) is a method of technical analysis that compares the volume per candle, range spread, and closing price to determine price direction.
What does this mean?
We need to have a positive Volume Price Spread and a positive Moving average of Volume price spread for a positive trend. OR via versa a negative Volume Price Spread and a negative Moving average of Volume price spread for a negative trend.
What if we have a positive Volume Price Spread and a negative Moving average of Volume Price Spread?
It results in a neutral, not trending price action.
Thus the Indicator/Strategy returns 0 and Closes all long and short positions.
I suggest using "Close all" input False when fine-tuning Inputs for 1 TimeFrame. When you export data to Excel/Numbers/GSheets I suggest using "Close all" input as True, except for the lowest TimeFrame. I suggest using 100% equity as your default quantity for fine-tune purposes. I have to mention that 100% equity may lead to unrealistic backtesting results. Be avare. When backtesting for trading purposes use Contracts or USDT.

Fine-tune Inputs: Gann + Laplace Smooth Volume Zone OscillatorUse this Strategy to Fine-tune inputs for the GannLSVZ0 Indicator.
Strategy allows you to fine-tune the indicator for 1 TimeFrame at a time; cross Timeframe Input fine-tuning is done manually after exporting the chart data.
I suggest using "Close all" input False when fine-tuning Inputs for 1 TimeFrame. When you export data to Excel/Numbers/GSheets I suggest using "Close all" input as True, except for the lowest TimeFrame.
MEANINGFUL DESCRIPTION:
The Volume Zone oscillator breaks up volume activity into positive and negative categories. It is positive when the current closing price is greater than the prior closing price and negative when it's lower than the prior closing price. The resulting curve plots through relative percentage levels that yield a series of buy and sell signals, depending on level and indicator direction.
The Gann Laplace Smoothed Volume Zone Oscillator GannLSVZO is a refined version of the Volume Zone Oscillator, enhanced by the implementation of the upgraded Discrete Fourier Transform, the Laplace Stieltjes Transform. Its primary function is to streamline price data and diminish market noise, thus offering a clearer and more precise reflection of price trends.
By combining the Laplace with Gann Swing Entries and with Ehler's white noise histogram, users gain a comprehensive perspective on volume-related market conditions.
HOW TO USE THE INDICATOR:
The default period is 2 but can be adjusted after backtesting. (I suggest 5 VZO length and NoiceR max length 8 as-well)
The VZO points to a positive trend when it is rising above the 0% level, and a negative trend when it is falling below the 0% level. 0% level can be adjusted in setting by adjusting VzoDifference. Oscillations rising below 0% level or falling above 0% level result in a natural trend.
HOW TO USE THE STRATEGY:
Here you fine-tune the inputs until you find a combination that works well on all Timeframes you will use when creating your Automated Trade Algorithmic Strategy. I suggest 4h, 12h, 1D, 2D, 3D, 4D, 5D, 6D, W and M.
When Indicator/Strategy returns 0 or natural trend, Strategy Closes All it's positions.
ORIGINALITY & USFULLNESS:
Personal combination of Gann swings and Laplace Stieltjes Transform of a price which results in less noise Volume Zone Oscillator.
The Laplace Stieltjes Transform is a mathematical technique that transforms discrete data from the time domain into its corresponding representation in the frequency domain. This process involves breaking down a signal into its individual frequency components, thereby exposing the amplitude and phase characteristics inherent in each frequency element.
This indicator utilizes the concept of Ehler's Universal Oscillator and displays a histogram, offering critical insights into the prevailing levels of market noise. The Ehler's Universal Oscillator is grounded in a statistical model that captures the erratic and unpredictable nature of market movements. Through the application of this principle, the histogram aids traders in pinpointing times when market volatility is either rising or subsiding.
The Gann swing strategy is developed by meomeo105, this Gann high and low algorithm forms the basis of the EMA modification.
DETAILED DESCRIPTION:
My detailed description of the indicator and use cases which I find very valuable.
What is oscillator?
Oscillators are chart indicators that can assist a trader in determining overbought or oversold conditions in ranging (non-trending) markets.
What is volume zone oscillator?
Price Zone Oscillator measures if the most recent closing price is above or below the preceding closing price.
Volume Zone Oscillator is Volume multiplied by the 1 or -1 depending on the difference of the preceding 2 close prices and smoothed with Exponential moving Average.
What does this mean?
If the VZO is above 0 and VZO is rising. We have a bullish trend. Most likely.
If the VZO is below 0 and VZO is falling. We have a bearish trend. Most likely.
Rising means that VZO on close is higher than the previous day.
Falling means that VZO on close is lower than the previous day.
What if VZO is falling above 0 line?
It means we have a high probability of a bearish trend.
Thus the indicator returns 0 and Strategy closes all it's positions when falling above 0 (or rising bellow 0) and we combine higher and lower timeframes to gauge the trend.
What is approximation and smoothing?
They are mathematical concepts for making a discrete set of numbers a
continuous curved line.
Laplace Stieltjes Transform approximation of a close price are taken from aprox library.
Key Features:
You can tailor the Indicator/Strategy to your preferences with adjustable parameters such as VZO length, noise reduction settings, and smoothing length.
Volume Zone Oscillator (VZO) shows market sentiment with the VZO, enhanced with Exponential Moving Average (EMA) smoothing for clearer trend identification.
Noise Reduction leverages Euler's White noise capabilities for effective noise reduction in the VZO, providing a cleaner and more accurate representation of market dynamics.
Choose between the traditional Fast Laplace Stieltjes Transform (FLT) and the innovative Double Discrete Fourier Transform (DTF32) soothed price series to suit your analytical needs.
Use dynamic calculation of Laplace coefficient or the static one. You may modify those inputs and Strategy entries with Gann swings.
I suggest using "Close all" input False when fine-tuning Inputs for 1 TimeFrame. When you export data to Excel/Numbers/GSheets I suggest using "Close all" input as True, except for the lowest TimeFrame. I suggest using 100% equity as your default quantity for fine-tune purposes. I have to mention that 100% equity may lead to unrealistic backtesting results. Be avare. When backtesting for trading purposes use Contracts or USDT.

TASC 2024.08 Volume Confirmation For A Trend System█ OVERVIEW
This script demonstrates the use of volume data to validate price movements based on the techniques Buff Pelz Dormeier discusses in his "Volume Confirmation For A Trend System" article from the August 2024 edition of TASC's Traders' Tips . It presents a trend-following system implementation that utilizes a combination of three indicators: the Average Directional Index (ADX), the Trend Thrust Indicator (TTI), and the Volume Price Confirmation Indicator (VPCI).
█ CONCEPTS
In his article, Buff Pelz Dormeier recounts his search for an optimal trend-following strategy enhanced with volume data, starting with a simple system combining the ADX , MACD , and OBV indicators. Even in these early tests, the author observed that the volume confirmation from OBV notably improved trading performance. Subsequently, the author replaced OBV with his VPCI, which considers the proportional weights of volume and price, to enhance the validation of trend momentum. Lastly, the author explored the inclusion of his TTI, a modified MACD that features volume-based enhancements, as a strategy component for improved trend-following performance.
According to the author's research, the ADX+TTI+VPCI system outperformed similar strategies he tested in the article, yielding significantly higher returns and enhanced perceived reliability. Because the system's design revolves around catching pronounced trends, it performs best with a portfolio of individual stocks. The author applies the system in the article by allocating 5% of the equity to long positions in S&P 500 components that meet the ADX+TTI+VPCI entry criteria (see the Calculations section below for details). He uses the proceeds from closing positions to enter new positions in other stocks meeting the screening criteria, holding any excess proceeds in cash.
█ CALCULATIONS
The TTI is similar to the MACD. Its calculation entails the following steps:
Calculate fast (short-term) and slow (long-term) volume-weighted moving averages (VWMAs).
Compute the volume multiple (VM) as the square of the ratio of the fast VWMA to the slow VWMA.
Adjust these averages by multiplying the fast VWMA by the VM and dividing the slow VWMA by the VM.
Calculate the difference between the adjusted VWMAs to determine the TTI value, and take the average of that series to determine the signal line value.
The VPCI utilizes differences and ratios between VWMAs and corresponding simple moving averages (SMAs) to provide an alternative volume-price confirmation tool. Its calculation is as follows:
Subtract the slow SMA from the VWMA of the same length to calculate the volume-price confirmation/contradiction (VPC) value.
Divide the fast VWMA by the corresponding fast SMA to determine the volume-price ratio (VPR).
Divide the short-term VWMA by the long-term VWMA to calculate the VM.
Compute the VPCI as the product of the VPC, VPR, and VM values.
The long entry criteria of the ADX+TTI+VPCI system are as follows:
The ADX is above 30.
The TTI crosses above its signal line.
The VPCI is above 0, confirming the trend.
Signals to close positions occur when the VPCI is below 0, indicating a contradiction .
NOTE: Unlike in the article, this script applies the ADX+TTI+VPCI system to one stock at a time , not a portfolio of S&P 500 constituents.
█ DISCLAIMER
This strategy script educates users on the trading system outlined by the TASC article. By default, it uses 10% of equity as the order size and a slippage amount of 5 ticks. Traders should adjust these settings and the commission amount when using this script.

Price-Volume Dynamic - Strategy [presentTrading]█ Introduction and How it is Different
The "Price-Volume Dynamic - Strategy" leverages a unique blend of price action, volume analysis, and statistical z-scores to establish trading positions. This approach differentiates itself by integrating the concept of the Point of Control (POC) from volume profile analysis with price-based z-score indicators to create a dynamic trading strategy. It tailors entry and exit thresholds based on current market volatility, providing a responsive and adaptive trading method. This strategy stands out by considering both historical volatility and price trends to adjust trading decisions in real-time, enhancing its effectiveness in various market conditions.
BTCUSD 4h LS Performance
█ Strategy: How It Works – Detailed Explanation
🔶 Calculating Point of Control (POC)
The Point of Control (POC) represents the price level with the highest traded volume over a specified lookback period. It's calculated by dividing the price range into a number of rows, each representing a price level. The volume at each price level is tallied and the level with the maximum volume is designated as the POC.
🔶 Dynamic Thresholds Adjustments
The entry and exit thresholds are dynamically adjusted based on normalized volatility, which is derived from the current, minimum, and maximum ATR over a specified period. This normalization ensures that the thresholds adapt to changes in market conditions, making the strategy sensitive to shifts in market volatility.
BTCUSD local performance
█ Trade Direction
The strategy can be configured to trade in three different directions: Long, Short, or Both. This flexibility allows traders to align their trading strategy with their market outlook or risk preferences. By adjusting the `POC_tradeDirection` input, traders can selectively participate in market movements that match their trading style and objectives.
█ Usage
To deploy this strategy, traders should apply it within a trading software that supports scripting and backtesting, such as TradingView's Pine Script environment. Users can input their parameters based on their analysis of the market conditions and their risk tolerance. It is essential for traders to backtest the strategy using historical data to evaluate its performance and make necessary adjustments before applying it in live trading scenarios.
█ Default Settings
- Lookback Length: Sets the period over which the highest and lowest prices, and the volume per price level, are calculated. A higher lookback length smoothens the volatility but may delay response to recent market movements.
- Number of Rows: Determines the granularity of price levels within the price range. More rows provide a more detailed volume profile but require more computational resources.
- Entry Z-Score Threshold Base: Influences the sensitivity of the strategy to enter trades. Higher values make the strategy more conservative, requiring stronger deviation from the mean to trigger a trade.
- Exit Z-Score Threshold Base: Sets the threshold for exiting trades, with lower values allowing trades to close on smaller price retractions, thereby potentially preserving profits or reducing losses.
- Trading Direction: Allows selection between Long, Short, or Both, enabling traders to tailor the strategy to their market view or risk preferences.

Fine-tune Inputs: Fourier Smoothed Volume zone oscillator WFSVZ0Use this Strategy to Fine-tune inputs for the (W&)FSVZ0 Indicator.
Strategy allows you to fine-tune the indicator for 1 TimeFrame at a time; cross Timeframe Input fine-tuning is done manually after exporting the chart data.
I suggest using "Close all" input False when fine-tuning Inputs for 1 TimeFrame. When you export data to Excel/Numbers/GSheets I suggest using "Close all" input as True, except for the lowest TimeFrame.
MEANINGFUL DESCRIPTION:
The Volume Zone oscillator breaks up volume activity into positive and negative categories. It is positive when the current closing price is greater than the prior closing price and negative when it's lower than the prior closing price. The resulting curve plots through relative percentage levels that yield a series of buy and sell signals, depending on level and indicator direction.
The Wavelet & Fourier Smoothed Volume Zone Oscillator (W&)FSVZO is a refined version of the Volume Zone Oscillator, enhanced by the implementation of the Discrete Fourier Transform . Its primary function is to streamline price data and diminish market noise, thus offering a clearer and more precise reflection of price trends.
By combining the Wavalet and Fourier aproximation with Ehler's white noise histogram, users gain a comprehensive perspective on volume-related market conditions.
HOW TO USE THE INDICATOR:
The default period is 2 but can be adjusted after backtesting. (I suggest 5 VZO length and NoiceR max length 8 as-well)
The VZO points to a positive trend when it is rising above the 0% level, and a negative trend when it is falling below the 0% level. 0% level can be adjusted in setting by adjusting VzoDifference. Oscillations rising below 0% level or falling above 0% level result in a natural trend.
HOW TO USE THE STRATEGY:
Here you fine-tune the inputs until you find a combination that works well on all Timeframes you will use when creating your Automated Trade Algorithmic Strategy. I suggest 4h, 12h, 1D, 2D, 3D, 4D, 5D, 6D, W and M.
When I ndicator/Strategy returns 0 or natural trend , Strategy Closes All it's positions.
ORIGINALITY & USFULLNESS:
Personal combination of Fourier and Wavalet aproximation of a price which results in less noise Volume Zone Oscillator.
The Wavelet Transform is a powerful mathematical tool for signal analysis, particularly effective in analyzing signals with varying frequency or non-stationary characteristics. It dissects a signal into wavelets, small waves with varying frequency and limited duration, providing a multi-resolution analysis. This approach captures both frequency and location information, making it especially useful for detecting changes or anomalies in complex signals.
The Discrete Fourier Transform (DFT) is a mathematical technique that transforms discrete data from the time domain into its corresponding representation in the frequency domain. This process involves breaking down a signal into its individual frequency components, thereby exposing the amplitude and phase characteristics inherent in each frequency element.
This indicator utilizes the concept of Ehler's Universal Oscillator and displays a histogram, offering critical insights into the prevailing levels of market noise. The Ehler's Universal Oscillator is grounded in a statistical model that captures the erratic and unpredictable nature of market movements. Through the application of this principle, the histogram aids traders in pinpointing times when market volatility is either rising or subsiding.
DETAILED DESCRIPTION:
My detailed description of the indicator and use cases which I find very valuable.
What is oscillator?
Oscillators are chart indicators that can assist a trader in determining overbought or oversold conditions in ranging (non-trending) markets.
What is volume zone oscillator?
Price Zone Oscillator measures if the most recent closing price is above or below the preceding closing price.
Volume Zone Oscillator is Volume multiplied by the 1 or -1 depending on the difference of the preceding 2 close prices and smoothed with Exponential moving Average.
What does this mean?
If the VZO is above 0 and VZO is rising. We have a bullish trend. Most likely.
If the VZO is below 0 and VZO is falling. We have a bearish trend. Most likely.
Rising means that VZO on close is higher than the previous day.
Falling means that VZO on close is lower than the previous day.
What if VZO is falling above 0 line?
It means we have a high probability of a bearish trend.
Thus the indicator returns 0 and Strategy closes all it's positions when falling above 0 (or rising bellow 0) and we combine higher and lower timeframes to gauge the trend.
In the next Image you can see that trend is negative on 4h, negative on 12h and positive on 1D. That means trend is negative.
I am sorry, the chart is a bit messy. The idea is to use the indicator over more than 1 Timeframe.
What is approximation and smoothing?
They are mathematical concepts for making a discrete set of numbers a
continuous curved line.
Fourier and Wavelet approximation of a close price are taken from aprox library.
Key Features:
You can tailor the Indicator/Strategy to your preferences with adjustable parameters such as VZO length, noise reduction settings, and smoothing length.
Volume Zone Oscillator (VZO) shows market sentiment with the VZO, enhanced with Exponential Moving Average (EMA) smoothing for clearer trend identification.
Noise Reduction leverages Euler's White noise capabilities for effective noise reduction in the VZO, providing a cleaner and more accurate representation of market dynamics.
Choose between the traditional Fast Fourier Transform (FFT) , the innovative Double Discrete Fourier Transform (DTF32) and Wavelet soothed Fourier soothed price series to suit your analytical needs.
Image of Wavelet transform with FAST settings, Double Fourier transform with FAST settings. Improved noice reduction with SLOW settings, and standard FSVZO with SLOW settings:
Fast setting are setting by default:
VZO length = 2
NoiceR max Length = 2
Slow settings are:
VZO length = 5 or 7
NoiceR max Length = 8
As you can see fast setting are more volatile. I suggest averaging fast setting on 4h 12h 1d 2d 3d 4d W and M Timeframe to get a clear view on market trend.
What if I want long only when VZO is rising and above 15 not 0?
You have set Setting VzoDifference to 15. That reduces the number of trend changes.
Example of W&FSVZO with VzoDifference 15 than 0:
VZO crossed 0 line but not 15 line and that's why Indicator returns 0 in one case an 1 in another.
What is Smooth length setting?
A way of calculating Bullish or Bearish (W&)FSVZO .
If smooth length is 2 the trend is rising if:
rising = VZO > ta.ema(VZO, 2)
Meaning that we check if VZO is higher that exponential average of the last 2 elements.
If smooth length is 1 the trend is rising if:
rising = VZO_ > VZO_
Use this Strategy to fine-tune inputs for the (W&)FSVZO Indicator.
(Strategy allows you to fine-tune the indicator for 1 TimeFrame at a time; cross Timeframe Input fine-tuning is done manually after exporting the chart data)
I suggest using " Close all " input False when fine-tuning Inputs for 1 TimeFrame . When you export data to Excel/Numbers/GSheets I suggest using " Close all " input as True , except for the lowest TimeFrame . I suggest using 100% equity as your default quantity for fine-tune purposes. I have to mention that 100% equity may lead to unrealistic backtesting results. Be avare. When backtesting for trading purposes use Contracts or USDT.

YinYang RSI Volume Trend StrategyThere are many strategies that use RSI or Volume but very few that take advantage of how useful and important the two of them combined are. This strategy uses the Highs and Lows with Volume and RSI weighted calculations on top of them. You may be wondering how much of an impact Volume and RSI can have on the prices; the answer is a lot and we will discuss those with plenty of examples below, but first…
How does this strategy work?
It’s simple really, when the purchase source crosses above the inner low band (red) it creates a Buy or Long. This long has a Trailing Stop Loss band (the outer low band that's also red) that can be adjusted in the Settings. The Stop Loss is based on a % of the inner low band’s price and by default it is 0.1% lower than the inner band’s price. This Stop Loss is not only a stop loss but it can also act as a Purchase Available location.
You can get back into a trade after a stop loss / take profit has been hit when your Reset Purchase Availability After condition has been met. This can either be at Stop Loss, Entry or None.
It is advised to allow it to reset in case the stop loss was a fake out but the call was right. Sometimes it may trigger stop loss multiple times in a row, but you don’t lose much on stop loss and you gain lots when the call is right.
The Take Profit location is the basis line (white). Take Profit occurs when the Exit Source (close, open, high, low or other) crosses the basis line and then on a different bar the Exit Source crosses back over the basis line. For example, if it was a Long and the bar’s Exit Source closed above the basis line, and then 2 bars later its Exit Source closed below the basis line, Take Profit would occur. You can disable Take Profit in Settings, but it is very useful as many times the price will cross the Basis and then correct back rather than making it all the way to the opposing zone.
Longs:
If for instance your Long doesn’t need to Take Profit and instead reaches the top zone, it will close the position when it crosses above the inner top line (green).
Please note you can change the Exit Source too which is what source (close, open, high, low) it uses to end the trades.
The Shorts work the same way as the Long but just opposite, they start when the purchase source crosses under the inner upper band (green).
Shorts:
Shorts take profit when it crosses under the basis line and then crosses back.
Shorts will Stop loss when their outer upper band (green) is crossed with the Exit Source.
Short trades are completed and closed when its Exit Source crosses under the inner low red band.
So, now that you understand how the strategy works, let’s discuss why this strategy works and how it is profitable.
First we will discuss Volume as we deem it plays a much bigger role overall and in our strategy:
As I’m sure many of you know, Volume plays a huge factor in how much something moves, but it also plays a role in the strength of the movement. For instance, let’s look at two scenarios:
Bitcoin’s price goes up $1000 in 1 Day but the Volume was only 10 million
Bitcoin’s price goes up $200 in 1 Day but the Volume was 40 million
If you were to only look at the price, you’d say #1 was more important because the price moved x5 the amount as #2, but once you factor in the volume, you know this is not true. The reason why Volume plays such a huge role in Price movement is because it shows there is a large Limit Order battle going on. It means that both Bears and Bulls believe that price is a good time to Buy and Sell. This creates a strong Support and Resistance price point in this location. If we look at scenario #2, when there is high volume, especially if it is drastically larger than the average volume Bitcoin was displaying recently, what can we decipher from this? Well, the biggest take away is that the Bull’s won the battle, and that likely when that happens we will see bullish movement continuing to happen as most of the Bears Limit Orders have been fulfilled. Whereas with #2, when large price movement happens and Bitcoin goes up $1000 with low volume what can we deduce? The main takeaway is that Bull’s pressured the price up with Market Orders where they purchased the best available price, also what this means is there were very few people who were wanting to sell. This generally dictates that Whale Limit orders for Sells/Shorts are much higher up and theres room for movement, but it also means there is likely a whale that is ready to dump and crash it back down.
You may be wondering, what did this example have to do with YinYang RSI Volume Trend Strategy? Well the reason we’ve discussed this is because we use Volume multiple times to apply multiplications in our calculations to add large weight to the price when there is lots of volume (this is applied both positively and negatively). For instance, if the price drops a little and there is high volume, our strategy will move its bounds MUCH lower than the price actually dropped, and if there was low volume but the price dropped A LOT, our strategy will only move its bounds a little. We believe this reflects higher levels of price accuracy than just price alone based on the examples described above.
Don’t believe us?
Here is with Volume NOT factored in (VWMA = SMA and we remove our Volume Filter calculation):
Which produced -$2880 Profit
Here is with our Volume factored in:
Which produced $553,000 (55.3%)
As you can see, we wen’t from $-2800 profit with volume not factored to $553,000 with volume factored. That's quite a big difference! (Please note previous success does not predict future success we are simply displaying the $ amounts as example).
Now how about RSI and why does it matter in this strategy?
As I’m sure most of you are aware, RSI is one of the leading indicators used in trading. For this reason we figured it would only make sense to incorporate it into our calculations. We fiddled with RSI for quite awhile and sometimes what logically seems to be the right way to use it isn’t. Now, because of this, our RSI calculation is a little odd, but basically what we’re doing is we calculate the RSI, then turn it into a percentage (between 0-1) that can easily be multiplied to the price point we need. The price point we use is the difference between our high purchase zone and our low purchase zone. This allows us to see how much price movement there is between zones. We multiply our zone size with our RSI multiplication and we get the amount we will add +/- to our basis line (white line). This officially creates the NEW high and low purchase zones that we are actually using and displaying in our trades.
If you found that confusing, here are some examples to why it is an important calculation for this strategy:
Before RSI factored in:
Which produced 27.8% Profit
After RSI factored in:
Which produced 553% Profit
As you can see, the RSI makes not only the purchase zones more accurate, but it also greatly increases the profit the strategy is able to make. It also helps ensure an relatively linear profit slope so you know it is reliable with its trades.
This strategy can work on pretty much anything, but you should tweak the values a bit for each pair you are trading it with for best results.
We hope you can find some use out of this simple but effective strategy, if you have any questions, comments or concerns please let us know.
HAPPY TRADING!

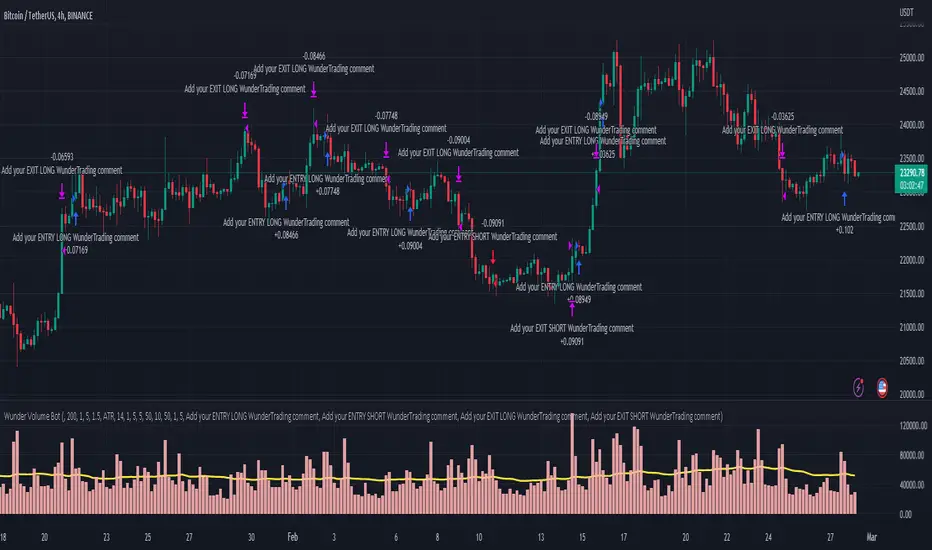
Wunder Volume botWunder Volume Bot
1. Wunder Volume bot is a non-indicator strategy that is based on the Volume analysis.
2. For the entry we will use the volume multiplier to detect the abnormal volume activity. For example, the volume should be 2 times the average. You can set your own preferences for each asset. It is recommended to use a higher multiplier and multiple assets to run multiple different bots in order to diversify your approach.
3. A function for calculating risk on the portfolio (your deposit) has been added to the Wunder Volume bot script. When this option is enabled, you get a calculation of the entry amount in dollars relative to your Stop Loss. In the settings, you can select the risk percentage on your portfolio. The loss will be calculated from the amount that will be displayed on the chart.
For example, if your deposit is $1000 and you set the risk to 1%, with a Stop Loss of 5%, the entry volume will be $200. The loss at SL will be $10.10, which is your 1% risk or 1% of the deposit.
Important! The risk per trade must be less than the Stop Loss value. If the risk is greater than SL, then you should use leverage.
The amount of funds entering the trade is calculated in dollars. This option was created if you want to send the dollar amount from Tradingview to the exchange. However, putting your volume in dollars you get the incorrect net profit and drawdown indication in the backtest results, as TradingView calculates the backtest volume in contracts.
To display the correct net profit and drawdown values in Tradingview Backtest results, use the ”Volume in contract” option.
RSI + 55 EMA + Volume (SL Marked, No Engulfing)This is to help entering in trades by considering 50 EMA and RSI indicators, Volume is used for confirmations

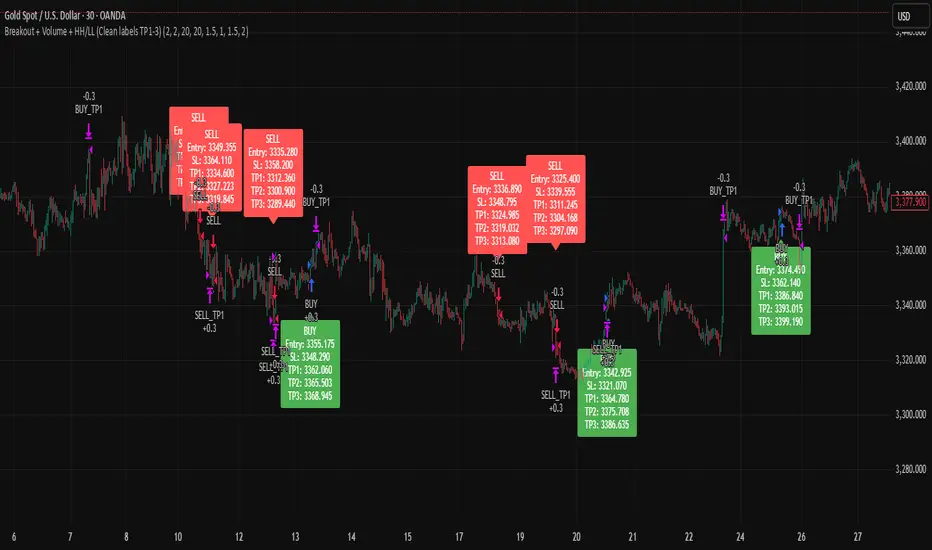
Breakout + Volume + HH/LL (Clean labels TP1-3)Breakout + Volume + HH/LL Strategy (Clean Labels)
This strategy combines breakout confirmation, volume strength, and market structure (Higher Highs / Lower Lows) to identify high-probability trade setups.
Breakout Filter: Uses a Donchian channel to detect price breakouts above resistance or below support.
Volume Confirmation: Requires volume to exceed the moving average of volume by a chosen multiplier, filtering out weak or false breakouts.
Market Structure: Long trades are only allowed if a Higher High (HH) has formed, and short trades only if a Lower Low (LL) has formed.
Trade Execution Rules:
For BUY trades: Entry at breakout, stop loss (SL) below the last pivot low, and three take profits (TP1–TP3) based on configurable risk-reward ratios.
For SELL trades: Entry at breakout, stop loss above the last pivot high, with TP1–TP3 levels set symmetrically below the entry.
Labels on Chart:
Each signal is marked with a clean label showing only:
Trade direction (BUY or SELL)
Entry price
Stop Loss
TP1, TP2, TP3
This makes the chart uncluttered while still providing all key trade information for execution or backtesting.
Nifty Power -> Nifty 50 chart + EMA of RSI + avg volume strategyThis strategy works in 1 hour candle in Nifty 50 chart. In this strategy, upward trade takes place when there is a crossover of RSI 15 on EMA50 of RSI 15 and volume is greater than volume based EMA21. On the other hand, lower trade takes place when RSI 15 is less than EMA50 of RSI 15. Please note that there is no stop loss given and also that the trade will reverse as per the trend. Sometimes on somedays, there will be no trades. Also please note that this is an Intraday strategy. The trade if taken closes on 15:15 in Nifty 50. This strategy can be used for swing trading. Some pine script code such as supertrend and ema21 of close is redundant. Try not to get confused as only EMA50 of RSI 15 is used and EMA21 of volume is used. I am using built-in pinescript indicators and there is no special calculation done in the pine script code. I have taken numbars variable to count number of candles. For example, if you have 30 minuite chart then numbars variable will count the intraday candles accordingly and the same for 1 hour candles.
