"volume" için komut dosyalarını ara

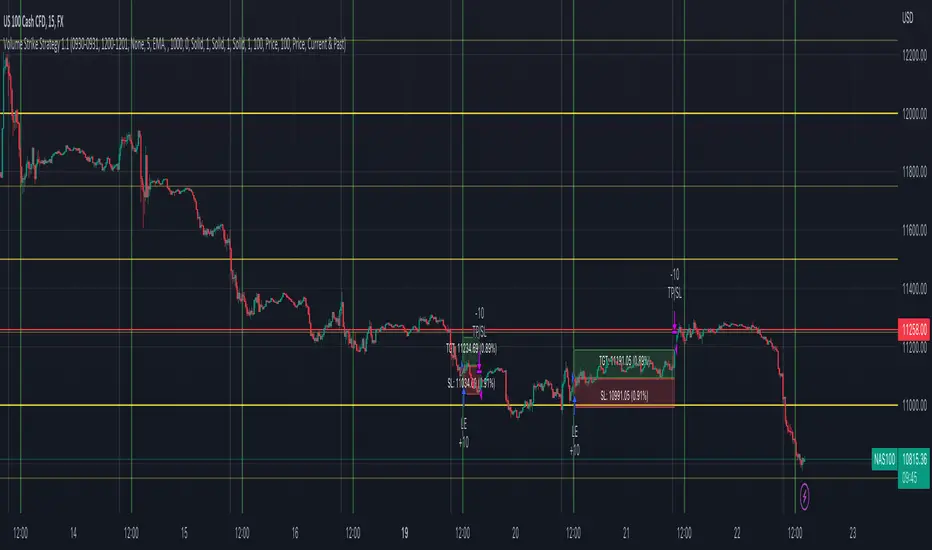
Volume Strike Strategy 1.1Volume Strike
This custom non-repainting indicator is based on an extremely simple strategy we came up with using only the default Volume indicator and key price levels.
We’ll start by explaining the time settings. You will see 4 of them.
The 2 times on the left represent the closed-volume candles at those times.
The 2 times on the right MUST be 1 minute after the times on the left. This is just a technicality based on pine script, so you can ignore the reasoning behind It. Just make sure these times are always 1 minute after the times on the left.
How signals are plotted
-If Volume 1 is higher than Volume 2, we are bullish
-If Volume 1 is lower than Volume 2, we are bearish
It's that simple! We added key price levels to also limit where to display trades. So if you only enable "Quarter Levels", this means trades will only be entered at or around Quarter Levels based on the "Price Offset" you enter.
Rounding Value: This is to help determine where to start marking Whole Levels.
Example: You’re trading USDJPY. The rounding value will be 10. The reasoning for this is that every $10 movement in price is equivalent to 1,000 pips, so a half level is 500 pips, and a quarter level is 250 pips. For a pair such as NAS100, we’ll use a rounding value of 1,000.
Price offset: This is to only show trades X price or less away from the enabled levels.
Example: You're trading NAS100 and enter 100 for the "Price Offset" setting. This means trades will only be displayed within a $100 price of the levels you selected. Keep in mind, if no levels are selected the Price Offset setting is disabled by default, and if Price Offset is 0, the levels are disabled by default, and trades will be displayed regardless if it's around a key price level or not.
Risk Management
We added several options to choose from for determining your SL and TP.
TP: Price, Percent or Next Level
SL: Price or Percent
Next Level: This option is only available for TP. Next level is just how it sounds, the next level in the direction of your trade. Keep in mind, if price is too close to the level, it’ll skip that one and set your TP at the next level.
Inverse Signals: This was added in case you find a losing strategy. You can inverse the trades to potentially have a winning strategy
Position Tool: This will display boxes on the cart with the price of your SL + TP, and the % movement in price of your SL + TP
An example of settings we are using for NAS100 are below:
NAS100. M15
09:30 - 09:31
12:00 - 12:01
MA Filter = 5
Rounding Value = 1,000
Price Offset = 0
Target = 100 price
Stop loss = 100 price
Volume and Trend Idetifier - Break EvenThis Indicator was created to try and eliminate trading with when no Volume or Suitable Trend can be identified. It also automatically adds trailing stops to a multiple of the ATR to try and limit loses and maximize wins. However, with the current settings it will perform to a break even standard across most markets. Feel free to tweak and use an indicator to test against.

Volume Weighted Price over SMA indicatorPlots Volume Wighted Price against SMA and triggeres Strategy based on Crossover


Volume RSI Crypto This is a special version RSI, in this case , I am using the volume, which is measuring the speed and change of volume to the price both up and down size.
Volume RSI attempts to gauge price trend changes via changes in bullish and bearish movements.
Its formula is :
VoRSI = 100 - 100 / (1 + VoRS)
where VoRS is Volume Relative Strength over specified period which is calculated as a ratio between averages of Up-Volumes and Down-Volumes:
VoRS = (Average Up-Volume) / (Average Down-Volume)
The logic for this strategy is simple
We entry long when we have a crossover with the Overbought level and we entry short when we have a crossunder with oversold level.
If you have any questions, please let me knw !

Volume ValueWhen VelocityTitle: Volume ValueWhen Velocity Trading Strategy
▶ Introduction:
The " Volume ValueWhen Velocity " trading strategy is designed to generate long position signals based on various technical conditions, including volume thresholds, RSI (Relative Strength Index), and price action relative to the Simple Moving Average (SMA). The strategy aims to identify potential buy opportunities when specific criteria are met, helping traders capitalize on potential bullish movements.
▶ How to use and conditions
★ Important : Only on Spot Binance BINANCE:BTCUSDT
Name: Volume ValueWhen Velocity
Operating mode: Long on Spot BINANCE BINANCE:BTCUSDT
Timeframe: Only one hour
Market: Crypto
currency: Bitcoin only
Signal type: Medium or short term
Entry: All sections in the Technical Indicators and Conditions section must be saved to enter (This is explained below)
Exit: Based on loss limit and profit limit It is removed in the settings section
Backtesting:
⁃ Exchange: BINANCE BINANCE:BTCUSDT
⁃ Pair: BTCUSDT
⁃ Timeframe:1h
⁃ Fee: 0.1%
- Initial Capital: 1,000 USDT
- Position sizing: 500 usdt
-Trading Range: 2022-07-01 11:30 ___ 2023-07-21 14:30
▶ Strategy Settings and Parameters:
1. `strategy(title='Volume ValueWhen Velocity', ...`: Sets the strategy title, initial capital, default quantity type, default quantity value, commission value, and trading currency.
↬ Stop-Loss and Take-Profit Settings:
1. long_stoploss_value and long_stoploss_percentage : Define the stop-loss percentage for long positions.
2. long_takeprofit_value and long_takeprofit_percentage : Define the take-profit percentage for long positions.
↬ ValueWhen Occurrence Parameters:
1. occurrence_ValueWhen_1 and occurrence_ValueWhen_2 : Control the occurrences of value events.
2. `distance_value`: Specifies the minimum distance between occurrences of ValueWhen 1 and ValueWhen 2.
↬ RSI Settings:
1. rsi_over_sold and rsi_length : Define the oversold level and RSI length for RSI calculations.
↬ Volume Thresholds:
1. volume_threshold1 , volume_threshold2 , and volume_threshold3 : Set the volume thresholds for multiple volume conditions.
↬ ATR (Average True Range) Settings:
1. atr_small and atr_big : Specify the periods used to calculate the Average True Range.
▶ Date Range for Back-Testing:
1. start_date, end_date, start_month, end_month, start_year, and end_year : Define the date range for back-testing the strategy.
▶ Technical Indicators and Conditions:
1. rsi: Calculates the Relative Strength Index (RSI) based on the defined RSI length and the closing prices.
2. was_over_sold: Checks if the RSI was oversold in the last 10 bars.
3. getVolume and getVolume2 : Custom functions to retrieve volume data for specific bars.
4. firstCandleColor : Evaluates the color of the first candle based on different timeframes.
5. sma : Calculates the Simple Moving Average (SMA) of the closing price over 13 periods.
6. numCandles : Counts the number of candles since the close price crossed above the SMA.
7. atr1 : Checks if the ATR_small is less than ATR_big for the specified security and timeframe.
8. prevClose, prevCloseBarsAgo, and prevCloseChange : ValueWhen functions to calculate the change in the close price between specific occurrences.
9. atrval: A condition based on the ATR_value3.
▶ Buy Signal Condition:
Condition: A combination of multiple volume conditions.
buy_signal: The final buy signal condition that considers various technical conditions and their interactions.
▶ Long Strategy Execution:
1. The strategy will enter a long position (buy) when the buy_signal condition is met and within the specified date range.
2. A stop-loss and take-profit will be set for the long position to manage risk and potential profits.
▶ Conclusion:
The " Volume ValueWhen Velocity " trading strategy is designed to identify long position opportunities based on a combination of volume conditions, RSI, and price action. The strategy aims to capitalize on potential bullish movements and utilizes a stop-loss and take-profit mechanism to manage risk and optimize potential returns. Traders can use this strategy as a starting point for their own trading systems or further customize it to suit their preferences and risk appetite. It is crucial to thoroughly back-test and validate any trading strategy before deploying it in live markets.
↯ Disclaimer:
Risk Management is crucial, so adjust stop loss to your comfort level. A tight stop loss can help minimise potential losses. Use at your own risk.
How you or we can improve? Source code is open so share your ideas!
Leave a comment and smash the boost button!

Volume Difference Delta Cycle OscillatorVolume Difference Delta Cycle Oscillator indicator:
Using the power of my Volume Difference Indicator and standard deviations based on Bollinger Bands and more, we present this wonderful indicator with the following features:
Price Action Histogram: This is the bread and butter of this graph, if the PAH is above 0, this is considered a BULL cycle, and if below 0, this is considered a BEAR cycle. The histogram will move up and down based on the Histagram settings you set in the properties field. Be careful, we advise using default settings.
Custom Overbought & Oversold Lines:mean
These lines can be used to identify when to buy and sell the security, and help you make sense of the action of the histogram. Change the color, size, and linewidth!
These lines are what are used to perform the trades with the strategy as well, so if you change them, they will make an impact on the strategy itself.
EzSpot Background:
Do you want to turn your brain off and just trade when you you're inside an Overbought or Oversold line? Awesome! Turn on EzSpot backgrounds, and when it's green, go long, when it's red go short! Simple as that!
How it works:
By taking the Delta of the Volume Difference Indicator we're able to find the rate of change of the amount of change of volume, allowing us to see changes in volume before price changes. To add onto these, we supercharge it by taking the output of this line as the input source of bollinger bands which we use to output the %B of the Delta of the Volume Difference Indicator.
Separately, we calculate the %B of the current close to use later.
The final step is taking the second %B (which is an indication of where price lies on the curve of historical price data), and from it subtract the first %B, which allows us to visualize the standard deviation of the closing price, minus the standard deviation of Delta of the Volume Difference , which in essence allows us to see when volume changes but price does not and vice versa.
This final output is then plotted along with an over bought and over sold line, which we use to perform our trades on.
Simplified: This indicator shows the cycles of price action - volume based on the rate of the rate of volume changes based on price and the closing price.
Super Simple: Notice when volume increases but price hasn't, and vice versa with this indicator.

Volume and Volatility Ratio Indicator-WODI策略名称
交易量与波动率比例策略-WODI
一、用户自定义参数
vol_length:交易量均线长度,计算基础交易量活跃度。
index_short_length / index_long_length:指数短期与长期均线长度,用于捕捉中短期与中长期趋势。
index_magnification:敏感度放大倍数,调整指数均线的灵敏度。
index_threshold_magnification:阈值放大因子,用于动态过滤噪音。
lookback_bars:形态检测回溯K线根数,用于捕捉反转模式。
fib_tp_ratio / fib_sl_ratio:斐波那契止盈与止损比率,分别对应黄金分割(0.618/0.382 等)级别。
enable_reversal:反转信号开关,开启后将原有做空信号反向为做多信号,用于单边趋势加仓。
二、核心计算逻辑
交易量百分比
使用 ta.sma 计算 vol_ma,并得到 vol_percent = volume / vol_ma * 100。
价格波动率
volatility = (high – low) / close * 100。
构建复合指数
volatility_index = vol_percent * volatility,并分别计算其短期与长期均线(乘以 index_magnification)。
动态阈值
index_threshold = index_long_ma * index_threshold_magnification,过滤常规波动。
三、信号生成与策略执行
做多/做空信号
当短期指数均线自下而上突破长期均线,且 volatility_index 突破 index_threshold 时,发出做多信号。
当短期指数均线自上而下跌破长期均线,且 volatility_index 跌破 index_threshold 时,发出做空信号。
反转信号模式(可选)
若 enable_reversal = true,则所有做空信号反向为做多,用于在强趋势行情中加仓。
止盈止损管理
进场后自动设置斐波那契止盈位(基于入场价 × fib_tp_ratio)和止损位(入场价 × fib_sl_ratio)。
支持多级止盈:可依次以 0.382、0.618 等黄金分割比率分批平仓。
四、图表展示
策略信号标记:图上用箭头标明每次做多/做空(或反转加仓)信号。
斐波那契区间:在K线图中显示止盈/止损水平线。
复合指数与阈值线:与原版相同,在独立窗口绘制短、长期指数均线、指数曲线及阈值。
量能柱状:高于均线时染色,反转模式时额外高亮。
Strategy Name
Volume and Volatility Ratio Strategy – WODI
1. User-Defined Parameters
vol_length: Length for volume SMA.
index_short_length / index_long_length: Short and long MA lengths for the composite index.
index_magnification: Sensitivity multiplier for index MAs.
index_threshold_magnification: Threshold multiplier to filter noise.
lookback_bars: Number of bars to look back for pattern detection.
fib_tp_ratio / fib_sl_ratio: Fibonacci take-profit and stop-loss ratios (e.g. 0.618, 0.382).
enable_reversal: Toggle for reversal mode; flips short signals to long for trend-following add-on entries.
2. Core Calculation
Volume Percentage:
vol_ma = ta.sma(volume, vol_length)
vol_percent = volume / vol_ma * 100
Volatility:
volatility = (high – low) / close * 100
Composite Index:
volatility_index = vol_percent * volatility
Short/long MAs applied and scaled by index_magnification.
Dynamic Threshold:
index_threshold = index_long_ma * index_threshold_magnification.
3. Signal Generation & Execution
Long/Short Entries:
Long when short MA crosses above long MA and volatility_index > index_threshold.
Short when short MA crosses below long MA and volatility_index < index_threshold.
Reversal Mode (optional):
If enable_reversal is on, invert all short entries to long to scale into trending moves.
Fibonacci Take-Profit & Stop-Loss:
Automatically set TP/SL levels at entry price × respective Fibonacci ratios.
Supports multi-stage exits at 0.382, 0.618, etc.
4. Visualization
Signal Arrows: Marks every long/short or reversal-add signal on the chart.
Fibonacci Zones: Plots TP/SL lines on the price panel.
Index & Threshold: Same as v1.0, with MAs, index curve, and threshold in a separate sub-window.
Volume Bars: Colored when above vol_ma; extra highlight if a reversal-add signal triggers

Volume and Moving average,will this model working in real-trade?i`ve recently made this script through few month,understand me if there are some incorrect grammar or something.
basically this script is based on moving average strategy and the bollinger bands
if the buy volume is bigger than sell volume,also buy volume is bigger then daily average volume than it`s defined current market is bullish and entered(of course there is some other conditions)
the exit condition is find the highest price after entered,keep refresh the highest price through time and then,if the current price is ?%lower then highest price,it will closed the position.
my question is this : 1 this model will working in real-trade?
2 why the winning rate is 100%?
- i`ve coded if the position margin over -10%,close the position this code isn`t work? or the other profit line is prevent that happened?
volume low standard deviation stystemOn the basis of moving average, add moving average and standard deviation line of volume to filter the entry and exit time.
Filter entries and/or exits based on low volume
options = 1, no not enter on low volume
options = 2, exit on low volume
options = 3, both 1 and 2
For others, please refer to the code and notes。

volume high standard deviation stystemOn the basis of moving average, add moving average and standard deviation line of volume to filter the entry and exit time.
Do not enter trades on high volume and price in trend direction.
Exit on high volume and price in profitable direction.
Option 0 = No entry or exit filter
Option 1 = Entry filter only
Option 2 = Exit filter only
Option 3 = Both entry and exit filters

Price-Volume by ClefsphereVolume is a key piece of the puzzle when analyzing stock performance!
Price-Volume script measures Buying Pressure and Selling Pressure and creates Bullish signals based on that information.
A trailing stop can be specified. Of course the dilemma of stops is that adjusting to tighter stop may result in more stop outs, less profits. Whereas, looser stop may result in larger drawdowns, larger profits.
Coded as a strategy so it can be back-tested.
Long signal is show in green at the bottom and is also shown in Strategy signals.
Coded with latest PineScript version 3. Get This Indicator Today! marketcast.wordpress.com
Thanks for your interest and support!
Disclaimer: This information is not trading advice and is for educational purposes only. Trade at your own risk. Past performance is not a guarantee of future results.

Volume Trend Following V0.1Simple test of volume based trend following strategy
Version: 0.1
Monthly profit: ~20%
Commission not considered
-----------------------------------------------------------
Support is welcomed:
BTC Donation: 15VfVrpK7WFfqHVqudiv1ygRqCZyeSEs5D

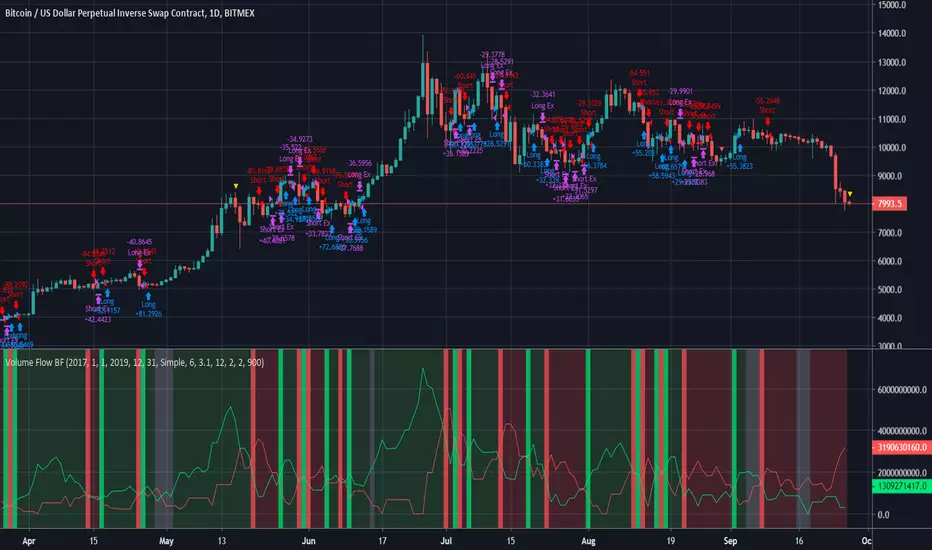
Volume Flow BFBased on code by oh92 and kiasaki.
Measures volume to indicate Bull vs Bear.
Go long when green, short when red, wait patiently when white.
AI Volume StrategyAI Volume Strategy detects significant volume spikes and combines them with trend direction and candlestick color to generate buy and sell signals. The strategy uses an Exponential Moving Average (EMA) of volume to identify abnormal volume spikes that may indicate strong market activity. Additionally, it uses a 50-period EMA of price to filter the trend and decide on entry direction.
Key Features:
Volume Spike Detection: The strategy detects when the current volume exceeds the EMA of volume by a user-defined multiplier, signaling abnormal increases in market activity.
Trend Direction Filter: The strategy uses a 50-period EMA of price to determine the market trend. Buy signals are generated when the price is above the EMA (uptrend), and sell signals are generated when the price is below the EMA (downtrend).
Candle Color Filter: The strategy generates a buy signal only when the current candle is bullish (green) and a sell signal only when the current candle is bearish (red).
Exit after X Bars: The strategy automatically closes the position after a specified number of bars (default is 5 bars), but the exit condition can be adjusted based on user preference, timeframe, and backtesting results. The default exit is after 5 bars, but users can set it to 1 bar or any other number depending on their preferences and strategy.
Signals:
Buy Signal: Generated when a volume spike occurs, the trend is upward, and the current candle is bullish.
Sell Signal: Generated when a volume spike occurs, the trend is downward, and the current candle is bearish.
Alerts:
Buy Alert: Alerts the user when a buy signal is triggered.
Sell Alert: Alerts the user when a sell signal is triggered.
Visualization:
Buy Signal: A green label appears below the bar when the buy conditions are met.
Sell Signal: A red label appears above the bar when the sell conditions are met.
Volume EMA: Optionally, the Volume EMA line can be plotted on the chart to visualize volume trends.
This strategy helps traders identify potential entry points based on increased volume activity while considering trend direction and candlestick patterns. With the ability to adjust the exit condition, users can fine-tune the strategy to their specific needs and backtest results.

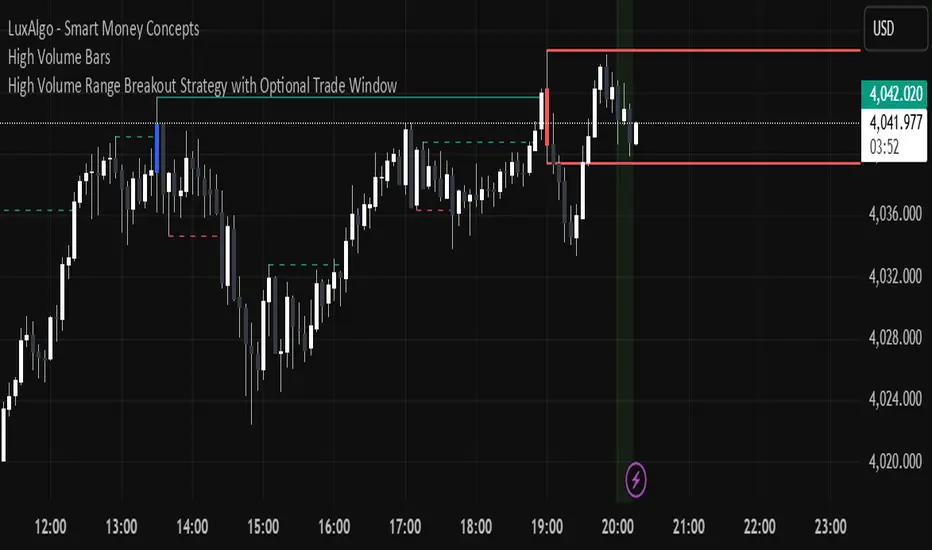
High Volume Candle Breakouts [Engr. Havery]this plots high volume candles on your chart then when a breakout happens, it gives you an alert then place your limits on the active range. goodluck and have fun
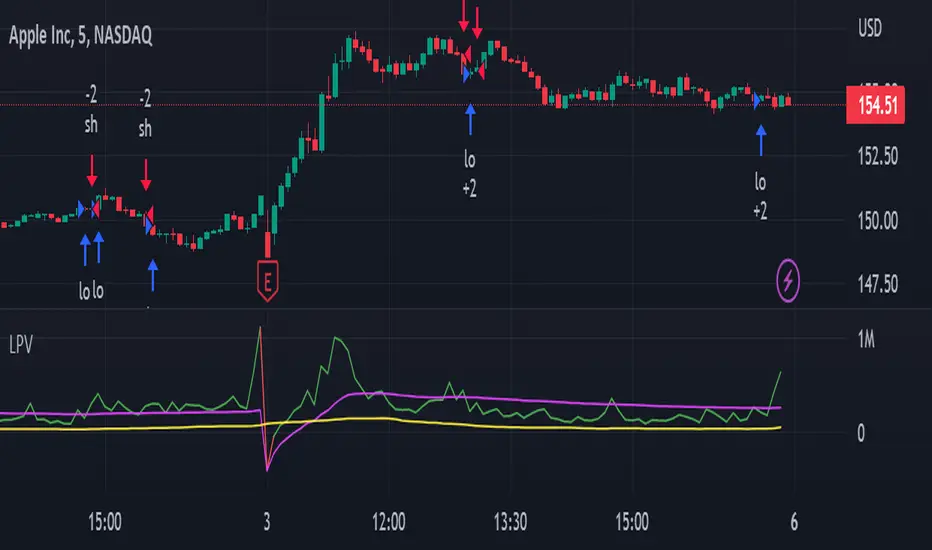
Low Volume Breakouts [Engr. Havery]Manipulation Happens in high volume candles, so when a Low Volume Breakout happens with the high volume candles. so we enter after the manipulation, breakout then retest

Last Price minus Open Price Intraday VolumeLast Price minus Open Price Intraday Volume
Change in price from day Open price to Last Price indicate the stock price movement. Last Price minus Open Price Intraday Volume indicator is framed on volume change during change in price from day Open price to Last Price. It takes into account the average intraday volume based on intraday length of bars and actual volume attributed to change in price from day Open Price to Last Price. The indicator reflects the change in trend .By analyzing the position of price on the basis of average change in volume during intraday with that of volume attributed to change in price from day open Price to Last price one may decide upon the course of trade.
DISCLAIMER: For educational and entertainment purposes only. Nothing in this content should be interpreted as financial advice or a recommendation to buy or sell any sort of security or investment including all types of crypto.
24H Volume Strategy [Capital Coders]The 24H Volume Strategy measures the 24 Hour Volume of the current Asset. When the Volume Spikes (ATR) the strategy assumes the trend will either continue or reverse and then enter the market on the high volume move to capture the highest volatility of the day. This strategy has options to trade either with the trend, with the reversal, or both.
This strategy also features the new Capital Coders - Custom Strategy Template that features new State of the Art Tools Including:
Robust Time Filter
Built in Money Management
Dynamic Multi-tiered Take Profit
Automation for ANY Platform (Using Webhooks)

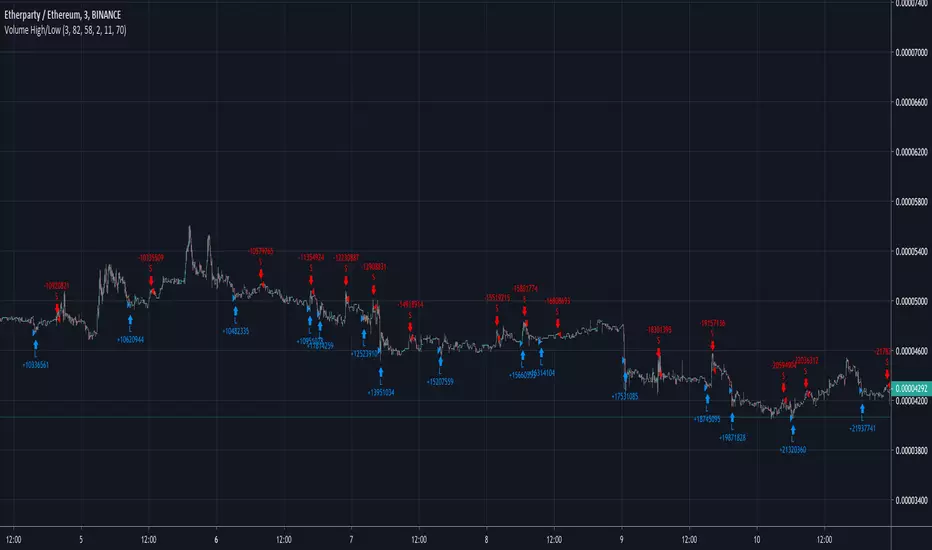
[Tirano] Volume Paradox Volume Paradox 소개
1. 한번이라도 지지 혹은 저항이 작용한 구간을 라인으로 표현합니다. 한번 맞고 튕긴 구간은 되돌림을 통한 리테스트가 있기 마련이고, 다시한번 튕길 가능성이 높습니다.
- 따라서 되돌림이 일어났을때 선으로 표현되는 구간에서 진입하면 수익으로 연계할 확률이 높습니다.
2. 전체적인 흐름을 구름과 채널의 형태로 표현합니다.
- 구름이 서서히 내려오며 하방 추세라면 매수신호에서 long으로 진입하기 보다는, 구름에 닿았을때 short으로 진입하는게 좋습니다.
- 전체적인 흐름(추세)를 거스르지 않고 매매할 수 있습니다.
- 한 방향으로 진행되는 one way 상황에 유리합니다.
기타 문의 사항은 댓글 남겨주시면 감사하겠습니다.
Hi. this is Tirano
Introduction to Volume Paradox
1. The lines where the support or resistance acts once are expressed by lines. Once hit and bounced, there is a retest through bounce, and it is likely to bounce again.
- Therefore, if you enter from the section represented by the line when the recurrence occurs, the probability of linking with the profit is high.
2. Express the overall flow in the form of clouds and channels.
- If the cloud is going down slowly, it is better to go into the short when touching the cloud, rather than going into long in the buy signal.
- You can trade without overtaking the whole flow (trend).
- It is advantageous for one way situation that goes in one direction.
If you have any other questions, please leave a comment.
