Volume Profile DeltaThis indicator calculates the Volume Profile Delta (VPD). It constructs a high-resolution volume profile for each bar using intra-bar data, offering a detailed understanding of buying and selling pressure at discrete price levels.
Key Features:
Statistical Volume Profile Engine: For each bar, the indicator builds a high-resolution volume profile on a lower 'Intra-Bar Timeframe'. Instead of simple tick counting, it uses statistical models ('PDF' allocation) to distribute volume across price levels and advanced classifiers ('Dynamic' split) to determine the buy/sell pressure within that profile, providing a more nuanced delta calculation.
"Delta Candle" Visualization: The per-bar VPD is displayed as a candle, where:
Open: Always anchored at the zero line.
High/Low: Represent the peak buying (CVD High) and selling (CVD Low) pressure accumulated within that bar's profile.
Close: The final net delta value (CVD) for the bar.
Customizable Moving Average: An optional moving average of the net delta (Close) can be added. The MA type, length, and an optional Volume weighted setting are customizable.
Intra-Bar Peak Pivot Detection: Automatically identifies and plots significant turning points (pivots) in the peak buying (High) and selling (Low) pressure.
Note on Confirmation (Lag): Pivot signals are confirmed using a lookback method. A pivot is only plotted after the Pivot Right Bars input has passed, which introduces an inherent lag.
Multi-Timeframe (MTF) Capability:
MTF Output: The entire analysis (Delta Candles, MA, Pivots) can be calculated on a higher timeframe (using the Timeframe input), with standard options to handle gaps (Fill Gaps) and prevent repainting (Wait for...).
Limitation: The Pivot detection (Calculate Pivots) is disabled if a Higher Timeframe (HTF) is selected.
Integrated Alerts: Includes 8 alerts for:
The net delta crossing its moving average.
The detection of new peak buying or selling pivots.
Conditions of agreement or disagreement between the net delta and the main bar's direction.
Caution: Real-Time Data Behavior (Intra-Bar Repainting) This indicator uses high-resolution intra-bar data. As a result, the values on the current, unclosed bar (the real-time bar) will update dynamically as new intra-bar data arrives. This behavior is normal and necessary for this type of analysis. Signals should only be considered final after the main chart bar has closed.
DISCLAIMER
For Informational/Educational Use Only: This indicator is provided for informational and educational purposes only. It does not constitute financial, investment, or trading advice, nor is it a recommendation to buy or sell any asset.
Use at Your Own Risk: All trading decisions you make based on the information or signals generated by this indicator are made solely at your own risk.
No Guarantee of Performance: Past performance is not an indicator of future results. The author makes no guarantee regarding the accuracy of the signals or future profitability.
No Liability: The author shall not be held liable for any financial losses or damages incurred directly or indirectly from the use of this indicator.
Signals Are Not Recommendations: The alerts and visual signals (e.g., crossovers) generated by this tool are not direct recommendations to buy or sell. They are technical observations for your own analysis and consideration.
"volume profile" için komut dosyalarını ara

Volume Profile Histogram [SS]I usually (and by usually, I mean the past year xD) release a significant indicator as my Christmas gift to the community on Christmas Eve. Last year, it was the Z-Score buy and sell signal; this year, it's something a little more conventional. So here is this year’s gift—hope you like it! 🎁
Seems like everyone has their take on Volume Profiles (aka SVP or VSP). I decided to create one, and in true Steversteves fashion, you can expect to find all the goodies that come with most of my stuff, including a volume profile presented in a bell-curve/histogram style (chart above) and statistical frequency tables showing the cases by ranges:
And it wouldn't be a true Steversteves indicator without some kind of ATR thing:
So, what does it do?
At the end of the day, it is a form of an SVP indicator. However, it is meant to operate on a larger scale, sorting volume in a traditional bell-curve style. In addition to displaying volume, it breaks down buying vs. selling volume. Selling volume is classified as such when the open is greater than close, while buying is when close is greater than open. This breakdown allows you to see the distribution, by price range, of where selling and buying occur.
This permits the indicator to provide 2 Points of Control (POCs). A POC is defined as an area of high volume activity. Because buying and selling volumes are broken down into two, we can identify areas with high selling and areas with high buying. Sometimes they coincide, sometimes they differ.
If we look at SQQQ, for example:
We can see that the bearish point of control is one point below the bullish POC. This is interesting because it essentially shows where people may be "panic selling" or setting their stop-outs. If SQQQ drops below 18.8, then it's likely to trigger panic selling, as indicated by the histogram.
Conversely, we can observe that traders tend to position long between $18 and $24. The POC is noted in the stats table and also displayed on the chart. Bullish POC is shown in purple, bearish in yellow. These, of course, can be toggled off.
The Frequency Table:
The frequency table shows how many observations were obtained in each price range. The histogram illustrates the cumulative volume traded, while the frequency simply counts how many cases occurred over the lookback period.
ATR Range Analytics by Volume:
The indicator also has the ability to display range analytics by volume. When you toggle on the range analytics by volume option, a range chart will appear:
www.tradingview.com
The range chart goes from the minimum recorded volume to the maximum recorded volume in the period, showing the average range and direction associated with this volume. This is crucial to pay attention to because not all stocks behave the same way.
For example, in the chart above (AMD), we can see that low volume produces a general bearish bias, and high volume produces a general bullish bias. However, if we look at the range analytics for SPY:
Low volume has the inverse effect. Low volume is associated with a more bullish bias, and high volume indicates a more bearish bias. In the ATR chart, the threshold volume to transition from bullish bias to bearish bias is approximately > 78,607,268 traded shares.
The Stats Table:
The stats table can be toggled on or off. It simply displays the POCs and the time range for the VSP. The default time range is 1 trading year (252 days), assuming you are on the daily timeframe. However, you can use this on any timeframe.
The percentages displayed in the histogram is the cumulative percent of buying and selling volume independently. So when you see the percentage on the selling histogram, its the percent of cumulative selling only. Same for the buying.
And that's the indicator! I hope you enjoy it. Let me know your thoughts. I hope you all have safe holidays, a Merry Christmas for you North Americans, and a Happy Christmas for you UKers, and whatever else you celebrate/care about and do! Safe trades, everyone, and enjoy your holidays! 🎁🎄🎄🎄⭐⭐⭐ 🕎 🕎 🕎

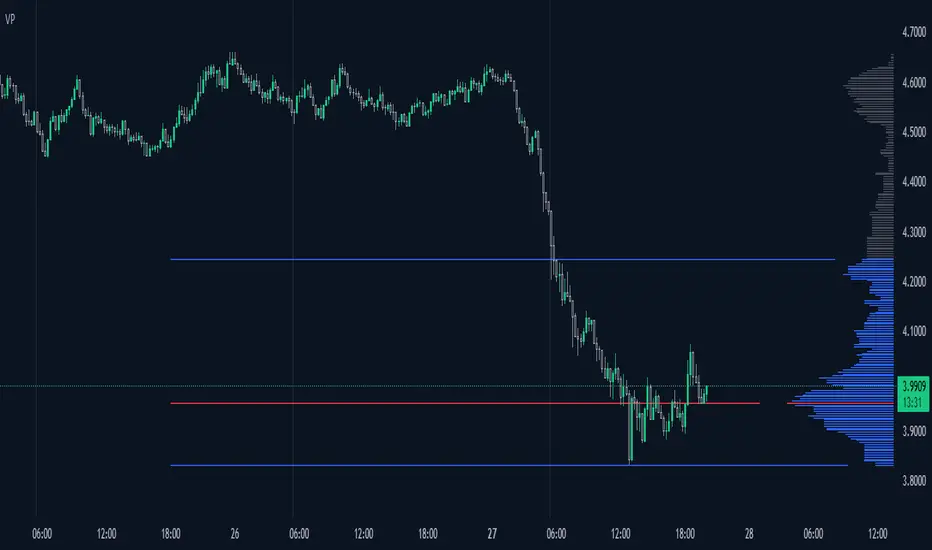
Volume Profile Segment Difference «NoaTrader»If you use volume profile, then you might have countered wanting to know a segment of the chart's volume profile relative to the whole volume profile. This indicator tries to solve that problem.
When you add it to the chart, first it asks you the start and end point of the segment you want, then it draws the whole chart's volume profile and shows the selected segments relative volume with a different color (blue default).
The default settings are good for a Bitcoin daily chart, so don't forget to change the settings for other symbols and timeframes.

Volume profile zonesHi all!
This script calculates and shows the volume profile for the range of a higher timeframe candle. It then shows support or resistance (/supply or demand) zones based on the volume profiles with the most volume. The defaults are just my preferred settings so feel free to play with them! Also feel free to let me know about bugs and features. I already have a list of features to make, e.g.:
base on pivots
more info zone calculations, e.g. breaks and retests, virgin point of control etc.
add alerts
get rid of getPriceLevels()
get rid of _barVolumeProfile prefix
handle realtime
...
Best of trading luck!

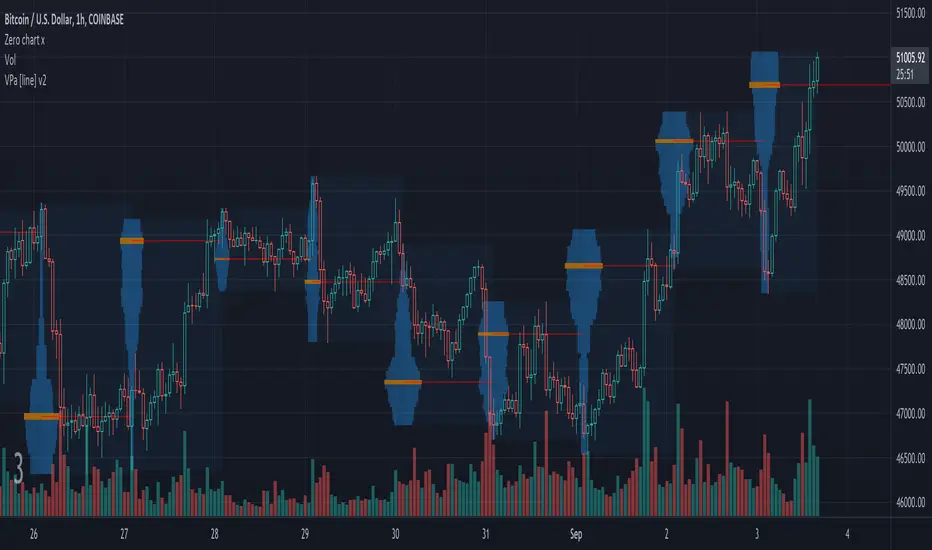
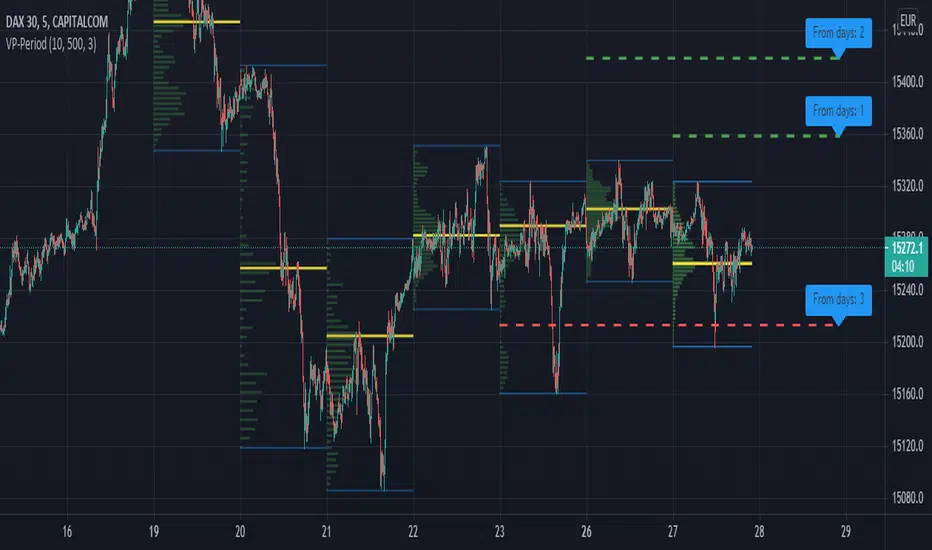
Volume Profile Auto [line]This project is about:
- VPSV
- array.new_line()
- array.new_box()
VPSV (pine) is one of the rare features that draws lines/figures BETWEEN bars
It doesn't run on Pine script, which makes it possible to do such things.
I wanted to have something similar while a restriction of Pine script is the impossibility to draw between bars, the only way I could think of is by using line width
In this script the higher timeframe is started with several lines (left) and a box, this box goes further until the higher timeframe ends.
During the creation of the box, each candle (lower timeframe) in this box (higher timeframe - period) is checked for position and volume, the volume is added to the left line, so when you see a thicker line, this means at that level there is more volume traded.
One of the big differences with other volume profiles is that many look back to a previous period, here when a period starts, the lines collect data - volume until the period ends, it is especially very visible in very low TF's (seconds)
This is my first script with array.new_line() - array.new_box(), which is a very nice Pine feature!
I hope this script can be helpful to see the possibilities
Settings:
'Parts' -> amount of lines (left of box)
5 Parts:
15 Parts:
25 Parts:
50 Parts:
'Max Width' -> Sets the max width of the lines
'Automatic Settings' -> Sets the higher time frame automatically, see the tooltip ⓘ for more info
The yellow line is the max volume line of that period, last period has a red line (POC), also referring the max.
Cheers!
Volume Profile [ZeroHeroTrading]Volume Profile by ZeroHeroTrading provides Volume Profile information fully leveraging the high/low values associated with the volume. As such, it closely aligns with the price action.
You can change the indicator settings as you see fit to achieve the best results for your use case.
Algorithm Notes
The indicator retrieves high/low/volume data within the set lookback period (number of bars back). It then sorts high/low boundaries, and accumulates the volume within the boundaries. Finally, it draws the Volume Profile as a filled out polyline joining all the boundaries together with the relevant accumulated volume proportion, and the POC as a box between the boundaries with the highest accumulated volume starting from the lookback.
When the lookback period is based on days back (instead of bars back), the indicator first dynamically calculates the number of bars to look back within the set number of days.
Please note that the lookback upper limit is 1000 bars back regardless of the settings. For instance, if the requested number of days results in the calculated bars back count (relative to the chart's timeframe) to be higher than 1000, the effective lookback will be 1000 bars back.
Features
It draws the Volume Profile and POC on the chart.
It allows for setting the number of bars or days to look back for retrieving the volume information.
It allows for setting the length of the Volume Profile being displayed (as a number of bars).
It allows for setting the offset from the last bar for the Volume Profile being displayed (as a number of bars).
It allows for setting the orientation of the Volume Profile being displayed from right to left and vice versa.
It allows for setting the colors for the Volume Profile and POC.
It allows for turning the POC functionality on/off.
Settings
Volume Lookback field: Sets number of bars or days to look back for retrieving the volume information. If the Volume Lookback field is set to 0, the volume data is retrieved for the current day regardless of the Bar(s)/Day(s) selection. Default is 200. Minimum is 0 and maximum is 1000.
Volume Lookback dropdown: If Bar(s) is selected, the volume data is retrieved for the set number of bars back. If Day(s) is selected, the volume data is retrieved for the current day plus the set number of day(s) back. Default is Bar(s).
Profile Bar Length field: Sets length of the Volume Profile being displayed as a number of bars. Default is 50. Minimum is 10 and maximum is 100.
Profile Bar Offset field: Sets offset from the last bar for the Volume Profile being displayed as a number of bars. Default is 10. Minimum is 0 and maximum is 100.
Profile Orientation dropdown: Selects Volume Profile orientation. Left is -right to left- and Right is -left to right-. Default is Left.
Profile Color select: Selects Volume Profile color. Default is blue (100% opacity).
Show POC checkbox: Turns on/off POC. Default is on.
POC Color select: Selects POC color. Default is orange (80% opacity).

Pso Volume Profile # Volume Profile with Dynamic Support and Resistance
## Overview
This Pine Script indicator for TradingView creates a comprehensive volume profile display with automatic support and resistance levels based on significant volume nodes. The indicator analyzes price action and volume data to identify key levels where trading activity has been concentrated, helping traders identify potential reversal or continuation zones.
## Key Features
### Volume Profile Analysis
- Displays a horizontal volume profile on the right side of the chart
- Divides volume into bid (buying) and ask (selling) components
- Color-codes bid and ask volumes differently for easy identification
- Customizable profile width, opacity, and placement
### Dynamic Support and Resistance Detection
- Automatically identifies significant price levels based on volume concentration
- Uses an adjustable percentile threshold to filter for the most important levels
- Color-codes support/resistance lines based on bid/ask dominance:
- Red lines: Bid-dominant levels (more buying pressure)
- Green lines: Ask-dominant levels (more selling pressure)
- Extends lines across the chart for clear visualization
### Customization Options
- Adjustable lookback period for volume analysis
- Configurable number of price divisions (bars)
- User-selectable volume percentile threshold (50-100%)
- Customizable colors for all elements
- Adjustable line length and position
## How It Works
1. The indicator divides the price range into a specified number of horizontal zones
2. It analyzes historical price and volume data within the lookback period
3. For each price zone, it calculates the total volume and separates bid/ask components
4. It identifies zones with volume exceeding the user-defined percentile threshold
5. It draws color-coded horizontal lines at these significant levels, extending across the chart
6. Lines are colored based on whether buying or selling was dominant at each level
## Usage Guidelines
- Higher percentile values (80-95%) will show fewer, but more significant levels
- Lower values (50-70%) will show more potential support/resistance zones
- Red lines often represent potential support levels (buyer-dominated)
- Green lines often represent potential resistance levels (seller-dominated)
- Areas where multiple lines cluster indicate highly significant zones
## Applications
- Identifying key price levels for entry and exit points
- Recognizing potential reversal zones
- Setting strategic stop-loss and take-profit levels
- Confirming support/resistance levels from other technical analysis methods
- Understanding the volume distribution and market structure
This indicator combines volume profile analysis with automatic support/resistance detection, providing traders with a powerful tool to identify significant price levels based on actual trading activity rather than just price patterns.

Volume Profile - BearJust another Volume Profile but you can fit into your chart better by moving back and forth horizontally. also note you can fix the number of bars to show the volume by that way you can use a fib retracment to line up high/low volume nodes with fib levels... see where price as bad structure. or just play with the colors to make a cool gradient?
Volume Profile is a technical analysis tool used by traders to analyze the distribution of trading volume at different price levels within a specified time frame. It helps traders identify key support and resistance levels, potential areas of price reversals, and areas of high trading interest. Here's how to read Volume Profile on a trading chart:
1. **Choose a Time Frame**: Decide on the time frame you want to analyze. Volume Profile can be applied to various time frames, such as daily, hourly, or even minute charts. The choice depends on your trading style and goals.
2. **Plot the Volume Profile**: Once you have your chart open, add the Volume Profile indicator. Most trading platforms offer this tool. It typically appears as a histogram or a series of horizontal bars alongside the price chart.
3. **Identify Key Elements**:
a. **Value Area**: The Value Area represents the price range where the majority of trading volume occurred. It is often divided into three parts: the Point of Control (POC) and the upper and lower value areas. The POC is the price level where the most trading activity occurred and is considered a significant support or resistance level.
b. **High-Volume Nodes**: High-volume nodes are price levels where there was a significant amount of trading volume. These nodes can act as support or resistance levels because they represent areas where many traders had their positions.
c. **Low-Volume Areas**: Conversely, low-volume areas are price levels with little trading activity. These areas may not provide strong support or resistance because they lack significant trader interest.
4. **Interpretation**:
- If the price is trading above the POC and the upper value area, it suggests bullish sentiment, and these levels may act as support.
- If the price is trading below the POC and the lower value area, it suggests bearish sentiment, and these levels may act as resistance.
- High-volume nodes can also act as support or resistance, depending on the price's current position relative to them.
5. **Confirmation**: Volume Profile should be used in conjunction with other technical analysis tools and indicators to confirm trading decisions. Consider using trendlines, moving averages, or other price patterns to validate your trading strategy.
6. **Adjust for Different Time Frames**: Keep in mind that Volume Profile analysis can yield different results on different time frames. For example, a support level on a daily chart may not hold on a shorter time frame due to intraday volatility.
7. **Practice and Experience**: Like any trading tool, reading Volume Profile requires practice and experience. Analyze historical charts, paper trade, and refine your strategies over time to gain proficiency.
8. **Stay Informed**: Stay updated with market news and events that can impact trading volume. Sudden news can change the significance of volume levels.

Volume Profile [projeadam]Volume Profile Indicator
OVERVIEW
The "Volume Profile " indicator is designed to analyze and visualize the volume distribution within a specified number of past bars on the TradingView platform. This tool helps traders to identify key levels of volume activity, which can indicate significant support and resistance zones.
USER GUIDE
The primary purpose of this indicator is to provide a detailed volume profile over a specified range of bars. It highlights areas of high and low trading activity, enabling traders to make more informed decisions based on historical volume data.
SETTINGS PANEL
🌟 Indicator Settings 🌟
1. Back Bars Value :
o Description: Sets the number of past bars to be considered for volume profile calculation.
o Default Value: 43
o Range: 1 to 500
2. Value Area Volume %:
o Description: Specifies the percentage of total volume to be included in the value area.
o Default Value: 50%
o Range: 1% to 100%
🪐 Histogram Settings 🪐
1. Show Histogram:
o Description: Toggles the display of the volume histogram on the chart.
o Default: Enabled
2. Right Or Left Side Histogram:
o Description: Allows the user to choose the position of the histogram on the chart (right or left side).
o Default: Left Side
3. Number of Histogram Branches:
o Description: Sets the number of segments or branches in the histogram.
o Default Value: 50
4. Value Area BUY Color:
o Description: Sets the color for the histogram bars indicating buying volume areas.
o Default: Green (#73ff21 with 15% opacity)
5. Value Area SELL Color:
o Description: Sets the color for the histogram bars indicating selling volume areas.
o Default: Red (#ff2828 with 15% opacity)
🎯 Lines Settings 🎯
1. Show Lines:
o Description: Toggles the display of horizontal lines representing key volume levels.
o Default: Enabled
2. Show Labels:
o Description: Toggles the display of labels for the horizontal lines.
o Default: Enabled
3. High Level Line:
o Show Line: Enables the high volume level line.
o Line Style: Options for solid, dotted, or dashed lines.
o Line Width: Adjustable from 1 to 5.
o Line Color: Customizable color for the high level line.
4. Middle Level Line (POC Line):
o Show Line: Enables the Point of Control (POC) line.
o Line Style: Options for solid, dotted, or dashed lines.
o Line Width: Adjustable from 1 to 5.
o Line Color: Customizable color for the POC line.
5. Low Level Line:
o Show Line: Enables the low volume level line.
o Line Style: Options for solid, dotted, or dashed lines.
o Line Width: Adjustable from 1 to 5.
o Line Color: Customizable color for the low level line.
Visualization
- Histogram Positioning: The histogram can be displayed on either the right or left side of the chart, providing flexibility based on user preference.
- Line and Label Customization: Users can customize the style, width, and color of the lines and labels to match their trading style and charting preferences.
ALARMS
This indicator can trigger alarms based on significant price movements relative to the identified volume levels:
- Break High Level: An alarm is triggered when the price crosses above the high volume level.
- Break Low Level: An alarm is triggered when the price crosses below the low volume level.
ALGORITHM
The indicator calculates the highest and lowest prices within the specified number of past bars and divides the price range into segments. It then allocates the volume within each segment, distinguishing between buying and selling volumes. The key volume levels (Point of Control, High Volume Node, and Low Volume Node) are identified and highlighted on the chart.
Example
In the example below, the histogram is displayed on the left side, showing higher buying volumes in green and selling volumes in red. The key volume levels are marked with horizontal lines and labels, providing clear visual cues for significant support and resistance zones.
BENEFITS
- Enhanced Market Insight: Provides a detailed view of volume distribution, highlighting key trading levels.
- Customizable Visualization: Flexible settings allow traders to customize the indicator to their needs.
- Alert Mechanism: Automated alarms keep traders informed of significant market movements in real-time.
ADDITIONAL FEATURES
If you have suggestions for additional features or improvements, please feel free to reach out.

Volume Profile Bar-Magnified Order Blocks [MyTradingCoder]Introducing "Volume Profile Bar-Magnified Order Blocks", an innovative and unique trading indicator designed to provide traders with a comprehensive understanding of market dynamics. This tool takes the concept of identifying order blocks on your chart and elevates it by integrating a detailed volume profile within each order block zone.
Unlike standard order block indicators, Volume Profile Bar-Magnified Order Blocks pulls data from lower timeframe bars and assigns it to various segments of the order block. By providing this volume profile inside the order block, the indicator supplies a deeper, multi-dimensional view of market activity that can enhance your trading decisions.
Crucially, users have the ability to fine-tune the detection of order blocks. This is made possible through a single input setting called "Tuning". This integer value allows you to control the significance and frequency of the order blocks. Higher numbers will produce more significant order blocks, though they will appear less frequently. Lower numbers, on the other hand, will yield less significant order blocks, but they will occur more often. This enables you to adjust the sensitivity of the indicator according to your specific trading strategy and style.
Key Settings:
Number of Segments: Customize the level of detail in your volume profile by selecting the number of segments you want inside each order block.
Tuning: Adjust the sensitivity of order block detection to align with your trading strategy. Higher values produce more significant but less frequent order blocks, while lower values yield less significant but more frequent order blocks.
Color Inputs: Personalize the look of your chart by selecting the colors for various elements of the indicator. This ensures a seamless integration with your current chart aesthetics and improves visual clarity.
Here is a s creenshot that beautifully demonstrates the power of this indicator. You'll see how the price rejects perfectly off the highest volume segment in an order block, showcasing the indicator's potential for pinpointing high-impact price levels.
While Volume Profile Bar-Magnified Order Blocks offers many unique features, it should be used in conjunction with other indicators and forms of analysis for a complete trading strategy. As with all tools, it does not guarantee profitable trades but is intended to give traders more information to base their decisions on. Use it to complement your existing analysis and enhance your understanding of market behavior.
Experience a new level of clarity in your trading with Volume Profile Bar-Magnified Order Blocks - an indicator that goes beyond the surface to help you navigate the markets more effectively.

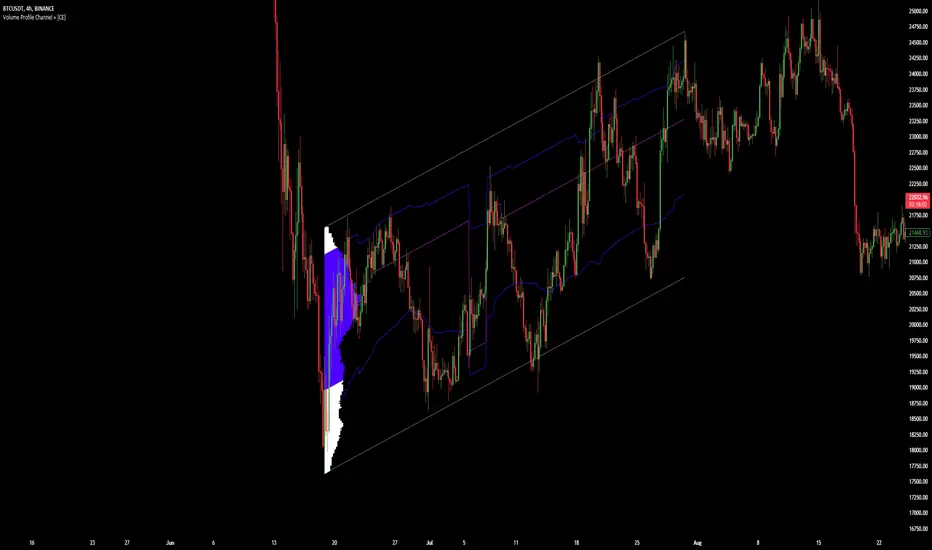
Volume Profile Channel + [CE]Volume Profile Channel +
Volume Profile Channel +, Is the first of its kind tool that will plot a volume profile in any directional channel, the tool will calculate a profile and display the following, POC/VAH/VAL.
The typical profile works by on a horizontal access such that ticksize can be calculated along the y axis and data can then be used to generate a profile, the angle of a parallel channel would make this unavailable.
By cleverly using the angle at which the profile is created, a diagonal ticksize is generated and applied to the profile to create a first of its kind parallel channel volume profile tool!
Features include the ability to "anti-alias" the profile as well below will show a comparison of this occurring:
Unsmoothed
Smoothed
Additionally this mode comes with the ability to track the development of the POC AND VAH/VAL overtime:
The advantage of using this is that as opposed to relying datasets of mid points or custom equal values along a parallel channel, users can now use the profile to see where the channel has the most interaction, (POC).
This allows for an objective look into the data as opposed to identifying by "eye" where traders are exchanging hands or vs using values such as the midpoint which may not necessarily always be a point of interest as the POC will be.
The VAH/VAL levels give good opportunity to see reactions at levels we may not previously be able to see in the channel with fixed values, allowing us to take positions in a more dynamic sense.
As you can see in the chart below with the track enabled, you can see clear reaction points when price interacted with these dynamic levels, which may not be identifiable with fixed positions, 0.25,0.5,0.75 etc...
TO DO
Dynamic Extension Points
Custom Alerts
Real Time Extension
Volume Profile AnalysisThe Volume Profile Dashboard is a professional-grade analysis tool built for TradingView. It focuses on displaying a comprehensive volume profile breakdown within a dashboard format directly on the chart. The purpose of this tool is to help traders quickly assess buy versus sell volume dynamics, momentum, and sentiment in order to support informed trading decisions.
Instead of plotting simple bars, this indicator uses a detailed table and visual progress bar to summarize live and historical market activity. By condensing key metrics into a structured format, traders can analyse market behaviour without manually calculating or switching between multiple indicators.
________________________________________
How the Script Works
1. Data Gathering
The script uses lower-timeframe price and volume data to calculate buy volume, sell volume, and total traded volume for the current and previous candles.
2. Volume Allocation
Buy and sell volumes are estimated by looking at the candle’s range (high to low) and how the closing price aligns within that range. The closer the close is to the high, the stronger the buying pressure. The closer the close is to the low, the stronger the selling pressure.
3. Delta and Momentum
o Delta measures the difference between buy and sell volume.
o Volume momentum compares the current candle’s activity to the previous one, showing if interest is rising or fading.
4. Point of Control (POC)
An average of high, low, and close is calculated to give an approximate “point of control” level—an area of balance where buyers and sellers previously agreed on price.
5. Dashboard Visualization
All these calculations are displayed inside a clean dashboard table with separate rows for the current candle, previous candle, and a summary row. Icons, colors, and progress bars make it visually intuitive.
6. On-Chart Progress Indicator
A dynamic horizontal progress bar is plotted on the chart above price, showing the balance between buy and sell volume for the latest activity.
7. Alerts
Built-in alerts trigger when strong buying or selling pressure is detected or when there is a significant spike in total traded volume.
________________________________________
How This Tool Can Be Used
• Intraday Trading: Quickly gauge whether buyers or sellers are in control of the market at any moment.
• Swing Trading: Compare momentum shifts between candles to identify early trend reversals.
• Risk Management: Use delta and sentiment signals to confirm whether to hold or reduce exposure.
• Confirmation: Align the volume profile dashboard with other indicators (such as RSI, MACD, or trendlines) for stronger trading conviction.
________________________________________
Using Mixed Indicators for Decisions
This dashboard alone provides volume insights, but better decisions come when it is combined with other tools:
• Pairing it with an RSI can show whether heavy buying is happening in overbought conditions.
• Combining with a SuperTrend or moving averages can confirm if volume momentum aligns with the price trend.
• Overlaying support/resistance levels can identify whether strong buy/sell signals occur at critical levels.
Mixed indicators prevent relying on one signal alone, reducing false trades.
________________________________________
Importance of This Tool
• Clarity: Condenses complex volume data into a simple, visual format.
• Speed: Traders can react faster with pre-calculated buy/sell percentages.
• Precision: Highlights hidden imbalances that are not obvious from candles alone.
• Professional-grade dashboard: Offers an institutional-style view of market behavior directly within TradingView.
________________________________________
Parameters in the Dashboard Table
• Period: Shows whether the row is for the current or previous candle, along with trend arrows.
• Price Range: The high–low range of the candle.
• Total Volume: The sum of buy and sell activity.
• Buy Volume / Sell Volume: Separated distribution of transactions leaning bullish or bearish.
• Delta: The net difference between buy and sell volumes, highlighting pressure imbalance.
• Buy % / Sell %: The percentage contribution of each side to total volume.
• POC: An average reference level where market consensus was strongest.
• Progress: A graphical bar showing buy vs sell dominance.
• Signal: Simplified output like Strong Buy, Buy, Strong Sell, Sell, Neutral.
• Summary Row: Compares changes between the current and previous candles and gives overall market sentiment.
________________________________________
Stock Market Disclaimer
This tool is for educational and informational purposes only. It does not constitute financial advice, investment advice, or trading recommendations. The stock market and cryptocurrency markets involve high risk. Traders and investors should do their own research and consult licensed financial advisors before making investment decisions. Past performance is not indicative of future results.
________________________________________
Misuse Disclaimer
This script has been developed as per TradingView’s rules and is intended for responsible trading analysis only. Any misuse, redistribution, or modification outside of TradingView’s policies is discouraged. The author and platform are not responsible for financial losses, misinterpretation of signals, or misuse of the code.
________________________________________
Disclaimer
Training & Educational Only — This material and the indicator are provided for educational purposes only. Nothing here is investment advice or a solicitation to buy or sell financial instruments. Past simulated or historical performance does not predict future results. Always perform full back testing and risk management, and consider seeking advice from a qualified financial professional before trading with real capital.
________________________________________

Volume Profile Heatmap 2.0The "Enhanced Volume Profile Heatmap" is a powerful Pine Script indicator designed for advanced volume analysis on TradingView charts. It creates a dynamic heatmap of volume distribution across a defined price range, enabling traders to pinpoint significant trading levels and understand price action more deeply.
Key Features:
Configurable Parameters:
Number of Bins (numBins): Defines the resolution of the heatmap by dividing the price range into multiple levels. More bins provide higher granularity.
Lookback Period (lookback): Sets the historical period over which the volume profile is calculated.
Price Range Calculation:
Calculates the highest and lowest prices over the lookback period, defining the boundaries for volume distribution.
Volume Allocation Across Price Levels:
The price range is divided into "bins" where each bin represents a specific price level.
For each price within the lookback period, the corresponding volume is allocated to its bin, building a comprehensive distribution of volume per price level.
Volume Normalization and Heatmap Visualization:
Volume for each bin is normalized based on the highest volume bin, creating a gradient effect to visually represent high and low-volume areas.
A heatmap color scheme is applied, where low volume appears redder and high volume appears greener, emphasizing critical price levels.
Visual Representation:
Each bin’s volume is depicted as a horizontal line with varying color intensity, creating a heatmap effect directly over the price chart.
Purpose:
The Enhanced Volume Profile Heatmap is ideal for traders looking to identify high-activity trading zones, which often act as strong support or resistance. By visualizing where trading activity concentrates, users can gain insights into potential areas of interest, allowing for more informed entry and exit decisions.
This indicator is a unique tool for volume-based analysis, helping traders understand underlying market sentiment and positioning across different price levels in a clear, intuitive way.

Volume Profile Heatmap [UAlgo]The "Volume Profile Heatmap " indicator is a tool designed to visualize the distribution of trading volume across different price levels over a specified period. This heatmap-style indicator helps traders identify significant price levels where a high volume of trading activity has occurred, which can be crucial for making informed trading decisions. The indicator divides the price range into multiple levels and calculates the volume of trades occurring at each level, presenting this data in a visually intuitive manner using a gradient of colors.
By analyzing the volume profile, traders can gain insights into areas of support and resistance, as well as the Point of Control (POC)—the price level with the highest traded volume. This information is valuable in assessing market sentiment, potential reversal points, and key areas of interest where price action might consolidate or react.
🔶 Key Features
Customizable Analysis Period: The indicator allows users to specify the analysis period, defining the historical range over which the volume profile is calculated.
Adjustable Number of Levels: Users can set the number of price levels to divide the price range, offering flexibility in the granularity of the volume analysis.
Color-Coded Heatmap: The indicator uses a gradient color scheme to visually represent volume intensity at each price level. Higher volume areas are shaded differently than lower volume areas, making it easy to spot significant price levels.
Opacity Control: Users can adjust the opacity of the volume boxes, enabling a clearer or more subtle visualization according to their preferences.
Point of Control (POC) Display: The indicator highlights the Point of Control, the price level with the highest traded volume, with a distinct line on the chart, allowing traders to easily identify this critical level.
🔶 Disclaimer
Use with Caution: This indicator is provided for educational and informational purposes only and should not be considered as financial advice. Users should exercise caution and perform their own analysis before making trading decisions based on the indicator's signals.
Not Financial Advice: The information provided by this indicator does not constitute financial advice, and the creator (UAlgo) shall not be held responsible for any trading losses incurred as a result of using this indicator.
Backtesting Recommended: Traders are encouraged to backtest the indicator thoroughly on historical data before using it in live trading to assess its performance and suitability for their trading strategies.
Risk Management: Trading involves inherent risks, and users should implement proper risk management strategies, including but not limited to stop-loss orders and position sizing, to mitigate potential losses.
No Guarantees: The accuracy and reliability of the indicator's signals cannot be guaranteed, as they are based on historical price data and past performance may not be indicative of future results.

Volume Profile / Order Blocks + Demandas e Ofertas FortesThis indicator combines two powerful technical analysis tools into one: the Volume Profile Bar-Magnified Order Blocks and Strong Demands and Offers.
The Volume Profile Bar-Magnified Order Blocks identifies and highlights significant areas of volume and price on the chart, helping traders identify zones of high liquidity and potential trend reversal areas. With advanced customization features such as choice of mitigation method and grid adjustments, traders can tailor the indicator to their individual preferences.
Alongside the Volume Profile, Strong Demands and Offers add an additional layer of analysis, highlighting points of interest where buying or selling pressure is strongest. This helps traders identify key areas where the balance of power may shift, providing potential entry or exit signals.
Key Features:
Automatic identification of significant volume areas.
Highlighting of zones of high liquidity and potential trend reversal areas.
Advanced customization, including choice of mitigation method and grid adjustments.
Highlighting of strong demands and offers to identify key areas of buying or selling pressure.
How to Use:
Add the indicator to your chart.
Adjust the parameters according to your preferences.
Observe the highlighted areas of volume and price on the chart.
Look for entry or exit signals based on the identified areas of interest.
This indicator is a valuable tool for traders looking to enhance their technical analysis based on volume and market dynamics. Try it out in your trading strategy and discover how it can help you make more informed and accurate decisions.

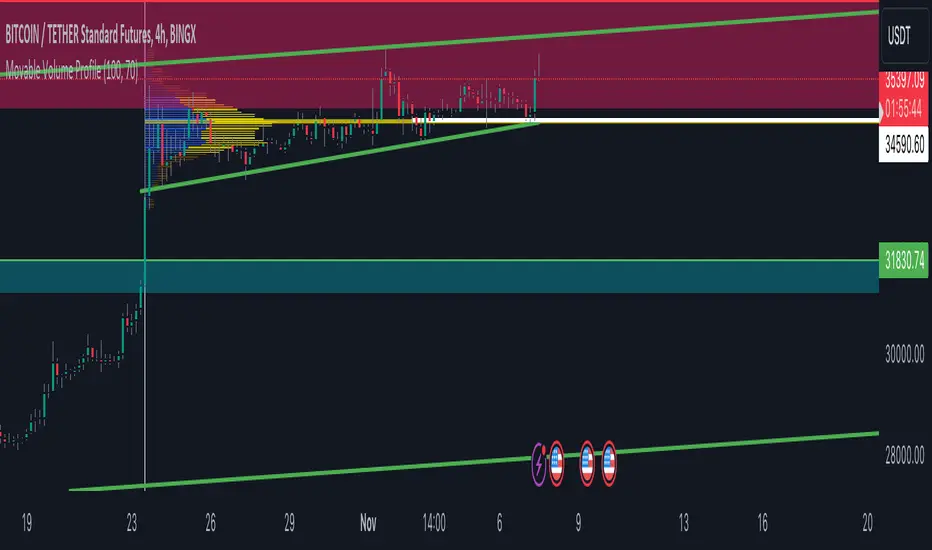
Volume Profile Movable RangeA movable range volume profile indicator is an advanced technical analysis tool that offers traders the flexibility to customize the start date from which the indicator's calculation begins. This feature is particularly valuable for investors who wish to focus on specific time periods and gain a more detailed understanding of price and volume movements within those intervals.
The primary advantage of this indicator lies in its intuitive movable bar, which allows users to easily adjust the start date on the chart. By dragging this bar forward or backward along the time axis, the volume profile calculation is automatically updated to reflect the newly selected date range. This provides traders with a unique ability to adapt to changing market conditions and adjust their analysis in real-time.
By customizing the start date, investors can explore patterns, trends, and support/resistance levels within specific timeframes more accurately and timely. Furthermore, this indicator offers a detailed interpretation of trading volume, aiding traders in assessing the strength or weakness of trends, identifying potential entry and exit points, and making informed decisions in their trading strategies.
In summary, a movable range volume profile indicator is an essential tool for traders seeking more adaptable and precise technical analysis. The ability to easily select and adjust the start date through a movable bar on the chart provides a significant advantage when making data-driven, personalized decisions in financial markets.
Volume Profile and Volume Indicator by DGTVolume Profile (also known as Price by Volume) is an charting study that displays trading activity over a specified time period at specific price levels. It is plotted as a horizontal histogram on the finacial isntrumnet's chart that highlights the trader's interest at specific price levels.
The histogram is used by traders to predict areas of support and resistance. Price levels where the traded volume is high could be assumed as support and resistance levels.
Price may experience difficulty moving above or below areas with large bars. Usually there is a great deal of activity on both the buy and sell side and the market stays at that price level for a great deal of time
It is advised to use volume profile in conjunction with other forms of technical analysis to maximize the odds of success
Light version of Volume Profile is added to Price Action - Support & Resistance by DGT

Volume Profile HeatmapA variation of a Volume Profile based on code originally by LuxAlgo. () The traditional bar chart is replaced with full-width bars that are brighter for high volume price levels.
Like a traditional VP, its purpose is to visualize how volume corresponds to specific price levels, allowing you to get a quick idea of where the most activity is occurring, and where it hasn't been. This information may provide clues as to where price action may return, areas of support and resistance , and regions where price may move quickly. The basic concepts behind any Volume Profile (or Price by Volume Chart) should apply here as well. (investopedia article)
Inputs are set up such that you can customize the lookback period, number of rows, and width of rows for most major timeframes individually. Timeframes between those available will use the next lower timeframe settings (e.g., 2m chart will use the 1m settings.)
This indicator is experimental and is likely to receive further updates.

Volume Profile cheap copyIn the absence of TradingView's open-source Volume Profile (hereinafter referred to as VP) indicator code, I have replicated it. However, because this code is classified as an "indicator" rather than a "tool," it cannot allow users to define the range according to their preferences. In the code, I have set different periods, and users can input 0, 1, or 2 to let the indicator calculate the volume distribution from the earliest candle to the latest candle within the daily, weekly, or monthly range, respectively.
How can we prove that this code is consistent with TradingView's algorithm?
Firstly, the calculation or drawing process of VP starts from the earliest candle in the selected range. After calling TradingView's built-in "Fixed Range Volume Profile" (FRVP) tool, you can enter the settings interface of the tool and check both "developing POC" and "Value Area (VA)." The paths of POC, VAH, and VAL will appear in the chart. These paths are the changes in the values of POC, VAH, and VAL as the number of candles increases. If the paths shown by my indicator are the same as those shown by TradingView's VP indicator, then it proves the algorithms are consistent. Since VP itself is calculated based on volume, the high and low points of candles, and the opening and closing prices, if the data sources are consistent, the calculation results (the paths of POC, VAH, and VAL) will remain consistent over time. This can be used to infer that the algorithms are consistent. Additionally, the parameters of the two indicators (number of rows and value area ratio) must be the same to verify consistency. The number of rows in the indicator is usually set to 100 by default, and the value area ratio is 70. Therefore, the parameters in FRVP should also be set to 100 rows and a value area volume of 70.
Why is there a noticeable discrepancy?
When the start and end points of the VP remain unchanged, reducing the chart's time frame can improve accuracy. For example, when calculating the weekly VP, switching from a 1-hour time frame to a 5-minute time frame can make the indicator more closely match TradingView's native VP. Tests have shown that TradingView's native VP may not use the data displayed on the current chart for its calculations. For instance, the VP may use data from the 5-minute time frame even if the chart is displayed in the 1-hour time frame. However, my replicated VP calculates based on the chart's data, so differences in time frames will affect accuracy.
Current algorithm deficiencies
This replicated VP code is merely a demo and does not handle data updates. In other words, after the latest candle closes, the VP needs to be recalculated, but this recalculation step is not handled, which will cause errors. To resolve this issue, you only need to switch the time frame or delete the indicator and re-add it.

Volume Profile / Fixed RangeHello All,
This script calculates and shows Volume Profile for the fixed range . Recently we have box.new() feature in Pine Language and it's used in this script as an example. Thanks to Pine Team and Tradingview!..
Sell/Buy volumes are calculated approximately!.
Options:
"Number of Bars" : Number of the bars that volume profile will be calculated/shown
"Row Size" : Number of the Rows
"Value Area Volume % " : the percent for Value Area
and there are other options for coloring and POC line style
Enjoy!

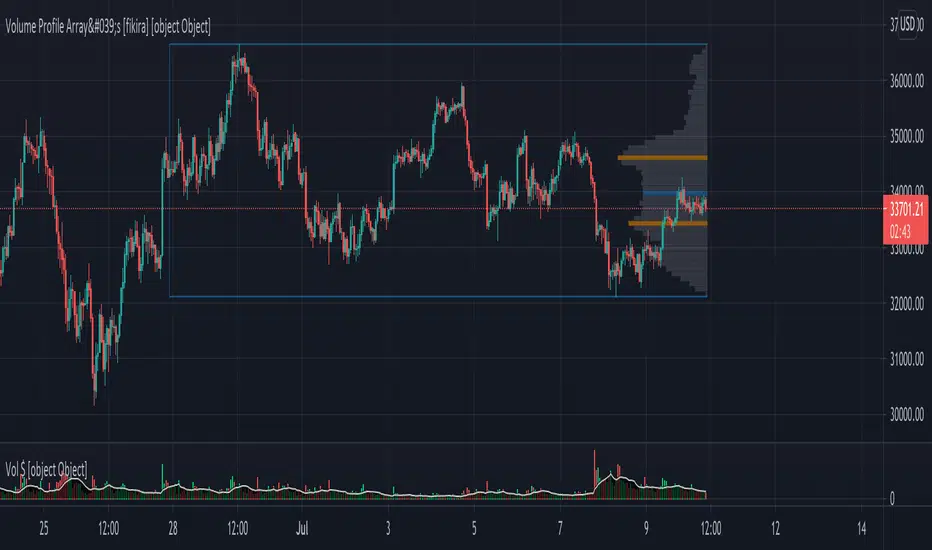
Volume Profile Array's [fikira]Inspired by © IldarAkhmetgaleev (AkhIL) - "Poor man's volume profile" - "PMVolProf"
He did a fantastic job on "Volume Profile"!
My script is about making this with array's
Settings:
- period (last x bars) for calculation
- max width (visible horizontal range)
- amount of sections (vertical sections; to many sections can give an error -> lower the sections in that case)
Setting "high/low", "close":
- "high/low"
-> the volume of every bar (in the period) which low is lower than a particular section and which high is higher than that section is added to that section
- "close"
-> here the volume of every bar (in the period) which close closes in the range of a particular section is added to that section
The orange/blue coloured "Volume lines" are the highest/lowest values above and below present close
(can be used as Support/resistance )
"Only show max/min" shows only the orange/blue Volume lines
The period and highest/lowest is show by 2 thin blue lines
Color, line width is adjustable
Cheers!
Volume Profile per day with support/resistance linesThis indicator shows the volume profile by daily blocks and draws on the chart the support or resistance lines produced by the previous volume profile block. A support line will be created if in the previous block, the VPOC line was closer to the lowest price line of that block. This support line will be placed below the VPOC line, at a distance equal to the difference between the highest price of that block and the VPOC price. For the case of the resistance line, the logic applied is analogous.
These support and resistance lines are introduced because, according to the Gaussian bell, the VPOC is likely to be located in the middle, and these deviations can be used to trace support and resistance.
In addition, the indicator includes the following features:
- Change the colors of all plotted lines.
- Define the number of daily blocks to be displayed.
- Define the resolution when calculating the volume of each candle.
- Define the number of support/resistance lines to be displayed.
- Highest and lowest price lines, as well as vpoc line, volume histogram and support and resistance lines.
- Display or not, the vpoc line and the volume histogram.
The calculations performed by the script improve if the candles used are of a lower timeframe. This indicator has been tested in several markets, including cryptos, CFDs, Forex and Indices.
Volume ProfileThis is a Volume Profile based on pine script arrays.
The main idea behind this script is from the user @IldarAkhmetgaleev .
He created an awesome piece of code for free users on tradingview.
Here are some changes to the main script:
0. Used Pine Script Arrays for doing/storing calculations.
1. The bar labels are replaced with lines.
2. Added a POC line.
3. Bar growing directions changed from right to left.
4. Added an option to change bar width.
Inputs:
0. Volume Lookback Depth : Number of bars to look back for volume calculations.
1. Bar Length Multiplier : Bar length multiplier to make bar long or short.
2. Bar Horizontal Offset : Horizontal distance from the current bar in the right direction.
3. Bar Width : Width of the bars.
4. Show POC Line : Show or hide the POC line.
Happy trading.